. 2019 Dec 9;36(6):660-673.e11.
doi: 10.1016/j.ccell.2019.11.001.

A Menin-MLL Inhibitor Induces Specific Chromatin Changes and Eradicates Disease in Models of MLL-Rearranged Leukemia

Affiliations

A Menin-MLL Inhibitor Induces Specific Chromatin Changes and Eradicates Disease in Models of MLL-Rearranged Leukemia

Andrei V Krivtsov et al. Cancer Cell. .

Abstract

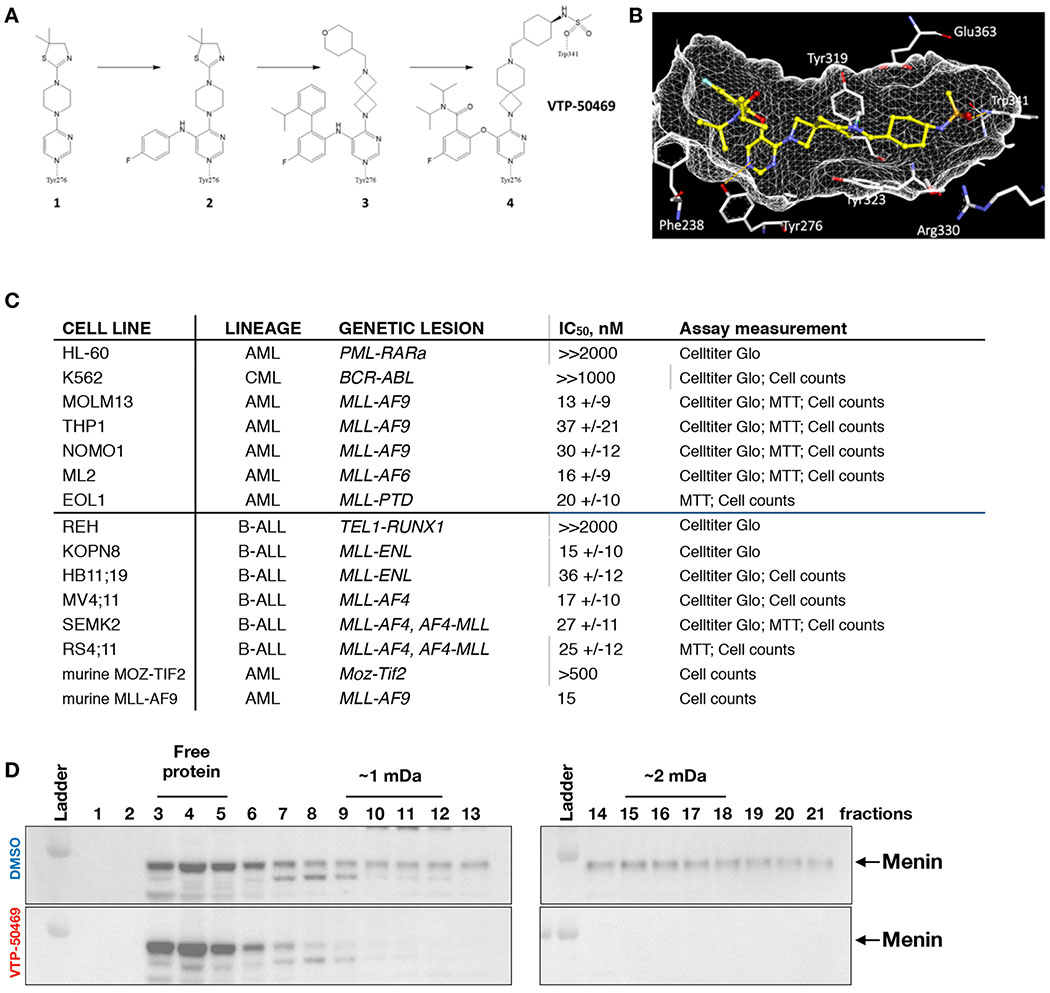
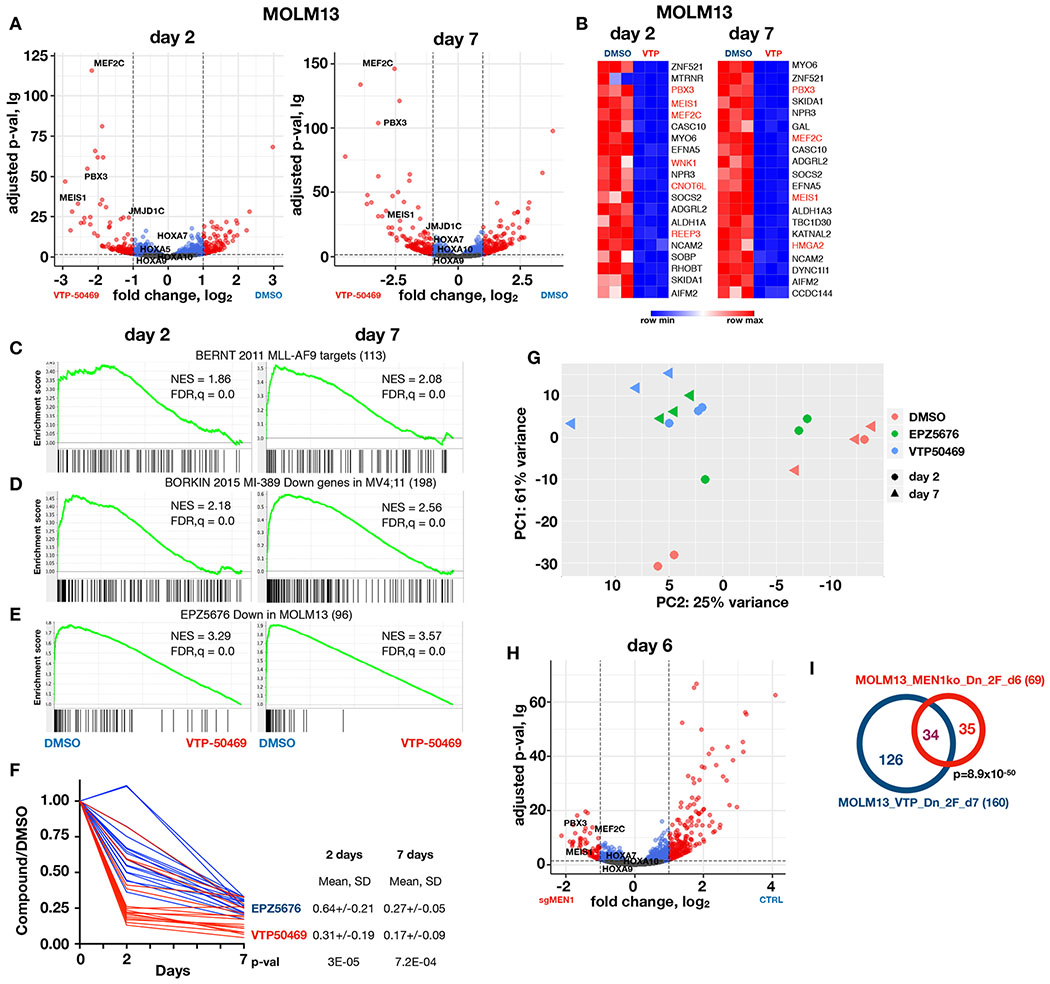
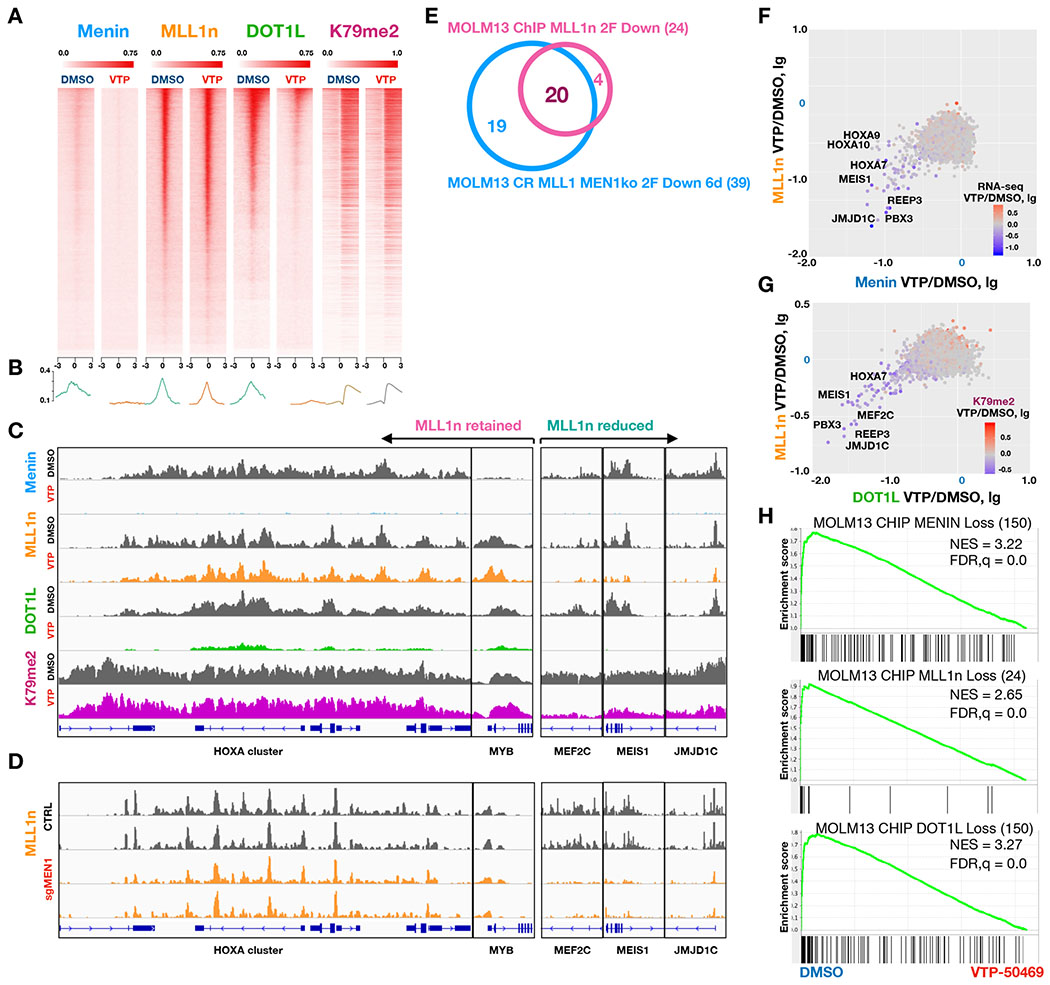
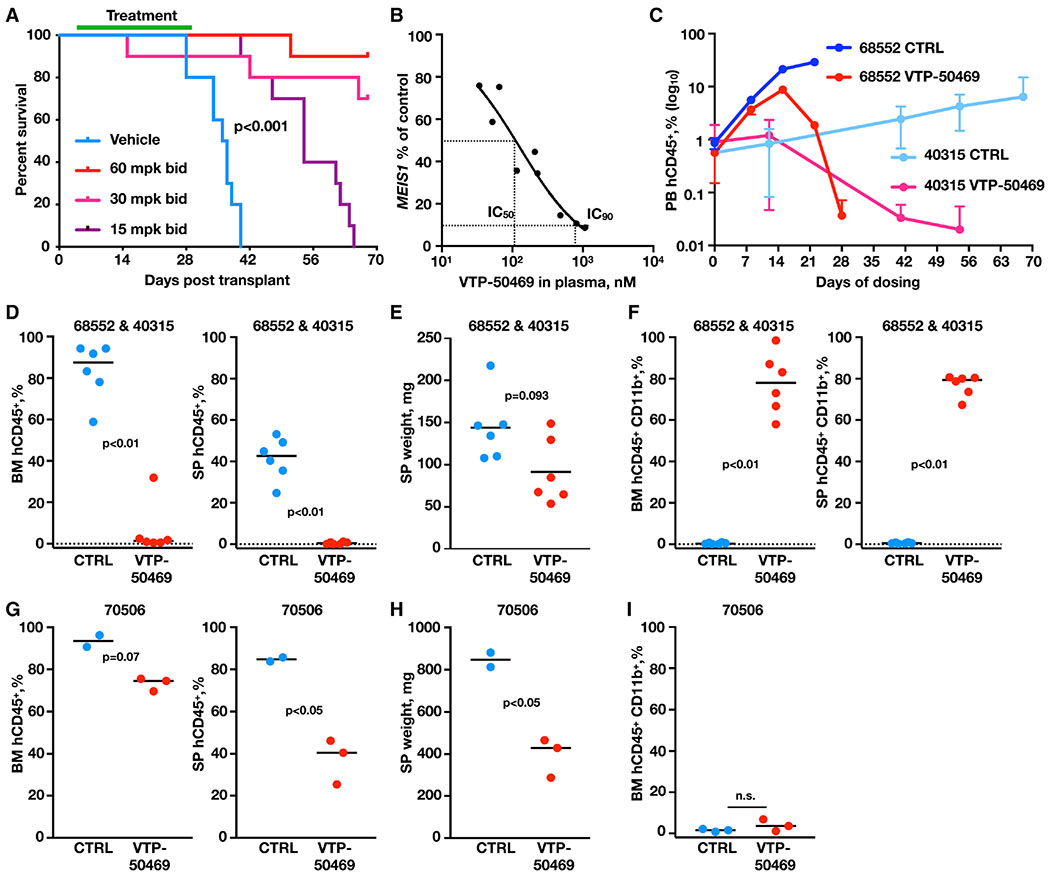
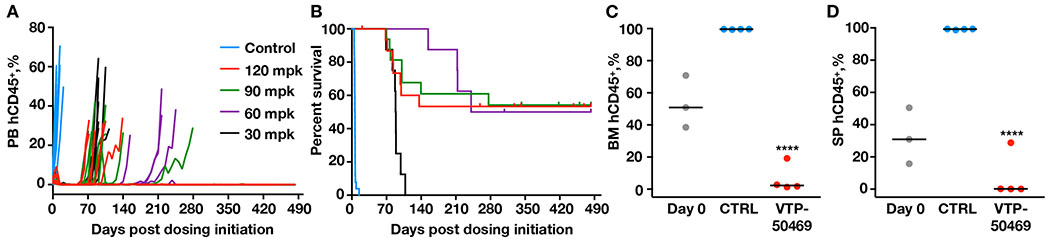
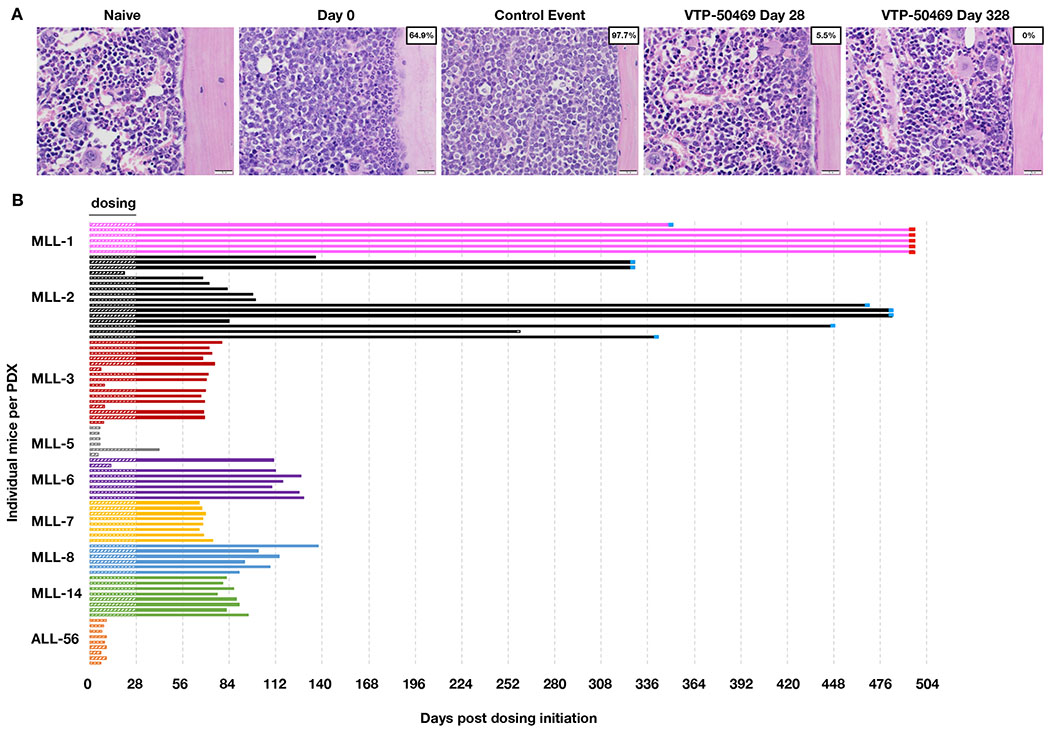
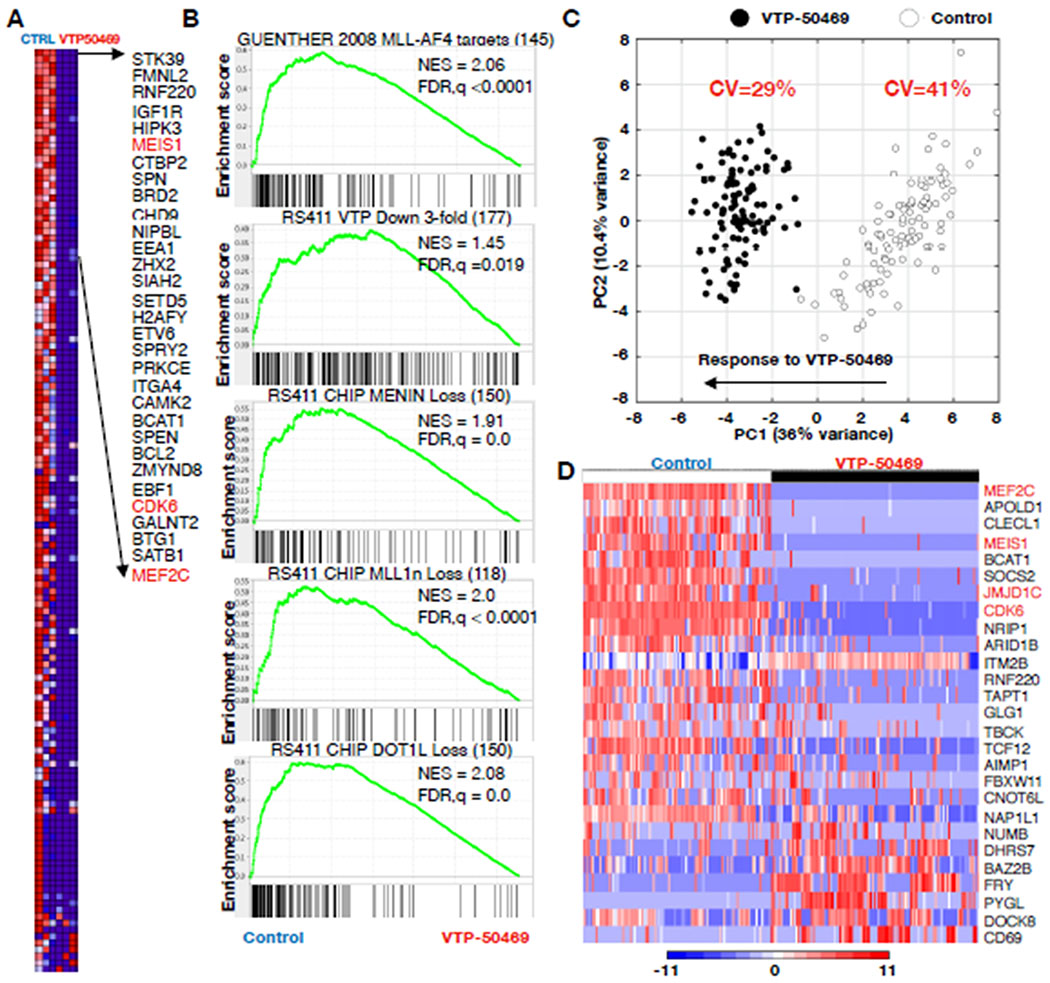
Inhibition of the Menin (MEN1) and MLL (MLL1, KMT2A) interaction is a potential therapeutic strategy for MLL-rearranged (MLL-r) leukemia. Structure-based design yielded the potent, highly selective, and orally bioavailable small-molecule inhibitor VTP50469. Cell lines carrying MLL rearrangements were selectively responsive to VTP50469. VTP50469 displaced Menin from protein complexes and inhibited chromatin occupancy of MLL at select genes. Loss of MLL binding led to changes in gene expression, differentiation, and apoptosis. Patient-derived xenograft (PDX) models derived from patients with either MLL-r acute myeloid leukemia or MLL-r acute lymphoblastic leukemia (ALL) showed dramatic reductions of leukemia burden when treated with VTP50469. Multiple mice engrafted with MLL-r ALL remained disease free for more than 1 year after treatment. These data support rapid translation of this approach to clinical trials.

Keywords: DOT1L; MLL fusion; Menin inhibitor; acute myeloid leukemia (AML); chromatin remodeling; infant B cell acute lymphoblastic leukemia (B-ALL); leukemia.


Conflict of interest statement

DECLARATION OF INTERESTS

S.A.A. has been a consultant and/or shareholder for Epizyme Inc, Vitae/Allergan Pharmaceuticals, Imago Biosciences, Cyteir Therapeutics, C4 Therapeutics, Syros Pharmaceuticals, OxStem Oncology, Accent Therapeutics and Mana Therapeutics. S.A.A. has received research support from Janssen, Novartis, and AstraZeneca. G.M.M. is a shareholder of Syndax Pharmaceuticals. All other authors declare no conflicts of interest.

Figures

Figure 1.
Figure 1.. Development of VTP50469
(A) Molecules 1 through 4 in medicinal chemistry development of VTP50469. Dotted lines indicate VTP50469 potential interactions with Y276 and W341 of Menin. (B) Crystal structure of VTP50469 bound in Menin pocket. (C) Table summarizing VTP50469 IC50 concentrations in MLL-r and control cell lines obtained in cell proliferation experiments. IC50 mean +/− SD. (D) Western blot analysis of size fractionated nuclear lysates from DMSO or VTP50469 treated MOLM13 cells with Menin anitbody.
Figure 2.
Figure 2.. Gene Expression Changes Induced by VTP50469
(A) Volcano-plot of RNA-seq data obtained from MOLM13 cells treated with VTP50469. Selected MLL-fusion target genes are labeled. (B) Heat map of top 20 most suppressed genes after 2- and 7-day VTP50469 treatment in MOLM13 cells. MLL-fusion target genes are in red. (C-E) GSEA of gene expression changes in MOLM13 cells treated with VTP50469 compared to (C) 113 MLL-AF9 target genes; (D) 198 genes suppressed by MI-389 in MV4;11 cells; (E) 96 genes suppressed by treatment with EPZ5676 in MOLM13 cells. (F) DMSO-normalized relative expression of 17 genes that lose expression >3-fold after 7 days EPZ5676 (1 μM) or VTP50469 (330 nM) treatment in MOLM13 cells. The table shows gene expression changes at 2 and 7 days. (G) PCA clustering of gene expression in MOLM13 cells after 2 or 7 days of treatment with VTP50469 or EPZ5676. (H) Volcano-plot of RNA-seq data obtained from MOLM13-Cas9 cells infected with MEN1 or control sgRNA at day 6. Selected MLL-fusion targets genes are labeled. (I) Venn diagram depicting the overlap of genes that are suppressed >2-fold by either VTP50469 treatment (7 days) or MEN1 knock-out (6 days).
Figure 3.
Figure 3.. VTP50469 Remodels MLL-Fusion Chromatin-Associated Complexes
(A-B) Menin, MLL1n, DOT1L, and H3K79me2 ChIP-seq data in MOLM13 cells treated with VTP50469 or DMSO were plotted as (A) heat-map/tornado plots of TSS±3kb, (B) average/meta-plots of 113 MLL-AF9 targets TSS±3kb. (C) Gene tracks of Menin, MLL1n, DOT1L and H3K79me2 ChIP-seq signals (RPM) at selected MLL-AF9 target genes in MOLM13 cells treated with VTP50469. (D) Gene tracks of MLL1n CUT&RUN signal on selected MLL-AF9 target genes in control (CTRL) and MEN1 knock-out MOLM13 cells. (E) Venn diagram depicting the overlap in genes that lose MLL1n occupancy (>2-fold) after VTP50469 treatment or CRISPR deletion of MEN1. (F) Scatter plot depicting correlation of MLL1n and Menin gene occupancy after VTP50469 treatment in MOLM13 cells. VTP50469/DMSO ratios shown as log10 values. Gene expression levels are indicated in the heatmap. (G) Scatter plot depicting correlation of MLL1n and DOT1L gene occupancy after 3-day treatment with VTP50469 in MOLM13 cells. VTP50469/DMSO ratios shown as log10 values. H3K79me2 levels at genes are indicated in the heatmap. (H) GSEA of gene expression changes in MOLM13 cells treated with VTP50469 for 7 days compared to genes that lose Menin, MLL1n, or DOT1L chromatin occupancy.
Figure 4.
Figure 4.. Establishing an Effective VTP50469 Dose In Vivo
(A) Kaplan-Meyer survival curves of NSG mice engrafted with MV4;11 cells and dosed with VTP50469 as indicated. Green bar indicates the 28-day treatment period (n = 10). (B) PK/PD assessment of MEIS1 expression in MV4;11 cells engrafted in nude rats compared to VTP50469 plasma concentration after dosing using implanted micropumps. (C) %hCD45+ cells in the peripheral blood (PB) of NSG mice transplanted with MLL-r AML PDX (68552 or 40315) on either control or 0.1% VTP50469 mouse chow. Bars represent SD. (D, G) %hCD45+ cells in the bone marrow (BM) and spleens (SP) of mice dosed for 28 days with 0.1% VTP50469 chow or control diet. Bars = median, t-test was used to calculate p-value. (E, H) Spleen weights from PDX mice dosed in (D). Bars = median, t-test was used to calculate p-value. (F, I) FACS assessment of CD11b surface expression in BM isolated from PDX mice dosed as in (D) Bars represent the median, t-test was used to calculate p-value.
Figure 5.
Figure 5.. In Vivo Activity of VTP50469 in MLL-r B-ALL PDX Models
(A) %hCD45+ over time in the PB of NSG mice transplanted with an MLL-r B-ALL PDX (MLL-2) and treated with the indicated doses of VTP50469, BID. Treatment was administered for the first 28 days. (B) Kaplan-Meier survival analysis of the mice treated in (A). Vertical notches indicate non-leukemia-related events. (C-D) Post-mortem analysis of %hCD45 in the BM (C) and spleen (D) of mice treated with control or VTP50469 (120 mg/kg) at Day 0, Day 28 or event (whichever occurred sooner). Bars = median; p < 0.0001.
Figure 6.
Figure 6.. VTP50469 Increases Survival of Mice Engrafted with MLL-r B-ALL PDXs
(A) H&E staining of the BM of naïve and MLL-2-engrafted mice treated with control or VTP50469 at Day 0, 28, and 328. Boxes indicate the %hCD45+. Bar, 10 μm. (B) Swimmer plot of EFS of individual mice engrafted with 8 MLL-r B-ALL PDXs (MLL-1, 2, 3, 5, 6, 7, 8, 14) and a BCR-ABL1 B-ALL PDX (ALL-56) treated with VTP50469 (120 mg/kg BID 28 days). Hatched area indicates 28 day treatment period. Blue blocks on the end of the lanes indicate mice that were euthanized for non-leukemia related events. Red blocks on the end of the lanes indicated mice that are ongoing in the study.
Figure 7.
Figure 7.. VTP50469 Treatment Suppresses MLL-Fusion Target Genes in MLL-r ALL PDX Cells In Vivo
(A) Heatmap representation of gene expression of 145 MLL-AF4 target genes expressed in MLL-r B-ALL PDX cells isolated from mice after 28 day dosing with control or VTP50469 chow. (B) GSEA of gene expression changes from PDX cells treated compared to MLL-AF4 target genes; VTP50469 sensitive genes in RS4;11 cells that lose occupancy by Menin, MLL1n or DOT1L. (C) PCA of single-cell gene expression in MLL-r ALL PDX after 28 day treatment with VTP50469 or vehicle using genes that lose MLL1n chromatin occupancy. (D) Heatmap representation of the 27 genes defined in (C).

Comment in

References

    1. Anders S, Pyl PT, and Huber W (2015). HTSeq--a Python framework to work with high-throughput sequencing data. Bioinformatics (Oxford, England) 31, 166–169. - PMC - PubMed
    1. Armstrong SA, Staunton JE, Silverman LB, Pieters R, den Boer ML, Minden MD, Sallan SE, Lander ES, Golub TR, and Korsmeyer SJ (2002). MLL translocations specify a distinct gene expression profile that distinguishes a unique leukemia. Nat Genet 30, 41–47. - PubMed
    1. Bernt KM, Zhu N, Sinha AU, Vempati S, Faber J, Krivtsov AV, Feng Z, Punt N, Daigle A, Bullinger L, et al. (2011). MLL-rearranged leukemia is dependent on aberrant H3K79 methylation by DOT1L. Cancer Cell 20, 66–78. - PMC - PubMed
    1. Bitoun E, Oliver PL, and Davies KE (2007). The mixed-lineage leukemia fusion partner AF4 stimulates RNA polymerase II transcriptional elongation and mediates coordinated chromatin remodeling. Hum Mol Genet 16, 92–106. - PubMed
    1. Borkin D, He S, Miao H, Kempinska K, Pollock J, Chase J, Purohit T, Malik B, Zhao T, Wang J, et al. (2015). Pharmacologic inhibition of the Menin-MLL interaction blocks progression of MLL leukemia in vivo. Cancer Cell 27, 589–602. - PMC - PubMed

Publication types

MeSH terms