. 2020 Mar:208:116450.
doi: 10.1016/j.neuroimage.2019.116450. Epub 2019 Dec 9.

Harmonization of large MRI datasets for the analysis of brain imaging patterns throughout the lifespan

Affiliations

Harmonization of large MRI datasets for the analysis of brain imaging patterns throughout the lifespan

Raymond Pomponio et al. Neuroimage. 2020 Mar.

Abstract

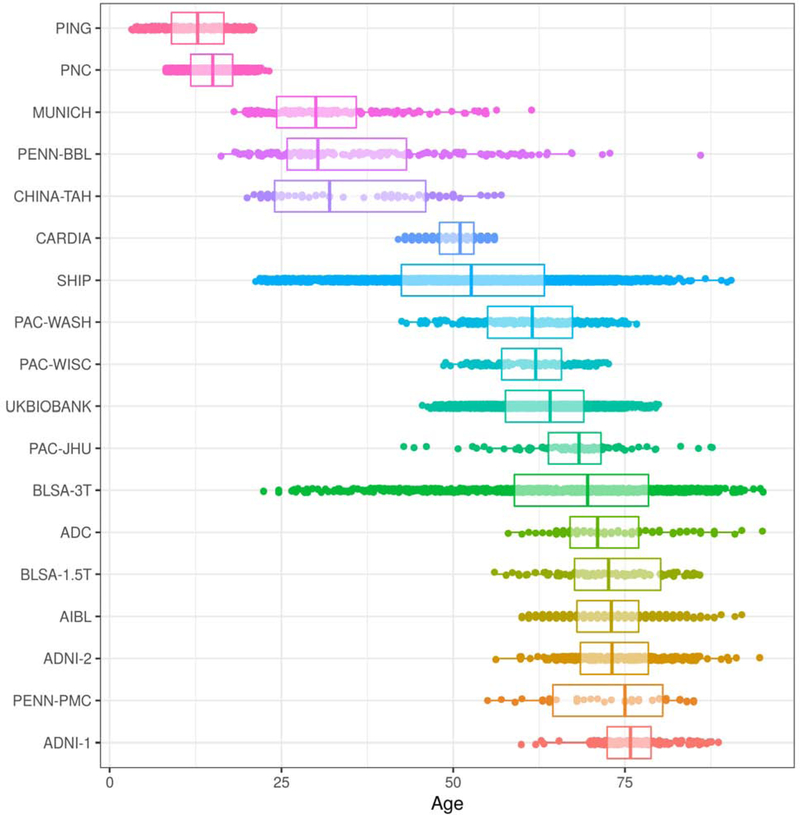
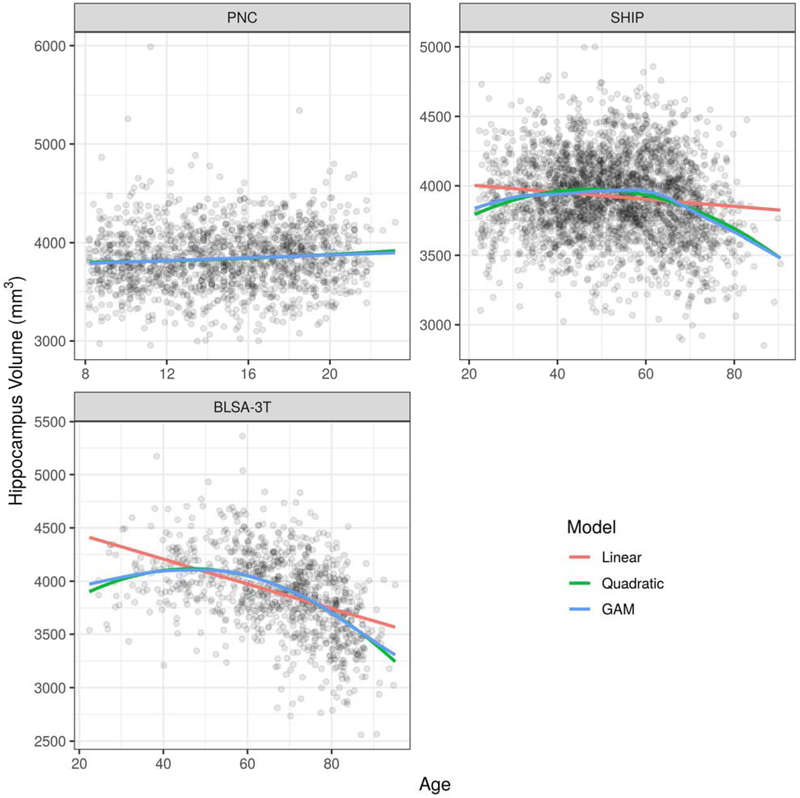
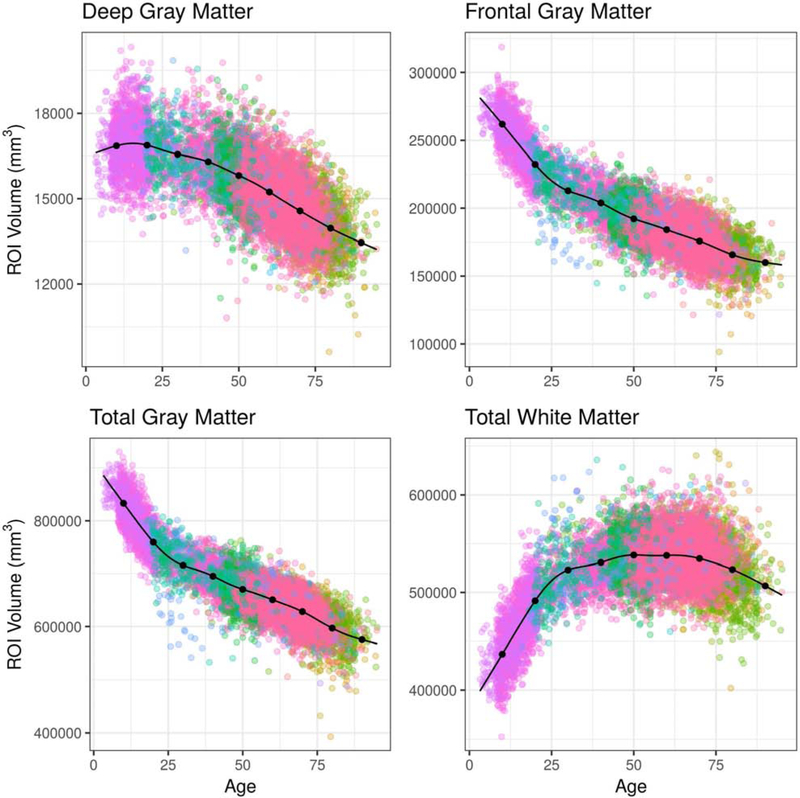
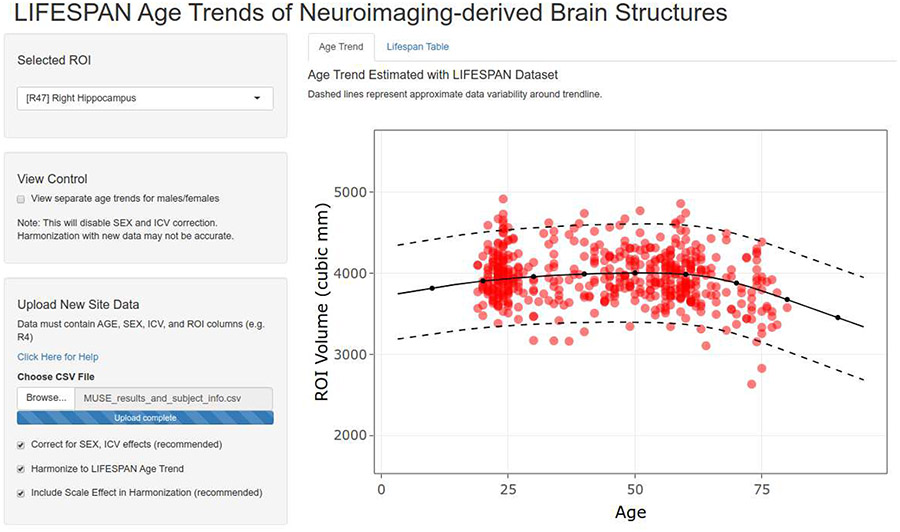
As medical imaging enters its information era and presents rapidly increasing needs for big data analytics, robust pooling and harmonization of imaging data across diverse cohorts with varying acquisition protocols have become critical. We describe a comprehensive effort that merges and harmonizes a large-scale dataset of 10,477 structural brain MRI scans from participants without a known neurological or psychiatric disorder from 18 different studies that represent geographic diversity. We use this dataset and multi-atlas-based image processing methods to obtain a hierarchical partition of the brain from larger anatomical regions to individual cortical and deep structures and derive age trends of brain structure through the lifespan (3-96 years old). Critically, we present and validate a methodology for harmonizing this pooled dataset in the presence of nonlinear age trends. We provide a web-based visualization interface to generate and present the resulting age trends, enabling future studies of brain structure to compare their data with this reference of brain development and aging, and to examine deviations from ranges, potentially related to disease.

Keywords: Brain; FreeSurfer; MRI; MUSE; ROI; Segmentation.


Conflict of interest statement

Declaration of competing interest The authors declare that they have no competing interests.

Figures

Figure 1:
Figure 1:
Age distributions of studies that are part of the LIFESPAN dataset, sorted by median age. The study with youngest median age, PING, contains participants from age 3 to 21. The study with oldest median age, ADNI-1, contains participants from age 59 to 89.
Figure 2:
Figure 2:
Comparison of age trend estimates for the hippocampus volume from three studies (PNC, SHIP, and BLSA-3T) using linear models, quadratic models, and GAMs. The age trends plotted are for females and assume an average intra-cranial volume (ICV). In the top-left panel, the difference between fits is not distinguishable. In the top-right panel and the bottom-left panel, both the quadratic fit and the GAM fit exhibit clear improvement over the linear fit.
Figure 3:
Figure 3:
Four possible scenarios under the constraints of Simulation Experiment I, which assessed the effect of different degrees of age overlap and sample size on harmonization performance. The age range of Site-B was free to vary from younger to older ages. In the upper-left panel, Site-B is overlapping only Site-A and not Site-C. In the lower-right panel, Site-B is overlapping only Site-C and not Site-A. In the upper-right panel and lower-left panel, Site-B is partially-overlapping both Site-A and Site-C.
Figure 4:
Figure 4:
The relationship between the age trend estimation error and the two free parameters of Simulation Experiment I: the age range of Site-B and the sample size of each site. Note: 1 Estimation Error is expressed as the relative Mean Absolute Error (rMAE) of age trend estimation across 10 randomized repetitions for each cell in the grid.
Figure 5:
Figure 5:
The relationship between the age trend estimation error and the proportion of sub-sampling from Site-B in Simulation Experiment II. The original sample size of Site-B was four times larger than that of Site-A and Site-C. At 0.25, the size of Site-B after sub-sampling was equal to the size of Site-A and Site-C. At 0.5, the size of Site-B after sub-sampling was equal to the twice the size of Site-A and Site-C. Results were optimal when all data points were used. Note: 1Sub-sampling proportion was defined as the size of the sub-sampled size versus the original sample size of Site-B. 2Age Trend Estimation Error is expressed as the relative Mean Absolute Error (rMAE) of age trend estimation.
Figure 6:
Figure 6:
Comparison of hippocampus volumes before and after harmonization, correcting for age, sex, and ICV using a GAM. Studies are ordered from youngest to oldest based on median age. In the left panel, volumes were not adjusted for site. In the right panel, volumes were adjusted with ComBat-GAM, which removes location (mean) and scale (variance) differences across sites after controlling for biological covariates. Horizontal lines are plotted at constants at 0, −200, and 200 for visual aid. Comparisons for additional ROI volumes are shown in Supplementary Figure 1.
Figure 7:
Figure 7:
Comparison of age prediction results using three harmonization methods and 10-fold cross validation with a fully-connected neural network using ROI Volumes as input features. MAE is the mean absolute error (i.e. actual age minus predicted age). In the top-left panel, data were unadjusted for site. In the top-right panel, data were harmonized with ComBat using a linear model. In the bottom-left panel, data were harmonized using ComBat-GAM.
Figure 8:
Figure 8:
Age trends for selected ROI volumes using the combined LIFESPAN dataset with 18 studies spanning the age range 3 – 96. Data were harmonized using ComBat-GAM. The age trends plotted are for females and assume an average intra-cranial volume (ICV).
Figure 9:
Figure 9:
Age trends for selected composite ROI volumes using the combined LIFESPAN dataset with 18 studies spanning the age range 3 – 96. Composite ROI volumes were obtained by combining single ROIs into larger anatomical regions following a predefined ROI hierarchy. Data were harmonized using ComBat-GAM. The age trends plotted are for females and assume an average intra-cranial volume (ICV).
Figure 10:
Figure 10:
Screenshot of the web-based application that allows visualization of the age trend for each anatomical ROI in our dataset. In red, an independent dataset has been uploaded after MUSE segmentation. New values are aligned to the LIFESPAN age trend by removing the location (mean) and scale (variance) differences between new ROI volumes and the reference dataset after controlling for age, sex, and ICV. The application is hosted at the following URL: https://rpomponio.shinyapps.io/neuro_lifespan/.

References

    1. Fjell AM and Walhovd KB, 2010. Structural Brain Changes in Aging: Courses, Causes and Cognitive Consequences. Reviews in the Neurosciences 21 (3), 187–221. 10.1515/REVNEURO.2010.21.3.187. - DOI - PubMed
    1. Habes M, Janowitz D, Erus G, Toledo JB, Resnick SM, Doshi J, Van der Auwera S, Wittfeld K, Hegenscheid K, Hosten N, Biffar R, Homuth G, Völzke H, Grabe HJ, Hoffman W, Davatzikos C, 2016. Advanced brain aging: relationship with epidemiologic and genetic risk factors, and overlap with Alzheimer disease atrophy patterns. Translational Psychiatry 6, 775 10.1038/tp.2016.39. - DOI - PMC - PubMed
    1. Courchesne E, Chisum HJ, Townsend J, Cowles A, Covington J, Egaas B, Harwood M, Hinds S, Press GA, 2000. Normal Brain Development and Aging: Quantitative Analysis at in Vivo MR Imaging in Healthy Volunteers. Radiology 213 (3). 10.1148/radiology.216.3.r00au37672. - DOI - PubMed
    1. Sowell ER, Thompson PM, Tessner KD, Toga AW, 2001. Mapping continued brain growth and gray matter density reduction in dorsal frontal cortex: Inverse relationships during postadolescent brain maturation. Journal of Neuroscience 21 (22), 8819–8829. 10.1523/JNEUROSCI.21-22-08819.2001. - DOI - PMC - PubMed
    1. Toga AW, Thompson PM, Sowell ER, 2006. Mapping brain maturation. Trends in Neurosciences 29 (3), 148–159. 10.1016/j.tins.2006.01.007. - DOI - PMC - PubMed

Publication types

MeSH terms