. 2019 Dec 20:22:409-422.
doi: 10.1016/j.isci.2019.11.038. Epub 2019 Nov 25.

Using Gene Editing to Establish a Safeguard System for Pluripotent Stem-Cell-Based Therapies

Affiliations

Using Gene Editing to Establish a Safeguard System for Pluripotent Stem-Cell-Based Therapies

Youjun Wu et al. iScience. .

Abstract

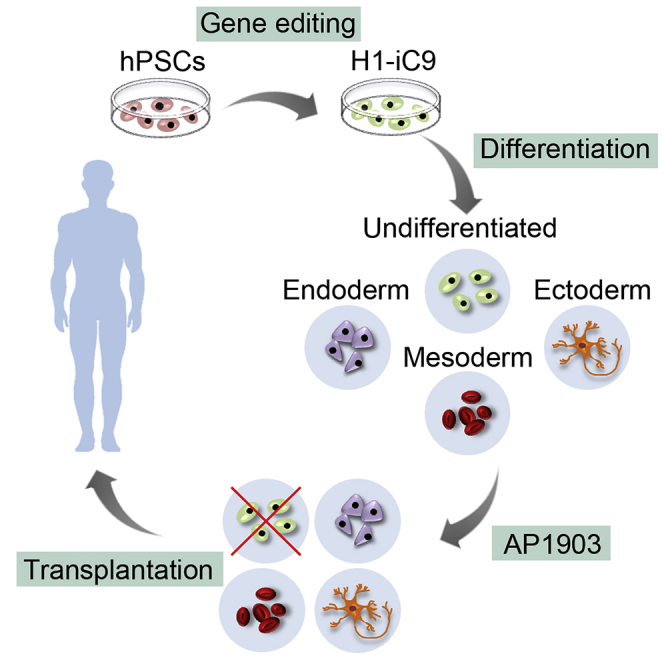
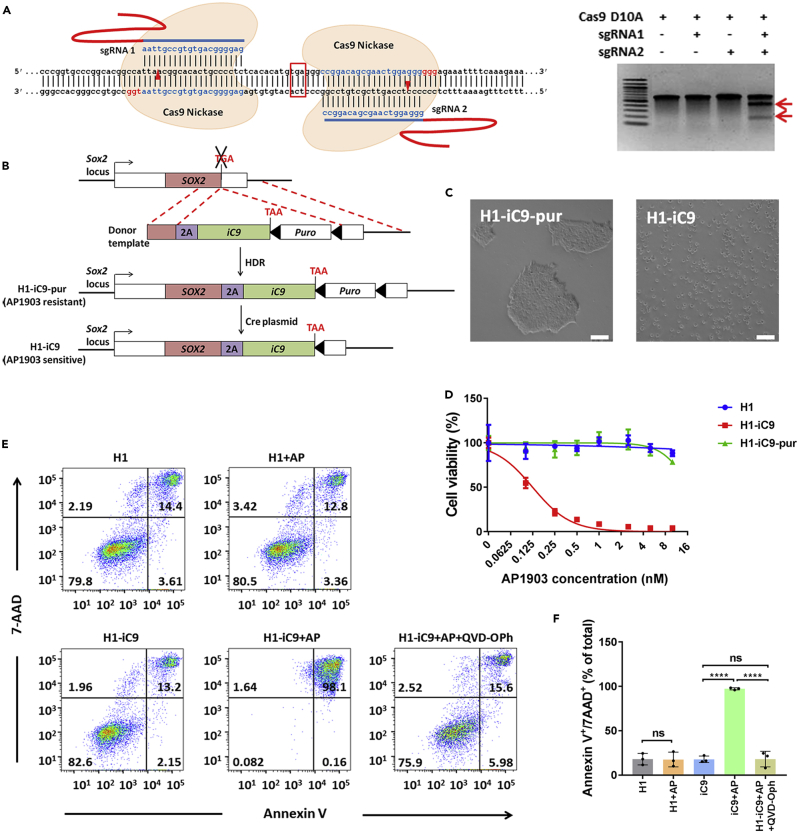
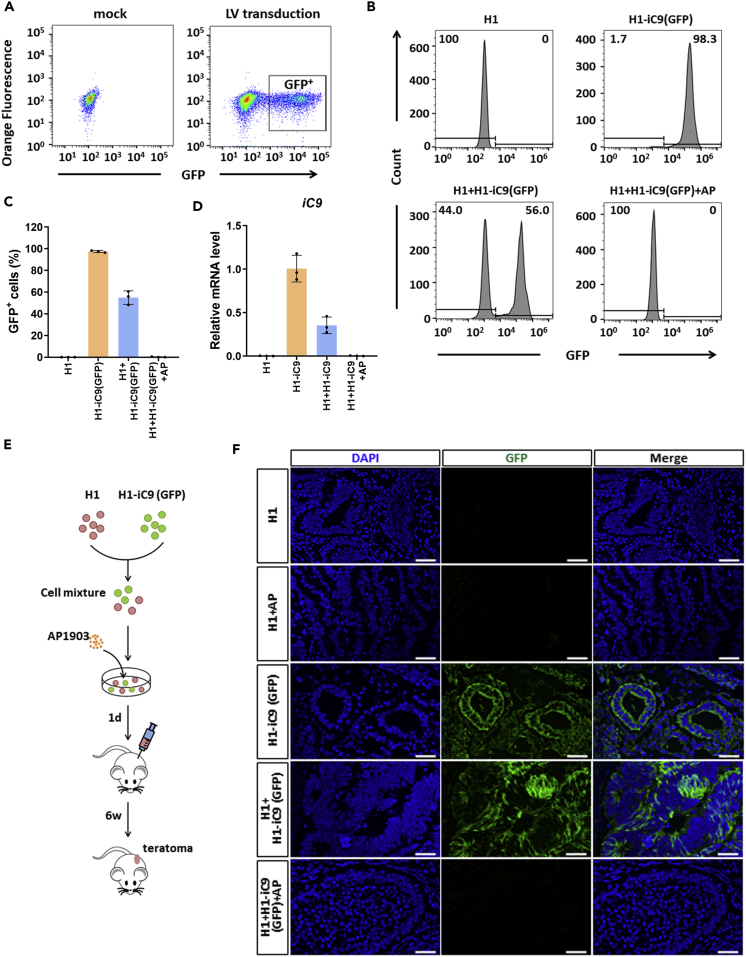
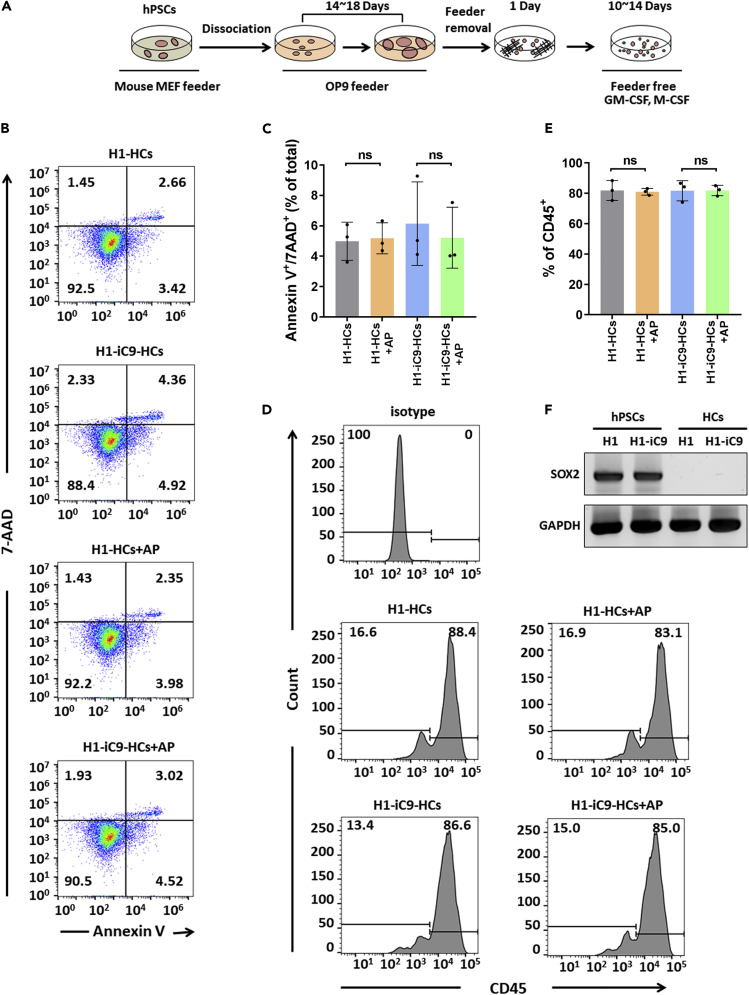
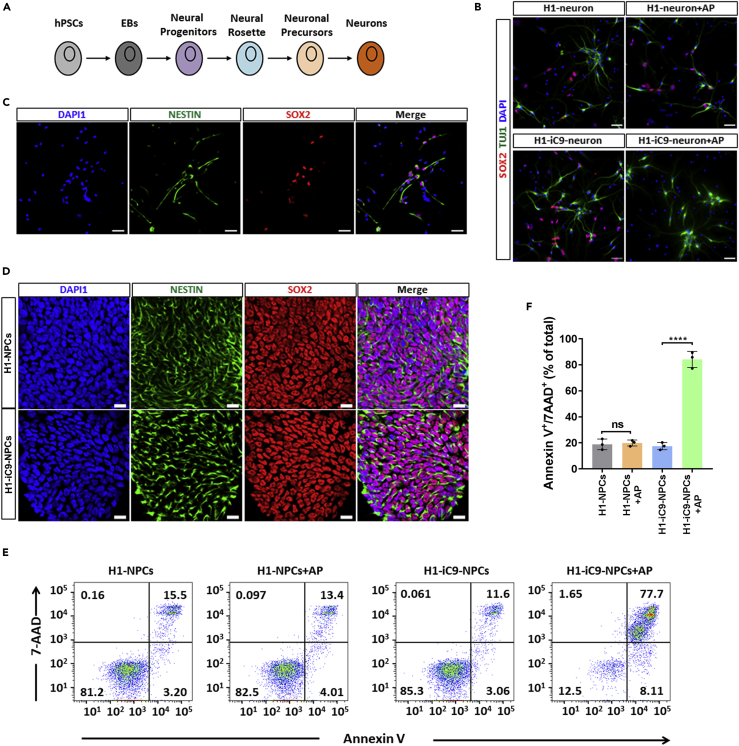
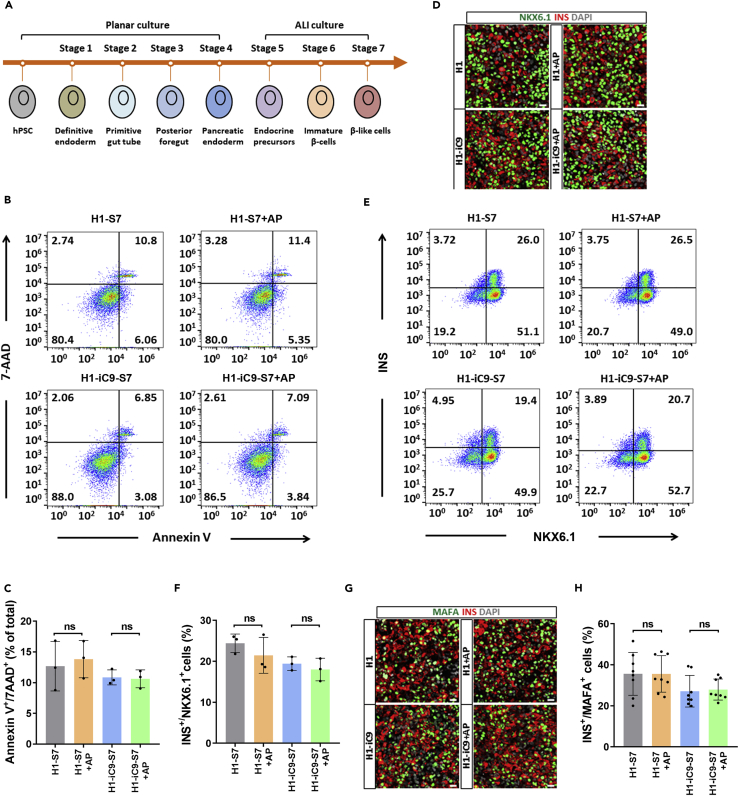
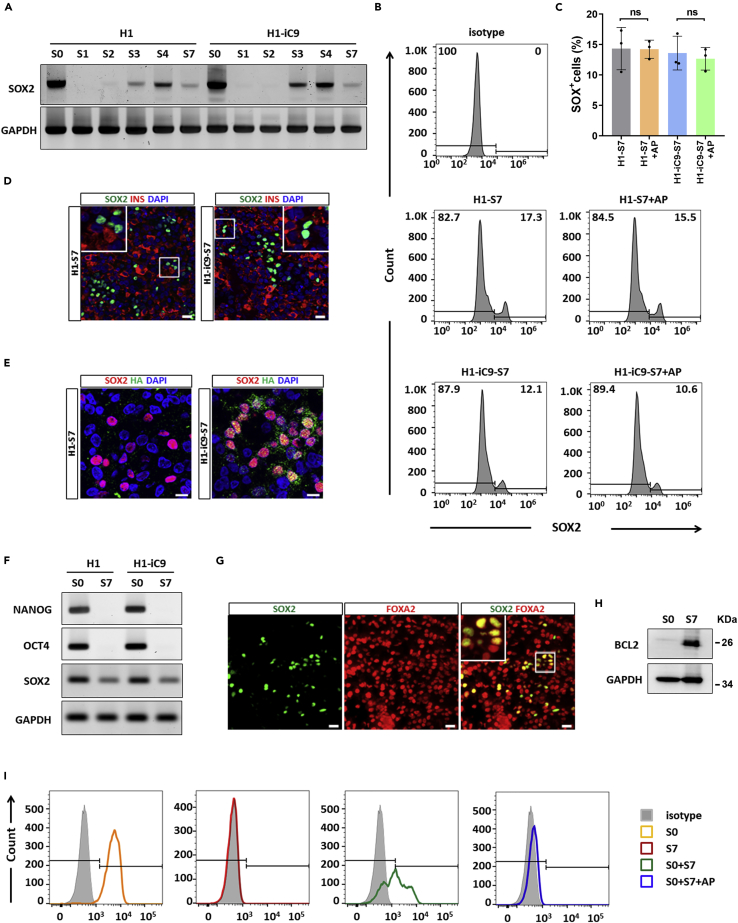
A major challenge in using human pluripotent stem cells (hPSCs) in therapy is the risk of teratoma formation due to contaminating undifferentiated stem cells. We used CRISPR-Cas9 for in-frame insertion of a suicide gene, iC9, into the endogenous SOX2 locus in human embryonic stem cell (ESC) line H1 for specific eradication of undifferentiated cells without affecting differentiated cells. This locus was chosen over NANOG and OCT4, two other well-characterized stem cell loci, due to significantly reduced off-target effect. We showed that undifferentiated H1-iC9 cells were induced to apoptosis by iC9 inducer AP1903, whereas differentiated cell lineages including hematopoietic cells, neurons, and islet beta-like cells were not affected. We also showed that AP1903 selectively removed undifferentiated H1-iC9 cells from a mixed cell population. This strategy therefore provides a layer of safety control before transplantation of a stem-cell-derived product in therapy.

Keywords: Cellular Therapy; Stem Cells Research; Techniques in Genetics.


Conflict of interest statement

The authors indicated no competing interests.

Figures

None
Graphical abstract
Figure 1
Figure 1
CRISPR-Cas9-Mediated iC9 Gene Insertion into the SOX2 Locus Renders H1 Cells Susceptible to the Killing by AP1903 (A) Left: sequences of sgRNA1, sgRNA2, and their genomic targets in the SOX2 locus. Stop codon of the SOX2 coding region is boxed. PAM sequence is labeled in red. Cleavage site of CRISPR-Cas9 is marked by the red arrowhead. Right: Cas9 D10A nickase-mediated cleavage of the SOX2 genomic target was analyzed by the Surveyor assay in transiently transfected HEK293T cells. Two red arrows mark the expected cleavage products. (B) Scheme to use CRISPR-Cas9 to establish H1 clones with in-frame insertion of the 2A-iC9 transgene into the endogenous SOX2 locus (H1-iC9-pur clone) and to remove the Puro gene by Cre/loxP-mediated excision (H1-iC9 clone). Broken lines specify the regions of homology between the donor template and the SOX2 locus for homologous recombination. Filled arrowheads indicate the loxP site. HDR: homology-directed recombination. (C) AP1903 treatment of H1-iC9-pur and H1-iC9 cells. Treatment was carried out overnight in media containing 100 nM AP1903. Scale bar = 50 μm. (D) Cell viability after overnight treatment with AP1903 at the indicated concentration determined by MTS assay for H1, H1-iC9-pur, and H1-iC9 cells. The iC50 of AP 1903 in H1-iC9 cells was 0.1242 ± 0.0083 nM calculated from the dose-response curve. Values represent mean ± s.d. (N = 4 independent experiments). (E and F) Analysis of apoptotic cells after overnight treatment with AP1903 at a concentration of 10 nM. qVD-Oph at a concentration of 20 mM was applied simultaneously with AP1903 for overnight treatment. Representative FACS profiles (E) and the bar graph that depicts Annexin V+/7AAD+ apoptotic cells from three independent experiments (F) were shown. Bars indicate the mean (±s.d.) of individual data points. ****p < 0.0001, ns: not statistically significant.
Figure 2
Figure 2
iC9-Expressing Cells Are Selectively Eradicated by AP1903 (A) Marking of H1-iC9 cells with GFP. Structure of the lentiviral vector containing the GFP gene is shown. H1-iC9 cells were transduced with the GFP vector at a multiplicity of infection of two, followed by cell sorting 48 h after transduction. GFP+ cells were pooled and expanded. (B and C) Flow cytometry analysis of H1 and H1-iC9(GFP) cells either alone or in mixtures with and without AP1903 treatment as indicated. (B) FACS plots present the percentage of GFP+ cells in each group. (C) Bar graph shows mean (±s.d.) of pooled data from three independent experiments. (D) Expression of iC9 transgene mRNA in the indicated cells. Results of three independent experiments are shown as the mean ± s.d. (E) Experimental scheme for the teratoma formation assay. H1 and H1-iC9(GFP) cells were mixed at an equal dose and either mock treated or treated with AP1903 overnight at a concentration of 10 nM, followed by subcutaneous injection of 2 × 106 cells into NSG mice with four mice per group. Teratomas were removed six weeks after injection. (F) Representative immunofluorescence staining of GFP in teratoma sections derived from indicated cells. Scale bar = 50 μm.
Figure 3
Figure 3
Effect of AP1903 Treatment on H1-iC9-Derived Hematopoietic Cells (A) Scheme of differentiation from hPSCs to hematopoietic cells. (B and C) Flow cytometry analysis of apoptosis of hematopoietic cells derived from H1 and H1-iC9 cells with AP1903 treatment. Representative FACS profiles (B) and the bar graph showing percentage of apoptotic cells from three independent experiments (C) were shown and presented as the mean ± s.d. ns: p value not significant. (D and E) The fraction of CD45+ hematopoietic cells derived from H1 and H1-iC9 differentiation was not affected by AP1903 treatment. Mock- or AP1903-treated hematopoietic cells were analyzed by flow cytometry. FACS plots (D) and bar graph that represents the frequency of CD45+ (E) were shown and presented as the mean ± s.d. (N = 3 independent experiments) ns: not statistically significant. (F) Semi-quantitative RT-PCR analysis of the SOX2 transcript in undifferentiated H1 and H1-iC9 cells as well as in the hematopoietic populations derived from these two cell lines.
Figure 4
Figure 4
Effect of AP1903 Treatment on H1-iC9-Derived Neuronal Cells (A) Scheme of neuron differentiation from hPSCs. (B and C) Representative immunofluorescence staining of SOX2/TUJ1 (B) and SOX2/NESTIN (C) in mock- and AP1903-treated neuronal cultures derived from H1 and H1-iC9 cells. Scale bar = 50 μm. (D) Representative immunofluorescence staining of Nestin and SOX2 in NPCs derived from H1 and H1-iC9 cells. Scale bar = 50 μm. (E) Representative of flow cytometry analysis of cell apoptosis after overnight treatment of H1 and H1-iC9-derived NPCs with AP1903. (F) Quantification of the apoptotic cell fraction from three independent experiments. Bars indicate the mean ± s.d., ****p < 0.0001, ns: not statistically significant.
Figure 5
Figure 5
H1-iC9-Derived Beta-like Cells Are Resistant to AP1903 Treatment (A) Seven-stage differentiation of hPSCs into beta-like cells. Cells were grown in monolayer from stage 1 to stage 4 and in an air-liquid (ALI) interphase from stage 5 to stage 7. (B) Flow cytometry analysis of the apoptotic cells in the S7 population derived from H1 and H1-iC9 cells after overnight AP1903 treatment. (C) Quantification of the fraction of Annexin V+/7AAD+ apoptotic cells from three independent experiments. Data present the mean frequency ±s.d., ns: not statistically significant. (D) Representative immunofluorescence staining of NKX6.1+/INS+ cells in the S7 population derived from H1 and H1-iC9 cells with and without AP1903 treatment. (E) Flow cytometry analysis of NKX6.1+ and INS+ cells in H1 or H1-iC9-derived S7 cells with and without AP1903 treatment. (F) Quantification of NKX6.1+/INS+ cell proportion from three independent experiments. Data indicate the mean ± s.d., ns: not statistically significant. (G) Representative immunofluorescence staining of MAFA+ and INS+ cells. (H) Quantification of the fraction of MAFA+/INS+ beta-like cells. Bars represent the mean ± s.d. from three independent experiments, ns: not statistically significant. MAFA+/INS+ beta-like cells were counted in eight randomly picked fields. Scale bar = 20 μm.
Figure 6
Figure 6
SOX2+ Cells in the S7 Population Remain Viable after AP1903 Treatment Are Not Undifferentiated Stem Cells (A) Reactivation of SOX2 expression during H1 and H1-iC9 cell differentiation into beta-like cells. Semi-quantitative RT-PCR was carried out using total RNAs isolated from the indicated differentiation stages as defined by Rezania et al. (Rezania et al., 2014). (B and C) Resistance to AP1903 treatment of SOX2+ cells in the S7 population. Flow cytometry analysis of the SOX2+ expression in mock- and AP1903-treated S7 populations derived from H1 and H1-iC9 cells and quantification of SOX2+ proportion from B. Bars present the mean ± s.d. of three independent experiments. ns: not statistically significant. (D) Representative immunofluorescence staining of SOX2 and insulin in S7 cells. Scale bar = 20 μm. (E) Co-staining of SOX2 and the HA tag in iC9 in the S7 population derived from H1 and H1-iC9 cells. Cell nuclei were counterstained with DAPI. Scale bar = 10 μm. (F) Semi-quantitative RT-PCR analysis of NANOG, OCT4, and SOX2 transcripts in undifferentiated (S0) and the Stage 7 (S7) populations derived from H1 and H1-iC9 cells. (G) Representative immunofluorescence staining of SOX2 and FOXA2 in the H1-iC9-derived S7 population. Scale bar = 20 μm. (H) Western blot analysis of BCL2 expression in S0 and S7 populations derived from H1-iC9 cells. (I) Selective eradication of undifferentiated H1-iC9 cells spiked into H1-iC9-derived S7 population. Undifferentiated H1-iC9 cells spiked into H1-iC9-derived S7 population were treated with 10 nM AP1903 overnight. The resulting cell mixture was stained for OCT4 and analyzed by flow cytometry.

Similar articles

Cited by

References

    1. Balboa D., Weltner J., Novik Y., Eurola S., Wartiovaara K., Otonkoski T. Generation of an OCT4 reporter human induced pluripotent stem cell line using CRISPR/SpCas9. Stem Cell Res. 2017;23:105–108. - PubMed
    1. Boer B., Kopp J., Mallanna S., Desler M., Chakravarthy H., Wilder P.J., Bernadt C., Rizzino A. Elevating the levels of Sox2 in embryonal carcinoma cells and embryonic stem cells inhibits the expression of Sox2:Oct-3/4 target genes. Nucleic Acids Res. 2007;35:1773–1786. - PMC - PubMed
    1. Bokhoven M., Stephen S.L., Knight S., Gevers E.F., Robinson I.C., Takeuchi Y., Collins M.K. Insertional gene activation by lentiviral and gammaretroviral vectors. J. Virol. 2009;83:283–294. - PMC - PubMed
    1. Bonini C., Ferrari G., Verzeletti S., Servida P., Zappone E., Ruggieri L., Ponzoni M., Rossini S., Mavilio F., Traversari C. HSV-TK gene transfer into donor lymphocytes for control of allogeneic graft-versus-leukemia. Science. 1997;276:1719–1724. - PubMed
    1. Caserta T.M., Smith A.N., Gultice A.D., Reedy M.A., Brown T.L. Q-VD-OPh, a broad spectrum caspase inhibitor with potent antiapoptotic properties. Apoptosis. 2003;8:345–352. - PubMed