. 2020:25:102112.
doi: 10.1016/j.nicl.2019.102112. Epub 2019 Dec 2.

Disentangling brain functional network remodeling in corticobasal syndrome - A multimodal MRI study

Affiliations

Disentangling brain functional network remodeling in corticobasal syndrome - A multimodal MRI study

Tommaso Ballarini et al. Neuroimage Clin. 2020.

Abstract

Objective: The clinical diagnosis of corticobasal syndrome (CBS) represents a challenge for physicians and reliable diagnostic imaging biomarkers would support the diagnostic work-up. We aimed to investigate the neural signatures of CBS using multimodal T1-weighted and resting-state functional magnetic resonance imaging (MRI).

Methods: Nineteen patients with CBS (age 67.0 ± 6.0 years; mean±SD) and 19 matched controls (66.5 ± 6.0) were enrolled from the German Frontotemporal Lobar Degeneration Consortium. Changes in functional connectivity and structure were respectively assessed with eigenvector centrality mapping complemented by seed-based analysis and with voxel-based morphometry. In addition to mass-univariate statistics, multivariate support vector machine (SVM) classification tested the potential of multimodal MRI to differentiate patients and controls. External validity of SVM was assessed on independent CBS data from the 4RTNI database.

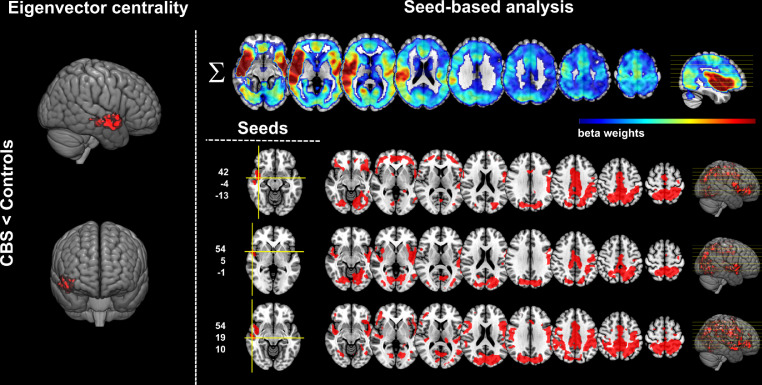
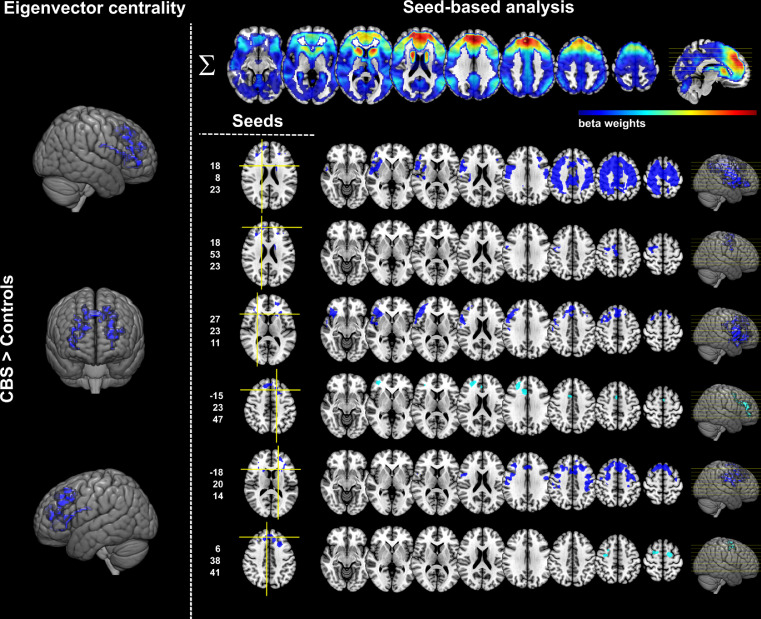
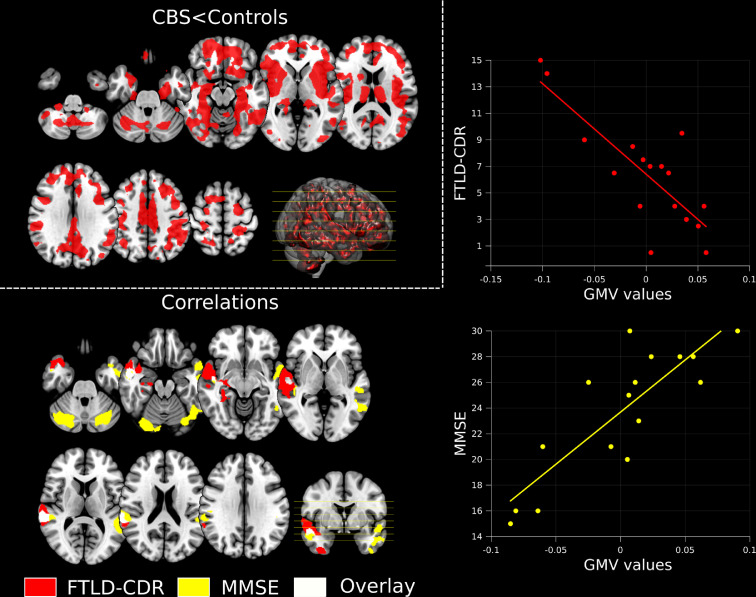
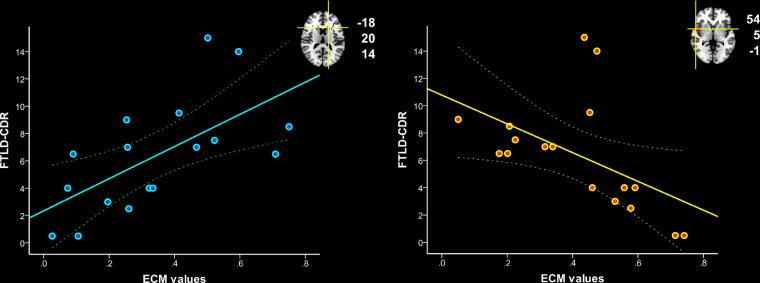
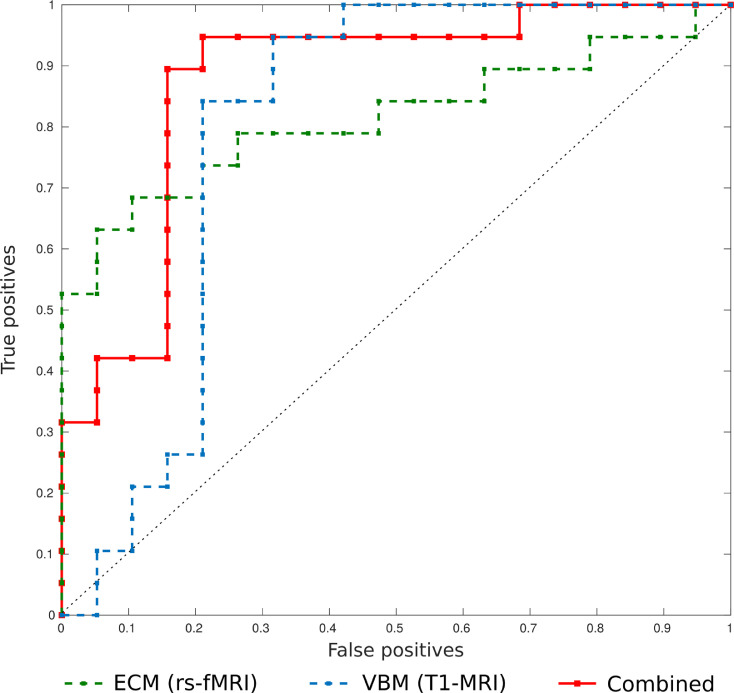
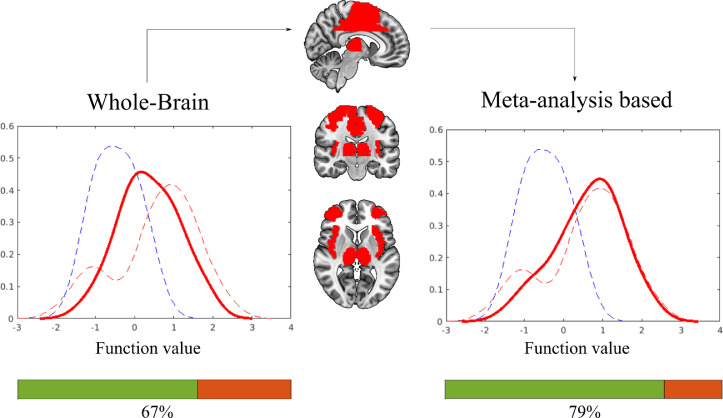
Results: A decrease in brain interconnectedness was observed in the right central operculum, middle temporal gyrus and posterior insula, while widespread connectivity increases were found in the anterior cingulum, medial superior-frontal gyrus and in the bilateral caudate nuclei. Severe and diffuse gray matter volume reduction, especially in the bilateral insula, putamen and thalamus, characterized CBS. SVM classification revealed that both connectivity (area under the curve 0.81) and structural abnormalities (0.80) distinguished CBS from controls, while their combination led to statistically non-significant improvement in discrimination power, questioning the additional value of functional connectivity over atrophy. SVM analyses based on structural MRI generalized moderately well to new data, which was decisively improved when guided by meta-analytically derived disease-specific regions-of-interest.

Conclusions: Our data-driven results show impairment of functional connectivity and brain structure in CBS and explore their potential as imaging biomarkers.

Keywords: Corticobasal syndrome; Imaging biomarkers; Magnetic resonance imaging; Resting-state functional connectivity; Support vector machine; Voxel-based morphometry.


Conflict of interest statement

Declaration of Competing Interest The authors report no competing interests.

Figures

Fig. 1
Fig. 1
Temporoparietal and insular connectivity decreases in CBS compared to controls. On the left, decreases in eigenvector centrality in patients with corticobasal syndrome compared to controls. On the right, results of the seed-based analysis showing selective connectivity decreases in patients compared to controls. MNI coordinates for all the individual seeds from the CBSp<0.05 FWE corrected at cluster level. Axial images are displayed in radiological convention: left brain on the right of image. Abbreviations: CBS corticobasal syndrome. (For interpretation of the references to color in this figure legend, the reader is referred to the web version of this article.)
Fig. 2
Fig. 2
Frontal and caudate connectivity increases in CBS compared to controls. On the left, frontal and caudate increases in eigenvector centrality in patients with corticobasal syndrome compared to controls. On the right, results of the seed-based analysis showing selective connectivity increases in patients compared to controls. MNI coordinates for all the individual seeds from the CBS>Controls group comparison are reported (x,y,z from top to bottom). The upper row shows the most consistent regions emerging from the combination of SPM beta-weights maps from different seeds. Results are shown at p<0.05 FWE corrected at cluster level, except the light blue clusters that did not survive the correction for multiple comparisons. Axial images are displayed in radiological convention: left brain on the right of image. Abbreviations: CBS corticobasal syndrome; MNI Montreal Neurological Institute. (For interpretation of the references to color in this figure legend, the reader is referred to the web version of this article.)
Fig. 3
Fig. 3
Gray matter volume reductions in CBS compared to controls and correlation with disease severity. Top left quadrant: voxel-based morphometry results showing in red significant areas of structural impairment in CBS patients compared to controls. In addition, the figure displays whole-brain correlations between gray matter volume in the CBS group and standardized measures for disease severity, i.e. FTLD-CDR (red) or MMSE (yellow). The scatterplots display the correlation between test measures and gray matter volume values in the peaks of the significant clusters. The more severe the disease, the less gray matter volume is. Images are displayed in radiological convention: left brain on the right of the image. All results are shown at p<0.05 FWE corrected at cluster level. Abbreviations: CBS corticobasal syndrome;FTLD-CDR frontotemporal lobar degeneration – clinical dementia rating scale; GMV gray matter volume; MMSE mini-mental state examination. (For interpretation of the references to color in this figure legend, the reader is referred to the web version of this article.)
Fig. 4
Fig. 4
Correlations between eigenvector centrality changes in CBS and disease severity. Positive and negative Spearman's correlations between FTLD-CDR, as proxy for disease severity, and eigenvector centrality in the significant clusters from the ECM CBS>controls comparison. The more severe the disease, the lower the interconnectedness in the right temporal/insular cortex, and the higher the interconnectedness in left caudate nucleus, suggesting proportional connectivity changes with disease severity and, potentially, brain compensation. MNI coordinates for the clusters are reported on the side of each scatterplot. Dotted lines represent 95% confidence intervals. Abbreviations: CBS corticobasal syndrome; ECM eigenvector centrality mapping; FTLD-CDR frontotemporal lobar degeneration – clinical dementia rating scale.
Fig. 5
Fig. 5
Results of support vector machine classification based on MRI imaging markers. Receiver operating characteristic (ROC) curves for differentiating patients with corticobasal syndrome and healthy controls based on MRI data. The areas under the curve (AUC) for voxel-based morphometry, eigenvector centrality mapping and their combination are, respectively, 0.80, 0.81 and 0.87. Abbreviations: ECM eigenvector centrality mapping; rs-fMRI resting state-functional magnetic resonance imaging; SVM support vector machine; VBM voxel-based morphometry. (For interpretation of the references to color in this figure legend, the reader is referred to the web version of this article.)
Fig. 6
Fig. 6
External validation of SVM model based on T1-MRI. Histogram plots display the function value distributions derived from the SVM based on T1-MRI data. Dashed lines represent function values for controls (blue) and patients (red) based on whole-brain SVM analysis. The continuous red line represents the distribution of function values for the new independent cohort of 39 CBS patients. The use of meta-analytically derived regions of interests leads to improved generalization of the SVM classifier to new data. Color bars show the proportion of correctly classified CBS patients from the new cohort for both whole brain and meta-analysis guided models. (For interpretation of the references to color in this figure legend, the reader is referred to the web version of this article.)

References

    1. Albrecht F., Bisenius S., Schaack R.M., Neumann J., Schroeter M.L. Disentangling the neural correlates of corticobasal syndrome and corticobasal degeneration with systematic and quantitative ALE meta-analyses. NPJ Parkinson's Dis. 2017;3:12. - PMC - PubMed
    1. Albrecht F., Mueller K., Ballarini T., Lampe L., Diehl-Schmid J., Fassbender K., Fliessbach K., Jahn H., Jech R., Kassubek J. Unraveling corticobasal syndrome and alien limb syndrome with structural brain imaging. Cortex. 2019;117:33–40. - PubMed
    1. Armstrong M.J., Litvan I., Lang A.E., Bak T.H., Bhatia K.P., Borroni B., Boxer A.L., Dickson D.W., Grossman M., Hallett M. Criteria for the diagnosis of corticobasal degeneration. Neurology. 2013;80:496–503. - PMC - PubMed
    1. Ashburner J., Friston K.J. Voxel-based morphometry–the methods. Neuroimage. 2000;11:805–821. - PubMed
    1. Ashburner J., Friston K.J. Unified segmentation. Neuroimage. 2005;26:839–851. - PubMed

Publication types

MeSH terms