. 2020 Jan 3;7(1):ENEURO.0222-18.2019.
doi: 10.1523/ENEURO.0222-18.2019. Print 2020 Jan/Feb.

Activation of Distinct Channelrhodopsin Variants Engages Different Patterns of Network Activity

Affiliations

Activation of Distinct Channelrhodopsin Variants Engages Different Patterns of Network Activity

Na Young Jun et al. eNeuro. .

Abstract

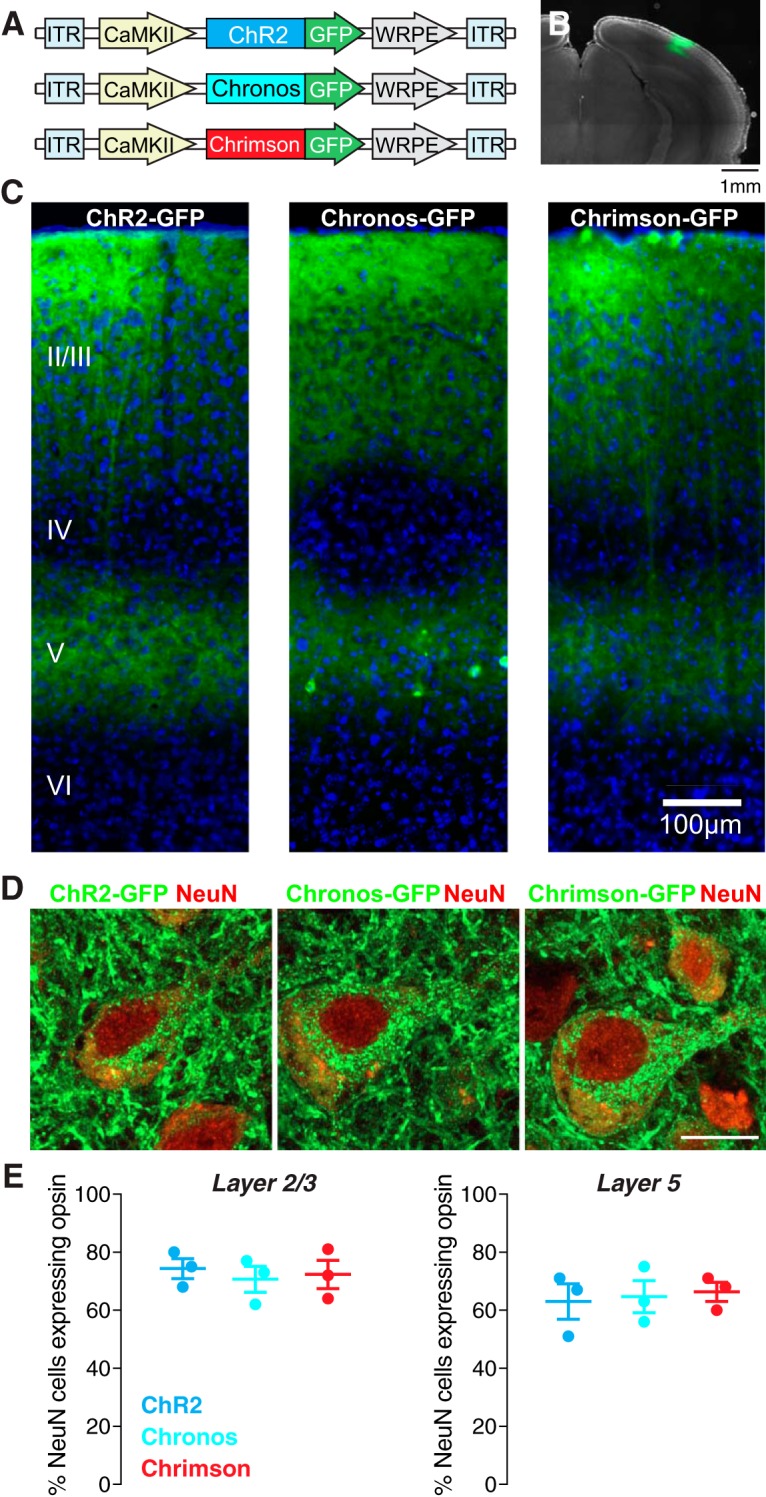
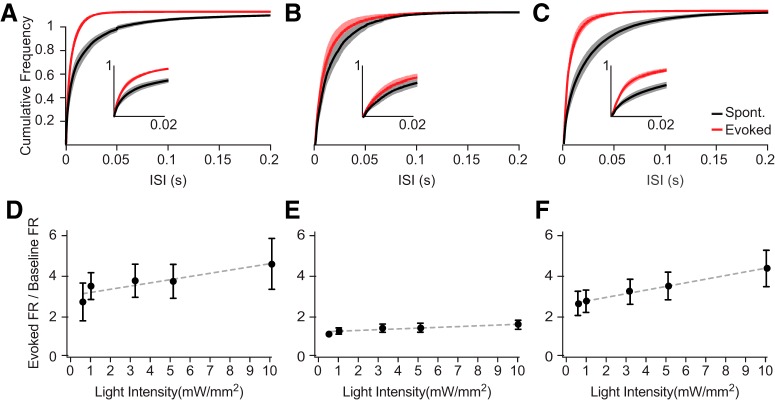
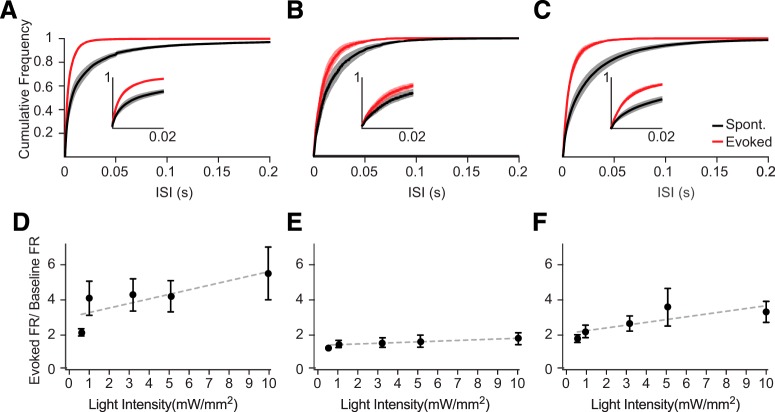
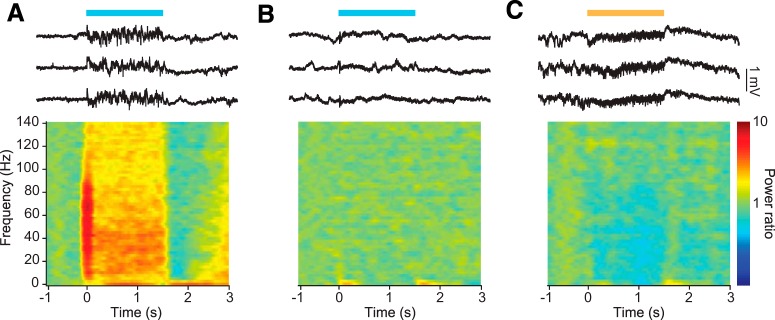
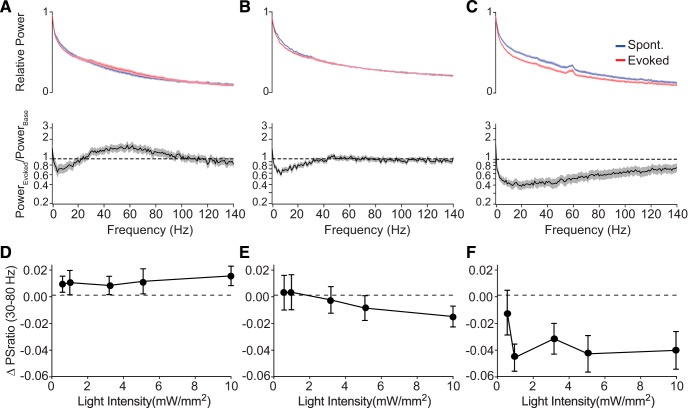
Several recently developed Channelrhodopsin (ChR) variants are characterized by rapid kinetics and reduced desensitization in comparison to the widely used ChR2. However, little is known about how varying opsin properties may regulate their interaction with local network dynamics. We compared evoked cortical activity in mice expressing three ChR variants with distinct temporal profiles under the CamKII promoter: Chronos, Chrimson, and ChR2. We assessed overall neural activation by measuring the amplitude and temporal progression of evoked spiking. Using γ-range (30-80 Hz) local field potential (LFP) power as an assay for local network engagement, we examined the recruitment of cortical network activity by each tool. All variants caused light-evoked increases in firing in vivo, but each demonstrated different temporal patterning of evoked activity. In addition, the three ChRs had distinct effects on cortical γ-band activity. Our findings suggest the properties of optogenetic tools can substantially affect their efficacy in vivo, as well their engagement of circuit resonance.

Keywords: Channelrhodopsin; Chrimson; Chronos; cortex; optogenetics; γ oscillations.


Figures

Figure 1.
Figure 1.
Expression of three ChR variants in excitatory neurons of the mouse visual cortex. A, AAVs carrying three opsins were injected into primary visual cortex of wild-type mice; ITR, inverted terminal repeat; WRPE, woodchunk hepatitis B virus post-transcriptional element. B, Spread of viral infection in the cortex. Example image showing GFP expression (green) around the area of a cortical injection of AAV5 carrying the Chronos construct. Magnification: 4×. C, ChR2-GFP, Chronos-GFP, and Chrimson-GFP were robustly expressed in excitatory neurons in cortical layers 2, 3, and 5, as confirmed by DAPI staining (blue). Magnification: 10×. D, Example confocal images showing expression of the three ChR variants (green) in layer 5 pyramidal neurons stained for the neuronal marker NeuN (red). Scale bar: 10 μm. Magnification: 64×. E, Quantification of expression in layers 2/3 (left) and 5 (right) for each opsin.
Figure 2.
Figure 2.
Different ChRs evoke cortical activity with distinct temporal profiles in vivo. A, Raster plots (upper) and histograms (lower) of example MU spike activity during stimulation of excitatory pyramidal neurons with ChR2. The 1.5-s-long interval of light stimulation (10 mW/mm2) is indicated as shaded box. An asterisk indicates the peak firing evoked by the light pulse. B, Same as in A, for Chronos. C, Same as in A, for Chrimson. D, Average PSTH for all recorded sites in ChR2-expressing mice. Red symbols and lines indicate the mean peak time and SEM of the peak time, respectively. Inset shows the initial period if evoked firing in the first 600 ms of light stimulation. E, Same as in D, for Chronos. F, Same as in D, for Chrimson.
Figure 3.
Figure 3.
Amplitude and frequency distribution of evoked spike response varies with optogenetic tool. A, ISIs of spontaneous (black) and evoked (red) MU activity during optogenetic stimulation (10 mW/mm2) in ChR2-expressing cortex. Inset shows an enlarged plot of the initial 200 ms of the evoked spike response. B, Same as in A, for Chronos. C, Same as in A, for Chrimson. Error bars denote SEM. D, Firing rates evoked by ChR2 stimulation over a range of intensities, divided by baseline spontaneous firing immediately before the light pulses. E, Same as in D, for Chronos. F, Same as in D, for Chrimson. Dashed lines indicate linear regression of the data. Error bars denote SEM.
Figure 4.
Figure 4.
Distinct changes in evoked spike patterns during the first 100 ms after light onset. A, ISIs of spontaneous (black) and evoked (red) MU activity during the initial 100 ms of optogenetic stimulation (10 mW/mm2) in ChR2-expressing cortex. B, Same as in A, for Chronos. C, Same as in A, for Chrimson. Error bars denote SEM. D, Firing rates evoked by the initial 100 ms of ChR2 stimulation over a range of intensities, divided by baseline spontaneous firing rates immediately before the light pulses. E, Same as in D, for Chronos. F, Same as in D, for Chrimson. Dashed lines indicate linear regression of the data. Error bars denote SEM.
Figure 5.
Figure 5.
Different ChRs evoke distinct cortical activity profiles in vivo. A, Example traces of cortical LFP activity in response to 1.5 s of 10 mW/mm2 light stimulation of ChR2-expressing pyramidal neurons (upper). Average changes in spectral power density at this site across stimulation trials (lower). B, Same as in A, for Chronos. C, Same as in A, for Chrimson.
Figure 6.
Figure 6.
Distinct recruitment of γ-band activity by different ChRs. A, Normalized power spectra (upper) for spontaneous (blue) and evoked (red) cortical LFP activity in response to ChR2 stimulation, averaged across all stimulation levels, and the ratio between evoked and spontaneous spectra (lower). B, Same as in A, for Chronos. C, Same as in A, for Chrimson. Shaded areas denote ± SEM. D, Change in the relative power in the γ band (30–80 Hz) in response to varying light intensities in cortex expressing ChR2. E, Same as in D, for Chronos. F, Same as in D, for Chrimson. Error bars denote SEM.

References

    1. Adesnik H, Scanziani M (2010) Lateral competition for cortical space by layer-specific horizontal circuits. Nature 464:1155–1160. 10.1038/nature08935 - DOI - PMC - PubMed
    1. Agetsuma M, Hamm JP, Tao K, Fujisawa S, Yuste R (2017) Parvalbumin-positive interneurons regulate neuronal ensembles in visual cortex. Cereb Cortex 28:1831–1845. - PMC - PubMed
    1. Bamann C, Kirsch T, Nagel G, Bamberg E (2008) Spectral characteristics of the photocycle of channelrhodopsin-2 and its implication for channel function. J Mol Biol 375:686–694. 10.1016/j.jmb.2007.10.072 - DOI - PubMed
    1. Bortone DS, Olsen SR, Scanziani M (2014) Translaminar inhibitory cells recruited by layer 6 corticothalamic neurons suppress visual cortex. Neuron 82:474–485. 10.1016/j.neuron.2014.02.021 - DOI - PMC - PubMed
    1. Boyden ES, Zhang F, Bamberg E, Nagel G, Deisseroth K (2005) Millisecond-timescale, genetically targeted optical control of neural activity. Nat Neurosci 8:1263–1268. 10.1038/nn1525 - DOI - PubMed

Publication types

Substances

LinkOut - more resources