. 2019 Dec 26;116(52):26653-26661.
doi: 10.1073/pnas.1907702116. Epub 2019 Dec 10.

Toward a metabolic theory of life history

Affiliations

Toward a metabolic theory of life history

Joseph Robert Burger et al. Proc Natl Acad Sci U S A. .

Abstract

The life histories of animals reflect the allocation of metabolic energy to traits that determine fitness and the pace of living. Here, we extend metabolic theories to address how demography and mass-energy balance constrain allocation of biomass to survival, growth, and reproduction over a life cycle of one generation. We first present data for diverse kinds of animals showing empirical patterns of variation in life-history traits. These patterns are predicted by theory that highlights the effects of 2 fundamental biophysical constraints: demography on number and mortality of offspring; and mass-energy balance on allocation of energy to growth and reproduction. These constraints impose 2 fundamental trade-offs on allocation of assimilated biomass energy to production: between number and size of offspring, and between parental investment and offspring growth. Evolution has generated enormous diversity of body sizes, morphologies, physiologies, ecologies, and life histories across the millions of animal, plant, and microbe species, yet simple rules specified by general equations highlight the underlying unity of life.

Keywords: biodiversity; biophysical constraints; demography; metabolic ecology; unified theories.


Conflict of interest statement

The authors declare no competing interest.

Figures

Fig. 1.
Fig. 1.
Plot on logarithmic axes of number of offspring (NO) as a function of relative offspring size, μ=mOmA, for 36 animal species. The regression fits a power-law scaling relation, NO = 0.24μ−0.83 (solid black line; R2 = 0.91). The 95% CI (−0.92, −0.74) of the slope does not contain the −1 predicted for a simple linear trade-off (dashed gray line). More importantly, the relation is curvilinear on logarithmic axes, as indicated by statistical LOESS (Locally Estimated Scatterplot Smoothing) fit to the data (solid blue line), indicating a deviation from power-law scaling.
Fig. 2.
Fig. 2.
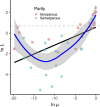
Plot on logarithmic axes of lifetime reproductive investment (L=NOmOmA=NOμ) as a function of relative offspring size, μ=mOmA, for 36 animal species. The fitted regression gives a power-law scaling relation, L = 0.55μ0.17 (solid black line; R2 = 0.30) with the 95% CIs (0.08, 0.26), so the slope is significantly different from the 0 predicted for a simple linear trade-off (dashed gray line), and lifetime reproductive effort is far from constant (it varies about 3,000-fold: from −6 to 2 on the natural log scale). More importantly, the relationship is curvilinear on logarithmic axes, as indicated by statistical LOESS fit to the data (solid blue line), consistent with Fig. 1 and indicating deviation from power-law scaling.
Fig. 3.
Fig. 3.
Exponential decay of mortality rate as a function of age, x, obtained by fitting Eq. 5 to data for painted turtle (Chrysemys picta) (A) and Humboldt squid (Dosidicus gigas) (B). Data are from Halley et al. (22).
Fig. 4.
Fig. 4.
The model accurately predicts the curvilinear shape of the trade-off between number of offspring, No, and relative offspring size, μ=mOmA. The equation ln[NO] = ln[2] + (AJ) + −1/41/4 with the 2 fitted parameters A = 6.03 ± 0.5 and J = 0.11 ± 0.01 (red curve) accounts for 92% of the variation. Icons are not drawn to scale and are not included for all species.
Fig. 5.
Fig. 5.
The model predicts the curvilinear form of the relationship between lifetime reproductive investment, L, and relative offspring size, μ = mO/mA. The equation ln[L] = ln[μ] + (AJ) + (−1/41/4) with fitted parameters A = 6.03 ± 0.5 and J = 0.11 ± 0.01 (red curve) accounts for 36% of the empirical variation. This curvilinear relationship is consistent with the relationship between number of offspring and μ shown in Figs. 2 and 4. It is not consistent with previous theory which predicts that lifetime reproductive effort is constant across species. Icons are not drawn to scale and are not included for all species.
Fig. 6.
Fig. 6.
(A) Mass–energy balance for an individual animal over one generation, so lifetime individual production, P, is assimilation minus respiration and is divided between growth and parental investment. (B) Mass–energy balance for the cohort of offspring produced by a female parent in one generation, so lifetime cohort production, C, includes the biomass accumulated by growth of all offspring when they died, including the 2 that replaced their parents.
Fig. 7.
Fig. 7.
Mass-specific lifetime production of a single individual and of the cohort of all offspring of a parent, both as a function of relative offspring size, μ = mO/mA. (A) Empirical and theoretically predicted patterns of mass-specific lifetime production of an individual, P = (1 − μ) + L, which is the sum of individual growth plus parental investment. The data points are the empirical values for the 36 animal species, and the black curve is the theoretically predicted relationship based on the prediction of L (Eq. 10 and Fig. 5). (B) Lifetime biomass production, C, and its 2 components growth, W, and parental investment, L, for the cohort of all offspring produced by a parent. Note the linear scales of the y axes, so the variation in P and especially in C, W, and L is only a fewfold.

References

    1. Boltzmann L., “The second law of thermodynamics” in Populare Schriften. Essay No. 3 (Address to Imperial Academy of Science, 1886); reprinted in English in Theoretical Physics and Philosophical Problems (D. Riedel, Dordrecht, Netherlands, 1905).
    1. Lotka A. J., Elements of physical biology. Sci. Progress Twentieth Century (1919-1933) 21, 341–343 (1926).
    1. Smith C. C., Fretwell S. D., The optimal balance between size and number of offspring. Am. Nat. 108, 499–506 (1974).
    1. Charnov E. L., Evolution of life history variation among female mammals. Proc. Natl. Acad. Sci. U.S.A. 88, 1134–1137 (1991). - PMC - PubMed
    1. Charnov E. L., Life History Invariants: Some Explorations of Symmetry in Evolutionary Ecology (Oxford University Press, Oxford, UK, 1993).

LinkOut - more resources