. 2019 Dec 10;9(1):18696.
doi: 10.1038/s41598-019-55177-9.

Transcriptional correlates of the pathological phenotype in a Huntington's disease mouse model

Affiliations

Transcriptional correlates of the pathological phenotype in a Huntington's disease mouse model

Andrea Gallardo-Orihuela et al. Sci Rep. .

Abstract

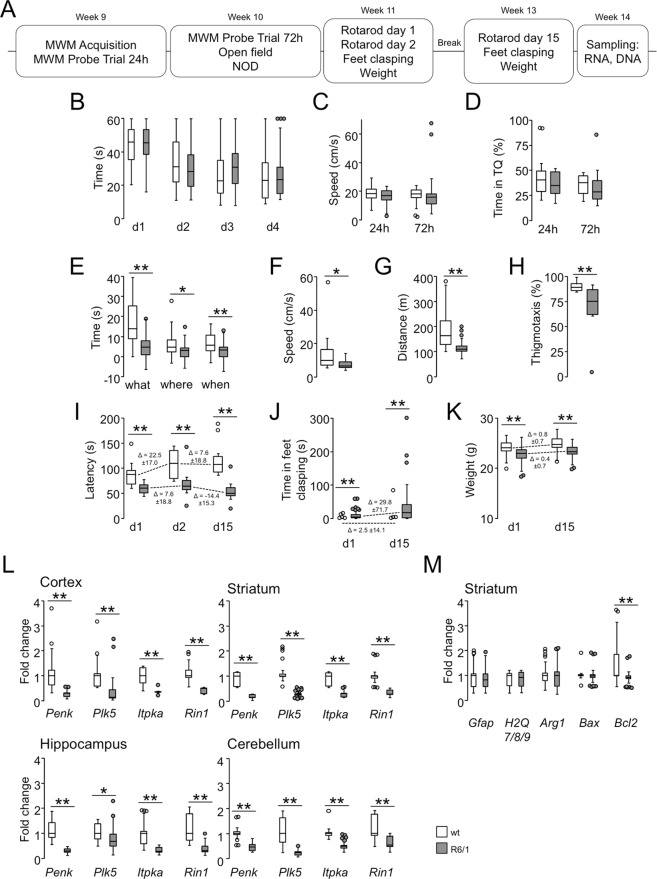
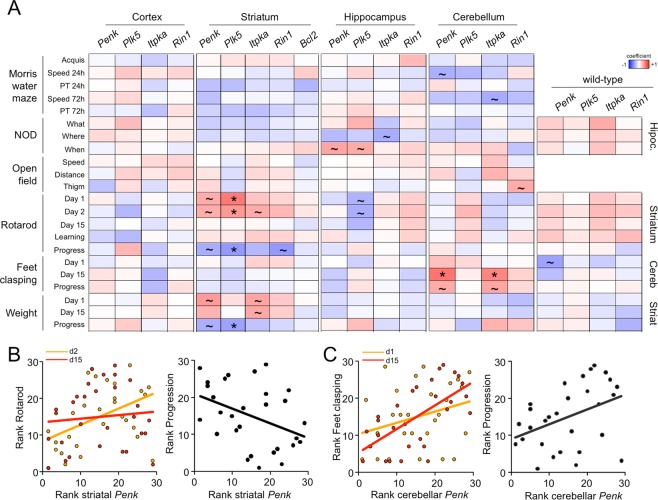
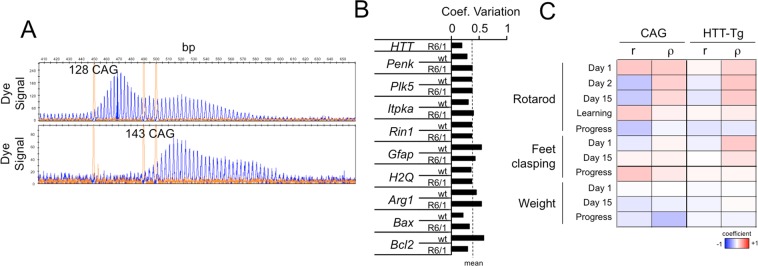
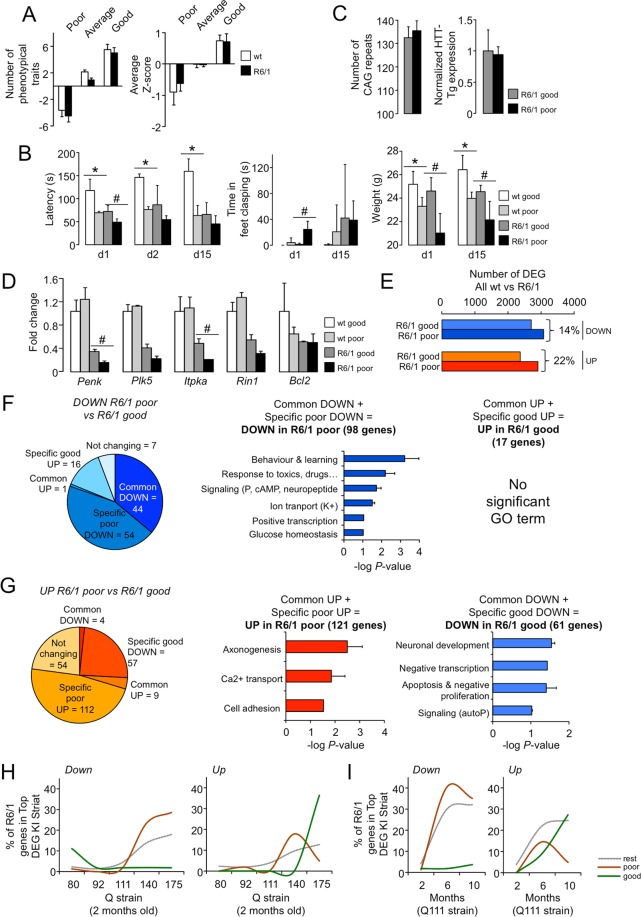
Huntington disease (HD) is a fatal neurodegenerative disorder without a cure that is caused by an aberrant expansion of CAG repeats in exon 1 of the huntingtin (HTT) gene. Although a negative correlation between the number of CAG repeats and the age of disease onset is established, additional factors may contribute to the high heterogeneity of the complex manifestation of symptoms among patients. This variability is also observed in mouse models, even under controlled genetic and environmental conditions. To better understand this phenomenon, we analysed the R6/1 strain in search of potential correlates between pathological motor/cognitive phenotypical traits and transcriptional alterations. HD-related genes (e.g., Penk, Plk5, Itpka), despite being downregulated across the examined brain areas (the prefrontal cortex, striatum, hippocampus and cerebellum), exhibited tissue-specific correlations with particular phenotypical traits that were attributable to the contribution of the brain region to that trait (e.g., striatum and rotarod performance, cerebellum and feet clasping). Focusing on the striatum, we determined that the transcriptional dysregulation associated with HD was partially exacerbated in mice that showed poor overall phenotypical scores, especially in genes with relevant roles in striatal functioning (e.g., Pde10a, Drd1, Drd2, Ppp1r1b). However, we also observed transcripts associated with relatively better outcomes, such as Nfya (CCAAT-binding transcription factor NF-Y subunit A) plus others related to neuronal development, apoptosis and differentiation. In this study, we demonstrated that altered brain transcription can be related to the manifestation of HD-like symptoms in mouse models and that this can be extrapolated to the highly heterogeneous population of HD patients.


Conflict of interest statement

The authors declare no competing interests.

Figures

Figure 1
Figure 1
Behavioural and gene expression analysis of early symptomatic R6/1 mice. (A) Timeline of the behavioural test battery and the sampling of R6/1 mice and their wild-type littermates. MWM, Morris water maze; NOD, novel object discrimination. B-D, The Morris water maze task did not reveal differences between genotypes in performance in the acquisition phase (B) or in the swimming speed (C) or time spent in the target quadrant (TQ) in the probe trials (D). (E) R6/1 mice exhibited significant impairments in the three components (“what”, “where” and “when”) of the NOD task. (FH) Spontaneous activity was measured in the open field test, and differences in the speed (F), distance travelled (G) and the time spent in the border area (H) were identified. (I) R6/1 animals exhibited significant impairments in the accelerating rotarod task. Motor learning (Δ = day 2 − day 1) was also affected. (J) R6/1 mice exhibited obvious feet clasping. (K) Mutant mice were unable to gain weight, unlike their wild-type littermates. I-K, Progression rates (Δ = week 13 − week 11) for accelerating rotarod performance (I), feet clasping (J) and weight gain (K). (L) Genes of a consistent HD transcriptional signature (Penk (proenkephalin), Plk5 (polo-like kinase 5), Itpka (inositol trisphosphate 3-kinase A), and Rin1 (Ras and Rab interactor 1)) were downregulated in the prefrontal cortex, striatum, hippocampus and cerebellum of R6/1 mice, as determined by RT-qPCR assays. (M) Except for Bcl2 (B-cell lymphoma 2), the degeneration-related genes Gfap (glial fibrillary acidic protein), H2Q7/8/9 (histocompatibility 2, Q region locus 7/8/9), Arg1 (arginase 1), and Bax (Bcl-2-associated X) were not affected. In all the panels: n wt = 24, n R6/1 = 29; *P < 0.05; **P < 0.005 between genotypes; Mann Whitney U-test. The data are expressed as whisker-and-box plots.
Figure 2
Figure 2
Transcriptional and behavioural variabilities in R6/1 mice are mildly correlated in a tissue-dependent manner. (A) Summary of the Spearman coefficient values between the analysed phenotypical traits and gene expression levels. Significant correlations (~unadjusted P < 0.05; *adjusted P < 0.1, linear regression t-test) were observed between striatal gene expression and rotarod and weight, between hippocampal gene expression and performance on the NOD task and between cerebellar gene expression and feet clasping in R6/1 mice (n = 29). These correlations were not observed in the wild-type animals (n = 24). PT, probe trial; Thigm, thigmotaxis. (B) The correlation between striatal Penk transcript variations and performance on the accelerating rotarod was reduced at the age of 13 weeks. Left panel, the latency to fall off the rod and Penk expression in mutant mice ranked from the highest to the lowest values for each time point; week 11 (d2) and week 13 (d15). Right panel, the association between progression rate (week 13 − week 11) and the striatal Penk expression level. (C) The correlation between cerebellar Penk transcript variations and feet clasping was increased at the age of 13 weeks. The panels are displayed as in B.
Figure 3
Figure 3
Behavioural variability in R6/1 mice is not attributable to the number of CAG repeats or transgene expression in the striatum. (A) Representative electrophoregrams of DNA fragment analysis of a mutant mouse from the first cohort (upper panel) and last cohort (lower panel) showing an increase in the number of CAG repeats. The sharp yellow peaks are the molecular weight standards. (B) Compared to other genes, the expression of the R6/1 transgene in the striatum was relatively stable across the mutant mice. Coeff.Variation = coefficient of variation (s.d./mean). (C) Summary of the Pearson (r) and Spearman (ρ) coefficient values indicating no correlation between phenotypical traits and the number of CAG repeats/transgene expression (n R6/1 = 29).
Figure 4
Figure 4
HD transcriptional dysregulation is exacerbated in a worse pathological phenotype. (A) Summary of Z-score calculations for classifying the mice according to their phenotype during weeks 11 and 13: “poor”, “good” and “average”. Left panel, the number of phenotypical traits with positive or negative Z-scores for the three categories of mice. Right panel, Z-score values represented as the mean ± s.e.m. (B) Accelerating rotarod performance (left), feet clasping (middle) and weights (right) across the four groups of animals according to genotype (wt, R6/1) and phenotype (good, poor); n = 4 in each group. (C) No difference in the number of striatal CAG repeats or mHtt transgene expression between R6/1 “good” and “poor” animals was observed. (D) The expression of genes belonging to the HD signature across the four groups of animals. In contrast to phenotype, differences were only observed in mutant mice by RT-qPCR. *P < 0.05; **P < 0.005 between “good” and “poor” wild-type mice; #P < 0.05; ##<0.005 between “good” and “poor” R6/1 mice; Mann Whitney U-test. The data are expressed as the mean ± s.d. E, The number of differentially expressed genes (DEGs) related to the wild-type striatum (both downregulated and upregulated) was higher for the R6/1 “poor” striatum compared to the R6/1 “good” striatum. (F,G) Pair-wise comparisons between R6/1 “poor” and “good” striatal transcriptomes identified four types of genes based on the direction of change (downregulated or upregulated) and the group of mutants in which they were more altered (“good” or “poor”). Each set of genes is represented by the results of GO enrichment analysis (P < 0.1, DAVID), except for the upregulated genes in the R6/1 “good” striatum for which no significance was retrieved. The data are expressed as the mean ± s.e.m of log P values across the terms in each category. Common, common DEGs to pair-wise comparisons between wild-type and R6/1 “poor” and between wild-type and R6/1 “good”; Specific, DEGs only appearing in one comparison; Not changing, DEGs between R6/1 “poor” and “good” but not altered between wild-type and R6/1. (H,I) The presence (expressed as %) of the four sets of genes identified in (F,G) among the top DEGs between KI HD mice with expanded CAG repeats and with non-pathological range number of repeats (Q20) at the indicated ages. Two additional sets of genes (genes that are dysregulated in HD but are not different between the R6/1 “poor” striatum and the R6/1 “good” striatum) were also included (“rest”). The downregulated “poor” genes and upregulated “good” genes exhibited the most progressive behaviour compared to that of the other sets, both through analysing the effect of the CAG length (H) and age (I) on phenotype worsening.

References

    1. Zuccato C, Valenza M, Cattaneo E. Molecular mechanisms and potential therapeutical targets in Huntington’s disease. Physiol Rev. 2010;90:905–981. doi: 10.1152/physrev.00041.2009. - DOI - PubMed
    1. Tabrizi SJ, et al. Predictors of phenotypic progression and disease onset in premanifest and early-stage Huntington’s disease in the TRACK-HD study: analysis of 36-month observational data. Lancet Neurol. 2013;12:637–649. doi: 10.1016/S1474-4422(13)70088-7. - DOI - PubMed
    1. Andrew SE, et al. The relationship between trinucleotide (CAG) repeat length and clinical features of Huntington’s disease. Nat Genet. 1993;4:398–403. doi: 10.1038/ng0893-398. - DOI - PubMed
    1. Persichetti F, et al. Huntington’s disease CAG trinucleotide repeats in pathologically confirmed post-mortem brains. Neurobiol Dis. 1994;1:159–166. doi: 10.1006/nbdi.1994.0019. - DOI - PubMed
    1. Shang H, Danek A, Landwehrmeyer B, Burgunder JM. Huntington’s disease: new aspects on phenotype and genotype. Parkinsonism Relat Disord. 2012;18(Suppl 1):S107–109. doi: 10.1016/S1353-8020(11)70034-7. - DOI - PubMed

Publication types

MeSH terms