. 2019 Nov 21:7:299.
doi: 10.3389/fcell.2019.00299. eCollection 2019.

Comprehensive Identification and Characterization of Human Secretome Based on Integrative Proteomic and Transcriptomic Data

Affiliations

Comprehensive Identification and Characterization of Human Secretome Based on Integrative Proteomic and Transcriptomic Data

Geng Chen et al. Front Cell Dev Biol. .

Abstract

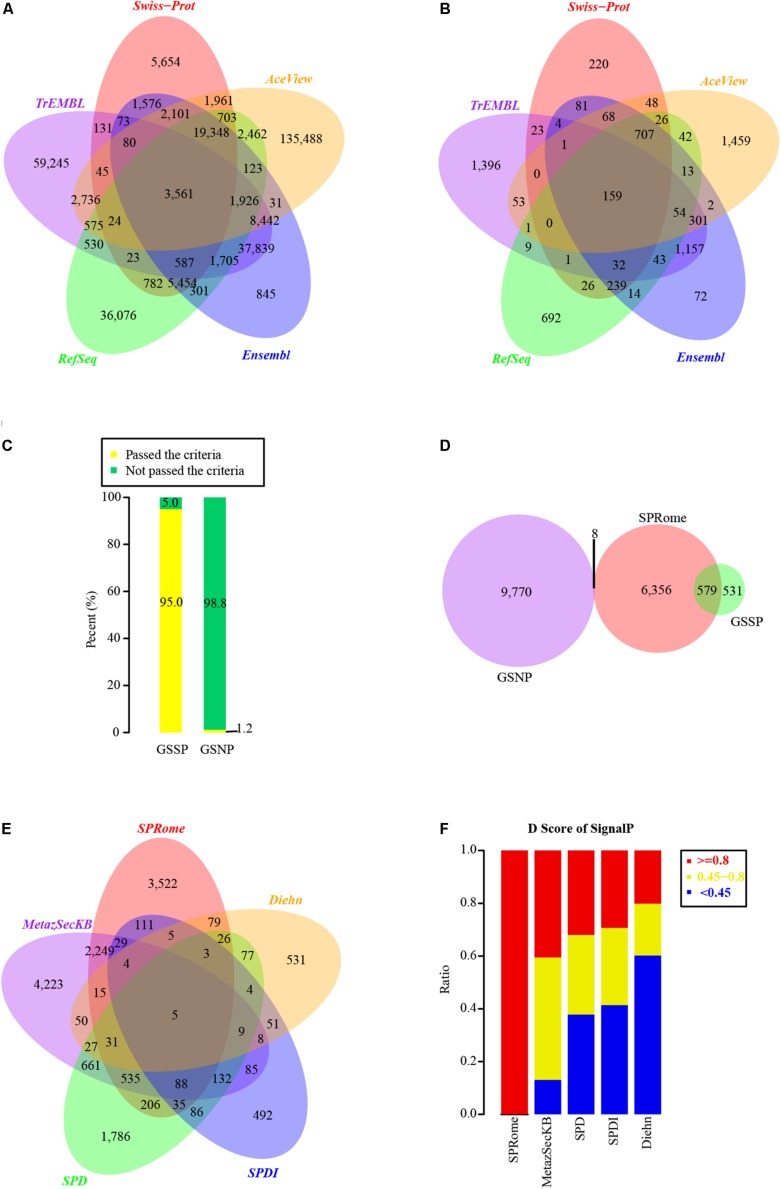
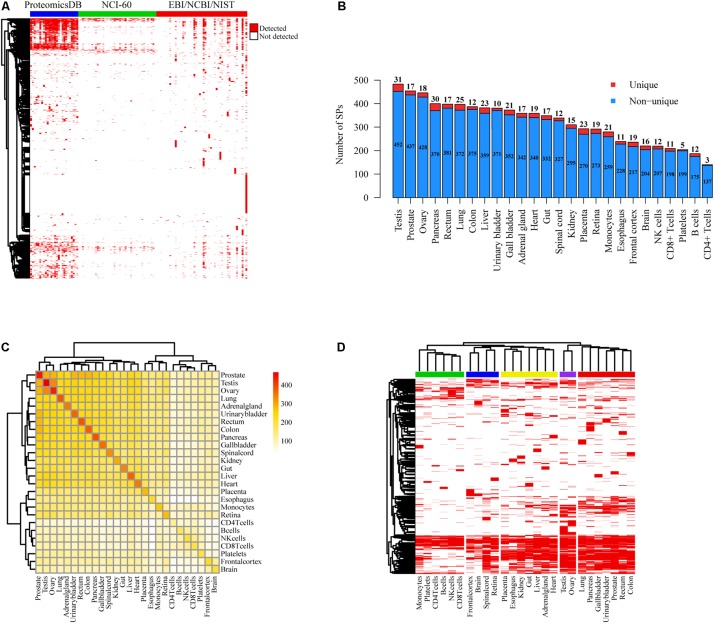
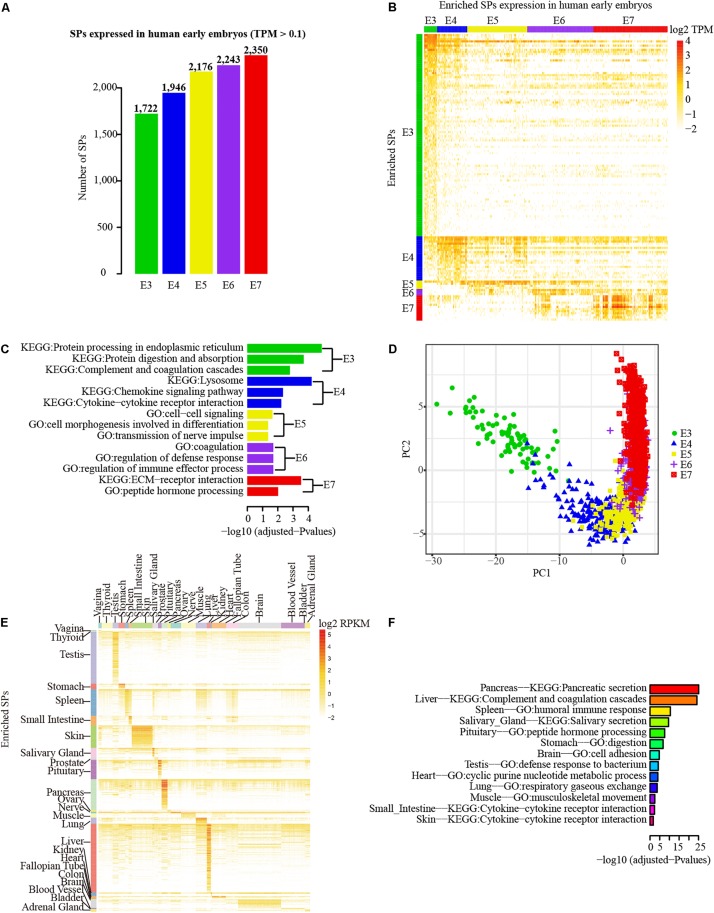
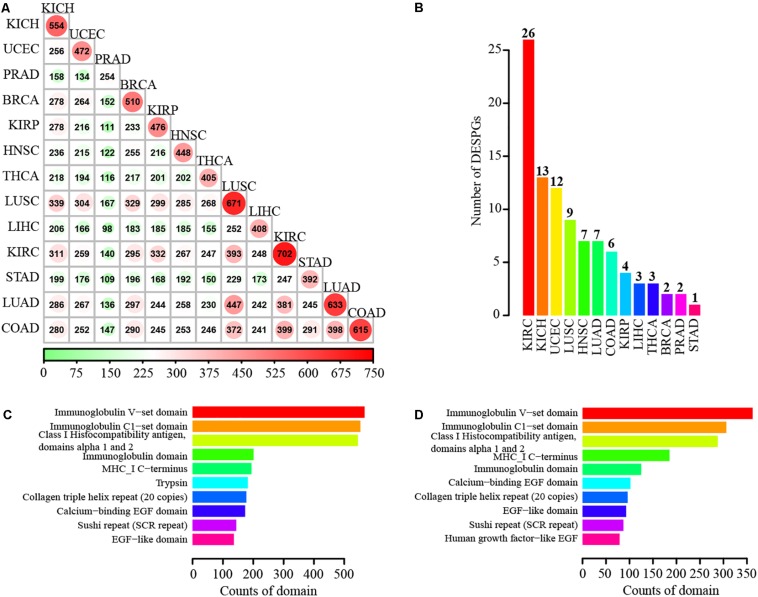
Secreted proteins (SPs) play important roles in diverse important biological processes; however, a comprehensive and high-quality list of human SPs is still lacking. Here we identified 6,943 high-confidence human SPs (3,522 of them are novel) based on 330,427 human proteins derived from databases of UniProt, Ensembl, AceView, and RefSeq. Notably, 6,267 of 6,943 (90.3%) SPs have the supporting evidences from a large amount of mass spectrometry (MS) and RNA-seq data. We found that the SPs were broadly expressed in diverse tissues as well as human body fluid, and a significant portion of them exhibited tissue-specific expression. Moreover, 14 cancer-specific SPs that their expression levels were significantly associated with the patients' survival of eight different tumors were identified, which could be potential prognostic biomarkers. Strikingly, 89.21% of 6,943 SPs (2,927 novel SPs) contain known protein domains. Those novel SPs we mainly enriched with the known domains regarding immunity, such as Immunoglobulin V-set and C1-set domain. Specifically, we constructed a user-friendly and freely accessible database, SPRomeDB (www.unimd.org/SPRomeDB), to catalog those SPs. Our comprehensive SP identification and characterization gain insights into human secretome and provide valuable resource for future researches.

Keywords: RNA-seq; human secretome; proteome; secreted proteins; transcriptome.


Figures

FIGURE 1
FIGURE 1
Identification and evaluation of SPs based on comprehensive human protein set. (A) Venn graph of human proteins used for SP identification in different databases. A total of 330,427 non-redundant proteins were integrated from Swiss-Prot, TrEMBL, RefSeq, Ensembl, and AceView databases. (B) The distribution of SPs identified in Swiss-Prot (1,635), TrEMBL (3,234), RefSeq (2,058), Ensembl (2,947), and AceView (2,934) databases. (C) The percentages of proteins passed and not passed the default SignalP cutoff (D-score >0.45) in GSSP and GSNP. (D) Comparison of our identified SPs with GSSP and GSNP. (E) Comparison of our identified SPs with other four known SP sets. (F) Distribution of SignalP D-scores in our identified SPs and other four SP sets.
FIGURE 2
FIGURE 2
Protein level evidences of SPs supported by MS data. (A) Heatmap of SP presence in different tissues and/or cell lines based on the MS data of ProteomicsDB, NCI-60 cell lines, and EBI/NCBI/NIST database. Red represents the presence of SP, whereas white represents not. (B) Number distribution of detected SPs in distinct tissues and cells of ProteomicsDB project. The counts of unique and non-unique SPs were shown respectively. (C) Heatmap of shared SPs between each two different tissues or cells of ProteomicsDB project. (D) Clustering of different tissues and cells of ProteomicsDB project based on SP presence. Red stands for the presence of SP, whereas white represents not.
FIGURE 3
FIGURE 3
Supporting evidences of SPs at protein and transcript levels. (A) Pie chart shows the number and proportion of SPs that have supporting evidence at protein level, while Venn graph shows the distribution of protein level evidences for SPs in databases of neXtProt (2,461), UniProt (1,503), and HPA (1,935), as well as the MS data (3,464 SPs). (B) Pie chart shows the number and percentage of SPs that have supporting evidence at transcript level, while Venn graph shows the distribution of transcript level evidences for SPs in Human BodyMap project (2,407) and databases of UniProt (2,928), neXtProt (1,503), HPA (3,669), and AceView (2,674). (C) Pie chart shows the number and proportion of SPs that detected in human body fluids, while Venn graph shows the number of SPs detected in plasma (1,532), urine (779), cerebrospinal fluid (654), saliva (392), and pancreatic juice (154).
FIGURE 4
FIGURE 4
Transcriptional profiles of SPs in early embryos and different tissues. (A) Number distribution of detected SPs in each embryonic stage (0.1 TPM as cutoff). (B) Principal Component Analysis (PCA) of the samples different embryonic stages based on the SPs with enriched expression in each stage. (C) The SP genes that with enriched expression in each embryonic stage. (D) Functional enrichment analysis (GO and pathway) of expression enriched SP genes in different embryo stage. Green, blue, orange, purple and red separately represent stages from E3 to E7. (E) Expression enriched SP genes in different tissues of GETx project. (F) Functional enrichment analysis (GO and pathway) of expression enriched SP genes in different tissues.
FIGURE 5
FIGURE 5
Differentially expressed SP genes in 13 different cancers and functional domain annotation of SPs. (A) Number of differentially expressed SPs shared by each two different cancers. (B) Number distribution of cancer-specific differentially expressed SPs. (C) Top 10 enriched domains of known SPs. (D) Top 10 enriched domains of novel SPs.

References

    1. Abdel-Hamid N. M., Mohafez O. M., Zakaria S., Thabet K. (2014). Hepatic somatostatin receptor 2 expression during premalignant stages of hepatocellular carcinoma. Tumour Biol. 35 2497–2502. 10.1007/s13277-013-1330-x - DOI - PubMed
    1. Adachi J., Kumar C., Zhang Y., Olsen J. V., Mann M. (2006). The human urinary proteome contains more than 1500 proteins, including a large proportion of membrane proteins. Genome Biol. 7:R80. 10.1186/gb-2006-7-9-R80 - DOI - PMC - PubMed
    1. Agranoff D., Fernandez-Reyes D., Papadopoulos M. C., Rojas S. A., Herbster M., Loosemore A., et al. (2006). Identification of diagnostic markers for tuberculosis by proteomic fingerprinting of serum. Lancet 368 1012–1021. 10.1016/S0140-6736(06)69342-2 - DOI - PMC - PubMed
    1. Aken B. L., Ayling S., Barrell D., Clarke L., Curwen V., Fairley S., et al. (2016). The Ensembl gene annotation system. Database 2016:baw093. - PMC - PubMed
    1. Bauer J. W., Baechler E. C., Petri M., Batliwalla F. M., Crawford D., Ortmann W. A., et al. (2006). Elevated serum levels of interferon-regulated chemokines are biomarkers for active human systemic lupus erythematosus. PLoS Med. 3:e491. 10.1371/journal.pmed.0030491 - DOI - PMC - PubMed

LinkOut - more resources