. 2020 Mar;14(3):571-589.
doi: 10.1002/1878-0261.12616. Epub 2020 Jan 28.

High CD206 levels in Hodgkin lymphoma-educated macrophages are linked to matrix-remodeling and lymphoma dissemination

Affiliations

High CD206 levels in Hodgkin lymphoma-educated macrophages are linked to matrix-remodeling and lymphoma dissemination

Annekatrin Arlt et al. Mol Oncol. 2020 Mar.

Abstract

Macrophages (Mφ) are abundantly present in the tumor microenvironment and may predict outcome in solid tumors and defined lymphoma subtypes. Mφ heterogeneity, the mechanisms of their recruitment, and their differentiation into lymphoma-promoting, alternatively activated M2-like phenotypes are still not fully understood. Therefore, further functional studies are required to understand biological mechanisms associated with human tumor-associated Mφ (TAM). Here, we show that the global mRNA expression and protein abundance of human Mφ differentiated in Hodgkin lymphoma (HL)-conditioned medium (CM) differ from those of Mφ educated by conditioned media from diffuse large B-cell lymphoma (DLBCL) cells or, classically, by macrophage colony-stimulating factor (M-CSF). Conditioned media from HL cells support TAM differentiation through upregulation of surface antigens such as CD40, CD163, CD206, and PD-L1. In particular, RNA and cell surface protein expression of mannose receptor 1 (MRC1)/CD206 significantly exceed the levels induced by classical M-CSF stimulation in M2-like Mφ; this is regulated by interleukin 13 to a large extent. Functionally, high CD206 enhances mannose-dependent endocytosis and uptake of type I collagen. Together with high matrix metalloprotease9 secretion, HL-TAMs appear to be active modulators of the tumor matrix. Preclinical in ovo models show that co-cultures of HL cells with monocytes or Mφ support dissemination of lymphoma cells via lymphatic vessels, while tumor size and vessel destruction are decreased in comparison with lymphoma-only tumors. Immunohistology of human HL tissues reveals a fraction of cases feature large numbers of CD206-positive cells, with high MRC1 expression being characteristic of HL-stage IV. In summary, the lymphoma-TAM interaction contributes to matrix-remodeling and lymphoma cell dissemination.

Keywords: CD206; lymphoma; macrophages; tumor microenvironment.


Conflict of interest statement

The authors declare no conflict of interest.

Figures

Figure 1
Figure 1
Factors secreted by HL cells induce distinct changes in global gene expression by Mφ. Shown is a t‐SNE plot to visualize differences in global gene expression between L428 (HL), OCI‐Ly3 (DLBCL), HBL‐1 (DLBCL), and M‐CSF‐induced Mφ.
Figure 2
Figure 2
Surface expression of selected proteins on M‐CSF or L428‐CM‐educated Mφ and monocytes. Flow cytometry analysis of surface protein expression on monocytes and Mφ differentiated with either 2.5 ng·mL−1 M‐CSF or L428‐CM. MFI was calculated by dividing the MFI of the specific antibody by isotype MFI (mean ± SD, n = 12, paired t‐test, two‐tailed; *P < 0.05, **P < 0.01 and ***P < 0.001).
Figure 3
Figure 3
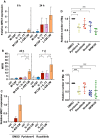
MRC1 gene expression, endocytotic activity, and type I collagen uptake by Mφ. (A) Gene expression of the MRC1 (CD206) in Mφ differentiated with either 2.5 ng·mL−1 M‐CSF (ctrl) or lymphoma‐derived CM as indicated. (B–D) Mφ were differentiated in Teflon‐coated cell culture bags with either 2.5 ng·mL−1 M‐CSF or L428‐CM for 7 days and transferred to cell culture dishes. After 3 h, nonadherent cells were washed off and adherent cells were incubated with (B/C) latex beads (5 beads/cell) for 2 h at 37 °C or on ice. Fluorescence was measured by flow cytometry. The overall percentage of phagocytic cells and their percentages as a function of the number of beads taken up were calculated by subtracting the respective percentages determined on ice from those at 37 °C (mean ± SD; n = 12). (D) Mφ were incubated with 1 mg·mL−1 10‐kDa FITC dextran for 2 h at 37 °C and on ice. For blocking, mannose was given 10 min prior to dextran. Fluorescence was measured by flow cytometry. MFI ratios (MFIR) were calculated by dividing the MFI of 37 °C samples by the MFI of corresponding samples on ice (mean ± SD; n = 12, paired one‐way ANOVA with Bonferroni’s post‐test). (E) Mφ were incubated with 5 µg·mL−1 fluorescence‐labeled gelatin OG‐488 conjugate for 30 min at 37 °C or on ice. MFIR were calculated dividing the MFI of a 37 °C sample by the MFI the corresponding sample kept on ice (mean ± SD, n = 5, paired t‐test, two‐tailed; *P < 0.05, **P < 0.01). (F) MMP‐9 levels in Mφ differentiated by M‐CSF or L428‐CM treatment were analyzed by zymography. The cell‐free cell culture supernatants were diluted 1 : 40 before applying to the gelatin gel. Experiments using three different donors are shown.
Figure 4
Figure 4
CD206/MRC1 is upregulated by IL13 and L428‐CM. (A) CD14+ PBMCs were stimulated with 2.5 ng·mL−1 M‐CSF, 10 ng·mL−1 IL‐13, or both, or with L‐428‐CM for the indicated time. Gene expression of MRC1 was analyzed by qRT–PCR, relative to GAPDH (mean ± SD, n = 6). (B) Monocytes were seeded in Teflon‐coated cell culture bags with 2.5 ng·mL−1 M‐CSF, 10 ng·mL−1 IL‐13, or both, or with L‐428‐CM mixed with an equal volume of fresh medium. Aliquots of Mφ were taken at the indicated time points and stained with anti‐CD206 antibody. MFIRs were calculated as described above (mean ± SD, n = 6; paired one‐way ANOVA with Bonferroni’s post‐test; C) CD14+ PBMCs were preincubated with DMSO or inhibitors for 1 h before 10 ng·mL−1 IL‐13 or L‐428‐CM were added. Monocytes were cultured for six additional hours. Gene expression of MRC1 was analyzed by qRT–PCR, relative to GAPDH and MRC1 expression in L428‐CM‐treated monocytes (mean ± SD, n = 6). (D/E) Mφ were differentiated in Teflon‐coated cell culture bags with either 2.5 ng·mL−1 M‐CSF (D) or L428 CM (E) for 7 days in the presence of DMSO or indicated inhibitors (1 µm), and cells were counted (mean ± SD, n = 4/6; paired one‐way ANOVA with Bonferroni’s post‐test; *P < 0.05, and ***P < 0.001).
Figure 5
Figure 5
Mφ affect lymphoma growth in the chick chorioallantoic membrane (CAM). (A/B) Tumor volumes are reduced in the presence of Mφ. L1236 and L428 lymphomas were mixed with Mφ, inoculated on the CAM, and harvested after 4 days of tumor growth. To evaluate the lymphoma outcome, tumor volumes were defined using micro‐CT. Above the graphs are representative macroscopic images (with 7.8× magnification). CAM lymphomas (A) and respective CAM‐Mφ‐lymphomas (B) are shown. PBMCs from four different donors were used (Mφ A, B, C, D). Note the absence of bleedings in lymphomas with Mφ (mean ± SD; scale bar represents 2 mm). (C) Tissue section of L428 lymphoma stained for CD30. (D) Tissue section of L428 lymphoma with Mφ stained for CD30. (E) Tissue section of L428 lymphoma with Mφ stained for CD68. (F) Tissue section of L428 lymphoma with Mφ stained for CD206. Co‐expression of both CD68 and CD206 on Mφ shows that the M2‐like phenotype is maintained. (C–F) Note some remaining Matrigel (white asterisk) in L428 lymphomas with Mφ. Both, lymphoma cells and Mφ collectively invade the CAM. However, Mφ seem to consist of two populations, one migrating with the lymphoma cells and the other remaining at the site of application. See also Fig. S6D,E. (G) Staining of cryosections of CAM lymphoma of L428 cells and (H) L428 cells with L428‐CM‐educated Mφ with anti‐Prox1 (green) and anti‐CD30 (red) to visualize lymphatic vessels and L428 HL cells. Scale bar: 160 µm. (I) Visualization of HL cells [CD30 (red)] within lymphatic vessels [Prox1 (green), white arrows] to demonstrate their lymphogenic dissemination. Scale bar: 40 µm. See also Fig. S7.
Figure 6
Figure 6
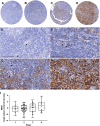
Different patterns of CD206‐positive cells in classical HL, and gene expression of MRC1 (CD206) in cHL patients of different stages. (A–D) Four examples of a TMA with a total of 16 specimens demonstrating variable staining patterns for CD206 in classical HL. (E–H) Details of figures A–D. (A, E) Very few positive cells; (B,F) small number of positive cells; (C,G) moderate number of positive cells; (D,H) high number of positive cells. Scale bar in E‐H = 100 µm. Arrows show Hodgkin and Reed–Sternberg cells, which are negative for CD206 but often in close contact with Mφ. (I) MRC1/CD206 expression data obtained by Steidl et al. were correlated with the stage of cHL patients. A significant linear trend for high CD206 expression for cHL patients with stage 4 is described (ordinary one‐way ANOVA, slope 0.3219; P = 0.0170; Steidl et al., 2010).

References

    1. Aldinucci D, Gloghini A, Pinto A, De Filippi R and Carbone A (2010) The classical Hodgkin’s lymphoma microenvironment and its role in promoting tumour growth and immune escape. J Pathol 221, 248–263. - PubMed
    1. Allen JE and Rückerl D (2017) The silent undertakers: macrophages programmed for efferocytosis. Immunity 47, 810–812. - PubMed
    1. Azad AK and Schlesinger LS (2015) Mannose receptor (CD206)‐mediated imaging in sentinel lymph node localization. Clin Transl Imaging 3, 237–245.
    1. Bhattacharjee A, Shukla M, Yakubenko VP, Mulya A, Kundu S and Cathcart MK (2013) IL‐4 and IL‐13 employ discrete signaling pathways for target gene expression in alternatively activated monocytes/macrophages. Free Radic Biol Med 54, 1–16. - PMC - PubMed
    1. Carey CD, Gusenleitner D, Lipschitz M, Roemer MGM, Stack EC, Gjini E, Hu X, Redd R, Freeman GJ, Neuberg D et al (2017) Topological analysis reveals a PD‐L1‐associated microenvironmental niche for Reed‐Sternberg cells in Hodgkin lymphoma. Blood 130, 2420–2430. - PMC - PubMed

Publication types

MeSH terms

Associated data