

Trends in Prescription Analgesic Use Among Adults With Musculoskeletal Conditions in the United States, 1999-2016
- PMID: 31825504
- PMCID: PMC6991204
- DOI: 10.1001/jamanetworkopen.2019.17228
Trends in Prescription Analgesic Use Among Adults With Musculoskeletal Conditions in the United States, 1999-2016
Abstract
Importance: Monitoring trends in prescription analgesic use among adults with musculoskeletal conditions provides insight into how changing prescribing practices, guidelines, and policy measures may affect those who need pain management.
Objective: To evaluate trends in prescription opioid use and nonopioid analgesic use among adults with functional limitations attributable to musculoskeletal conditions.
Design, setting, and participants: This repeated cross-sectional study uses data from the National Health and Nutrition Examination Study from 1999 to 2016. Data were analyzed from January to July 2019. The participants were adults aged 30 to 79 years who reported functional limitations due to back or neck problems and/or arthritis or rheumatism.
Main outcomes and measures: Any use of a prescription opioid or exclusive use of a prescription nonopioid analgesic.
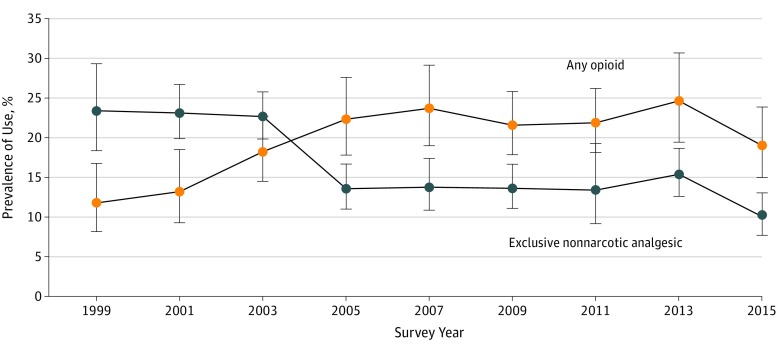
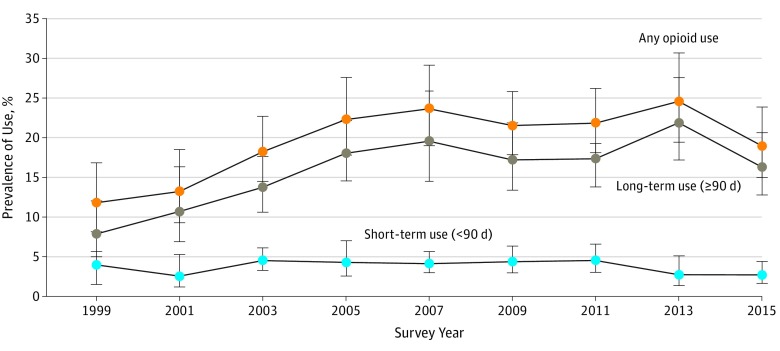
Results: In this population of 7256 adults with 1 or more functional limitations attributable to a musculoskeletal condition (4226 women [59.9%]; 3508 [74.4%] non-Hispanic white individuals; median [interquartile range] age, 63 [53-70] years), opioid use and exclusive nonopioid analgesic use exhibited approximately reciprocal patterns of change from 1999 to 2016. Opioid use increased significantly (difference in prevalence for 2015-2016 vs 1999-2000, 7.2%; 95% CI, 1.3% to 13%; P for trend = .002), and exclusive use of nonopioid analgesics decreased significantly (difference in prevalence for 2015-2016 vs 1999-2000, -13%; 95% CI, -19% to -7.5%; P for trend < .001) during this period. The increase in any opioid use was driven by long-term rather than short-term use. A crossover in the prevalence of opioid use and exclusive use of nonopioid analgesics occurred between 2003 and 2006, after which opioid use was more prevalent. Between 2013 and 2016, decreases in opioid use were observed among men (difference in prevalence for 2015-2016 vs 2013-2014, -11%; 95% CI, -21% to 1.8%) and participants with less than a high school education (difference, -15%; 95% CI, -24% to -6.1%). During this same period, exclusive nonopioid analgesic use also decreased markedly across the population (difference, -5.3%; 95% CI, -9.1% to -1.5%).
Conclusions and relevance: The substitution of opioids for nonopioid analgesics between 2003 and 2006 may have occurred as evidence emerged on the cardiovascular risks associated with nonopioid analgesics. Reductions in opioid use between 2013 and 2016 were most substantial among those with low socioeconomic status, who may encounter barriers in accessing alternatives. Despite those decreases, opioid use remained more prevalent in 2015 to 2016 than in 1999 to 2000, suggesting a potentially long tail for the opioid epidemic.
Conflict of interest statement
Figures
References
Publication types
MeSH terms
Substances
Grants and funding
LinkOut - more resources
Full Text Sources
