. 2019 Dec 10;29(11):3592-3604.e5.
doi: 10.1016/j.celrep.2019.11.044.

Amyloid Beta and Tau Cooperate to Cause Reversible Behavioral and Transcriptional Deficits in a Model of Alzheimer's Disease

Affiliations

Amyloid Beta and Tau Cooperate to Cause Reversible Behavioral and Transcriptional Deficits in a Model of Alzheimer's Disease

Eleanor K Pickett et al. Cell Rep. .

Abstract

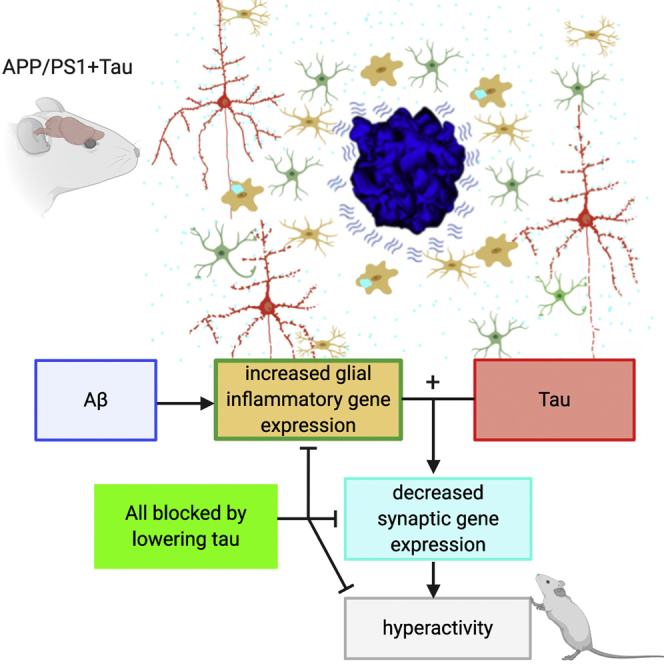
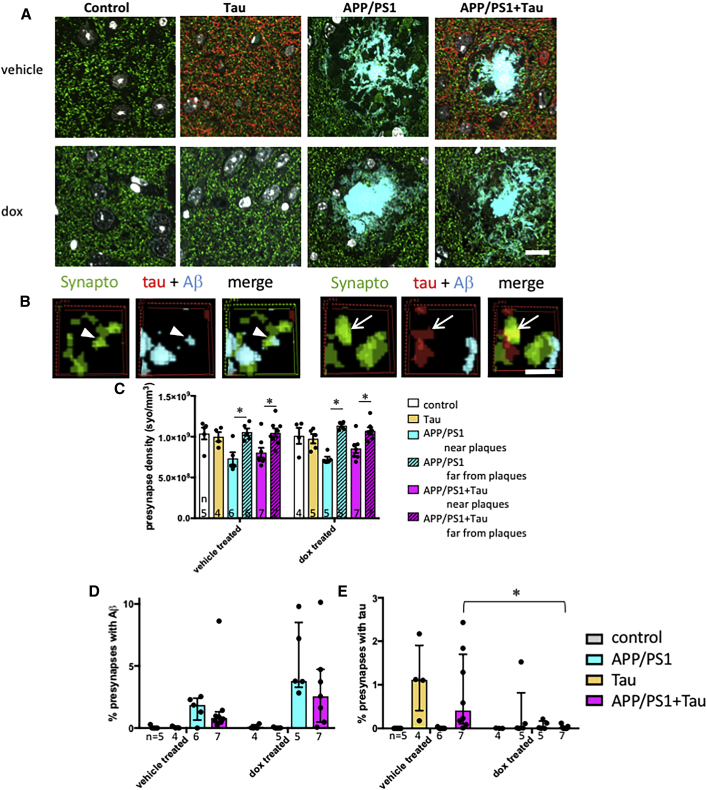
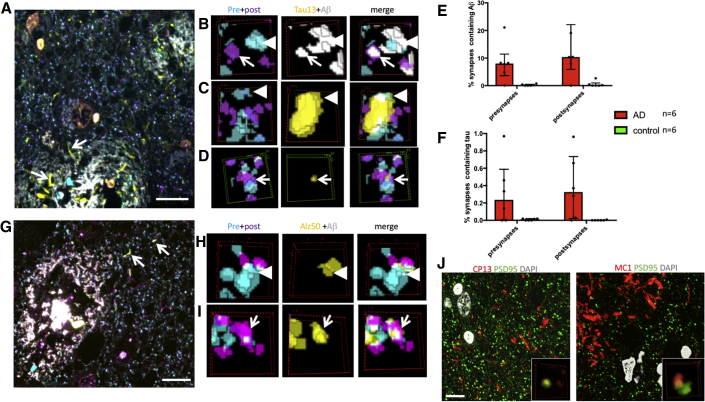
A key knowledge gap blocking development of effective therapeutics for Alzheimer's disease (AD) is the lack of understanding of how amyloid beta (Aβ) peptide and pathological forms of the tau protein cooperate in causing disease phenotypes. Within a mouse tau-deficient background, we probed the molecular, cellular, and behavioral disruption triggered by the influence of wild-type human tau on human Aβ-induced pathology. We find that Aβ and tau work cooperatively to cause a hyperactivity behavioral phenotype and to cause downregulation of transcription of genes involved in synaptic function. In both our mouse model and human postmortem tissue, we observe accumulation of pathological tau in synapses, supporting the potential importance of synaptic tau. Importantly, tau reduction in the mice initiated after behavioral deficits emerge corrects behavioral deficits, reduces synaptic tau levels, and substantially reverses transcriptional perturbations, suggesting that lowering synaptic tau levels may be beneficial in AD.

Keywords: Alzheimer; amyloid beta; array tomography; microglia; synapse; tau.


Conflict of interest statement

T.L.S.-J. receives funding from three industry collaborators and is on the scientific advisory board of Cognition Therapeutics. None of these companies had influence over the current work.

Figures

None
Graphical abstract
Figure 1
Figure 1
Progressive Plaque Pathology without Tau Pathology in APP/PS1+Tau Mice (A) APP/PS1+Tau mouse model was generated by breeding two feeder lines to produce four experimental genotypes of F1 littermates on a consistent outbred strain background. (B) Behavior, pathology, and recovery with tau transgene suppression were characterized over time. (C and D) Staining with thioflavin S (C) shows progressive plaque accumulation in APP/PS1+Tau and APP/PS1 mice. APP/PS1+Tau mice have significantly lower cortical plaque burden than APP/PS1 mice (D, two-way ANOVA, effect of genotype F[2,26] = 8.454, p = 0.007). (E) Tau is present in 14.5-month-old APP/PS1+Tau mice as shown with a total tau stain, but tau pathology does not accumulate in cell bodies or in dystrophic neurites around plaques, as shown by staining with phospho-tau (PHF1 and AT8) or misfolded tau (Alz50) antibodies, which all label tangle pathology in rTg4510-positive control sections. (F) None of the genotypes experienced age-related cortical atrophy (two-way ANOVA, effect of age, p > 0.05). Data shown are means ± SE. Dots on bar graphs represent means of individual animals (n per group, biological replicates, shown in each bar). Scale bars represent 1 mm (C, insets 100 × 100 μm) and 30 μm (E). See also Figure S1 and Table S1.
Figure 2
Figure 2
Hyperactivity and Transcriptional Changes in APP/PS1+Tau Mice (A and B) Open-field test was used as a measure of spontaneous activity. Representative traces from a mouse from each genotype at 10.5 months of age (A), demonstrate the excess activity of the APP/PS1+Tau mice compared with the other three genotypes (B, two-way ANOVA, effect of genotype F[3,202] = 314.76, p = 0 < 0.0001; Tukey’s post hoc tests, p ≤ 0.01, all comparisons of APP/PS1+Tau versus other 3 genotypes at 10.5 and 14.5 months; n of mice as biological replicates per group are noted on the graph). The dotted line in (B) indicates different cohorts of mice was used at 3, 6, and 9 months and at 10.5 and 14.5 months. (C) RNA-seq of APP/PS1 brain compared with controls reveals significant changes in gene expression (FPKM, fragments per kilobase of transcript per million mapped reads, biological replicates were mice, n = 5 per group). (D) Wild-type human tau induced changes to a lesser extent. (E) APP/PS1+Tau mice had more significant changes than when either APP/PS1 or Tau were expressed on their own. (F) Examining only the genes significantly changed in APP/PS1+Tau mice compared with control mice, and comparing the log(2) fold change (L2FC) of these on the x axis to the maximum L2FC of either APP/PS1 or Tau compared with controls on the y axis shows that upregulated genes are mostly not differentially regulated in APP/PS1+Tau mice compared with those expressing APP/PS1 or tau alone (black line linear regression slope, 0.9; 95% confidence interval [CI], 0.89 to 0.92; dotted red line is x = y, showing expected values if there were no differences). Downregulated genes in APP/PS1+Tau mice are differentially regulated in APP/PS1+Tau mice compared with those expressing APP/PS1 or tau alone (black line linear regression slope, 0.57; 95% CI, 0.51 to 0.63). Green crosses show transcripts of interest that are changed more in APP/PS1+Tau mice than in APP/PS1 or Tau mice, including downregulated genes involved in synaptic function and upregulated genes involved in inflammation. (G) Pathway analysis of all RNA-seq data reveals that many upregulated pathways in APP/PS1+Tau mice are also upregulated in APP/PS1 mice and most downregulated pathways are also downregulated in Tau mice (orange indicates increases, and blue indicates decreases compared with control levels; analysis from Ingenuity Pathway Analysis software). However, some pathways changed more in the APP/PS1+Tau line compared with the parent lines, including increases in the complement system and decreases in glutamatergic signaling. (H) Confocal imaging of Iba1 and synaptophysin staining shows that microglia engulf synaptic proteins around plaques (arrows show localization of synaptophysin inside microglia). Scale bar shows 5 microns. Transcripts that changed more than 2-fold with adjusted p < 0.05 are shown in red in (C)–(E). A few transcripts of interest based on previous work are labeled with gene names. Each cross in (C)–(F) represents the average value of 5 mice per genotype of a single transcript detected at a value of >1 FPKM. See also Figure S2 and Tables S1, S2, and S3.
Figure 3
Figure 3
Lowering Tau Levels Ameliorates Hyperactivity Phenotype and Transcriptional Changes (A) Transgene suppression (dox) reduced human tau mRNA levels by approximately 65% as measured by qPCR (two-way ANOVA, effect of treatment F[1,31] = 42.22, p < 0.0001). (B and C) Representative traces of open-field activity from a APP/PS1+Tau mouse treated with vehicle and one treated with doxycycline, and the trace from the same mice after treatment (B), show clear amelioration of hyperactivity phenotype in one mouse, which is confirmed by quantification of distance traveled (C, repeated-measures ANOVA, effect of genotype F[3,69] = 34.12, p < 0.0001; effect of treatment F[1,69] = 6.75, p = 0.01; interaction F[3,69] = 6.13, p = 0.001; Tukey’s multiple comparison tests, dox-treated APP/PS1+Tau mice are significantly different from vehicle-treated APP/PS1+Tau mice at 14.5 months of age, p < 0.0001). (D) RNA-seq data show that dox treatment to reduce tau levels reverses transcriptional changes in APP/PS1+Tau mice (linear regression slope = −0.34, 95% CI −0.36 to −0.33). Each point represents a single transcript (average of n = 5 mice per group). (E) Pathway analysis reveals that the top 15 up- and downregulated canonical pathways in APP/PS1+Tau mice compared with controls recover to normal levels or past normal levels with dox treatment (orange indicates increases, and blue indicates decreases compared with control levels; analysis from Ingenuity Pathway Analysis software). Biological replicate/experimental unit for each experiment is an individual mouse, n per group shown in (A) and (C). See also Figures S3 and S4 and Tables S1, S2, and S3.
Figure 4
Figure 4
Tau Suppression Reduces Presynaptic Accumulation of Tau in the Entorhinal Cortex To investigate synapse loss and synaptic proteins, array tomography ribbons from 14.5-month-old mice were stained for presynaptic terminals (synaptophysin, green) human tau (red), and amyloid beta (AW7, cyan). (A) Maximum intensity projections of 10 serial 70-nm sections of a mouse in each group are shown. (B) Three-dimensional reconstructions of 5 consecutive serial sections from processed image stacks of a APP/PS1+Tau mouse demonstrate presynaptic terminals positive for tau (arrows) or Aβ (arrowheads). (C) Quantification reveals significant presynaptic loss near plaques in APP/PS1 and APP/PS1+Tau mice, which is not rescued by lowering tau levels with doxycycline (dox) treatment. (D) Percentage of presynapses positive for Aβ is not different between MAPTnullxAPP/PS1 mice and APP/PS1+Tau mice, and it is not affected by dox treatment. (E) Percentage of presynapses containing tau is significantly lowered by dox treatment in APP/PS1+Tau mice (Mann-Whitney U test, p = 0.004). Data represent mean + SEM (C) and median + interquartile range (D and E). Scale bars represent 10 μm in (A) and 1 μm in (B). Each dot on the graphs represents the mean (C) or median (D and E) of a single mouse (biological replicate/experimental unit = mouse, n shown in each panel). See also Figures S4 and S5 and Table S1.
Figure 5
Figure 5
Tau Is Found in Pre- and Postsynapses in Human AD Brain (A–F) Array tomography was used in human AD and control postmortem brain tissue to stain Aβ (white), Tau13 (yellow), PSD95 (magenta), and synaptophysin (cyan). Tau13 stains neuropil threads (A, arrows). Examining individual synapses revealed that Aβ was present in 8.0% of presynaptic terminals (B, arrowheads) and 10.4% of postsynaptic densities (B, arrows) near plaques in AD cases (B and E). Tau13 staining was observed in 0.23% of presynaptic terminals (C, arrowheads, quantified in F), and 0.32% of postsynaptic terminals (D, arrows, quantified in F). (G–I) Misfolded tau labeled with Alz50 (yellow) was observed in neuropil threads (G, arrows) and in presynapses (H, arrowheads) and postsynapses (I, arrows). (J) Tau phosphorylated at serine 202 (labeled with CP13) and misfolded (residues 5–15 near 312–322, labeled with MC1) was observed in PSDs. Images in (A) and (G) and large panels in (J) are maximum intensity projections of 10 serial sections. Scale bar represents 10 μm in (A), (G), and (J). (B)–(D), (H), (I), and insets in (J) show three-dimensional reconstructions of a 2 × 2 micron region of interest in 5 consecutive serial 70-nm sections. Data shown are median and interquartile ranges. Each dot represents the median of a single human subject (subject is the biological replicate/experimental unit, n = 6 per group). See also Table S4.

References

    1. Barry A.E., Klyubin I., Mc Donald J.M., Mably A.J., Farrell M.A., Scott M., Walsh D.M., Rowan M.J. Alzheimer’s disease brain-derived amyloid-β-mediated inhibition of LTP in vivo is prevented by immunotargeting cellular prion protein. J. Neurosci. 2011;31:7259–7263. - PMC - PubMed
    1. Bennett R.E., DeVos S.L., Dujardin S., Corjuc B., Gor R., Gonzalez J., Roe A.D., Frosch M.P., Pitstick R., Carlson G.A., Hyman B.T. Enhanced Tau Aggregation in the Presence of Amyloid β. Am. J. Pathol. 2017;187:1601–1612. - PMC - PubMed
    1. Bennett R.E., Bryant A., Hu M., Robbins A.B., Hopp S.C., Hyman B.T. Partial reduction of microglia does not affect tau pathology in aged mice. J. Neuroinflammation. 2018;15:311. - PMC - PubMed
    1. Blackmore T., Meftah S., Murray T.K., Craig P.J., Blockeel A., Phillips K., Eastwood B., O’Neill M.J., Marston H., Ahmed Z. Tracking progressive pathological and functional decline in the rTg4510 mouse model of tauopathy. Alzheimers Res. Ther. 2017;9:77. - PMC - PubMed
    1. Busche M.A., Wegmann S., Dujardin S., Commins C., Schiantarelli J., Klickstein N., Kamath T.V., Carlson G.A., Nelken I., Hyman B.T. Tau impairs neural circuits, dominating amyloid-β effects, in Alzheimer models in vivo. Nat. Neurosci. 2019;22:57–64. - PMC - PubMed

Publication types