. 2019 Dec 10;29(11):3751-3765.e5.
doi: 10.1016/j.celrep.2019.11.026.

Splice-Junction-Based Mapping of Alternative Isoforms in the Human Proteome

Affiliations

Splice-Junction-Based Mapping of Alternative Isoforms in the Human Proteome

Edward Lau et al. Cell Rep. .

Abstract

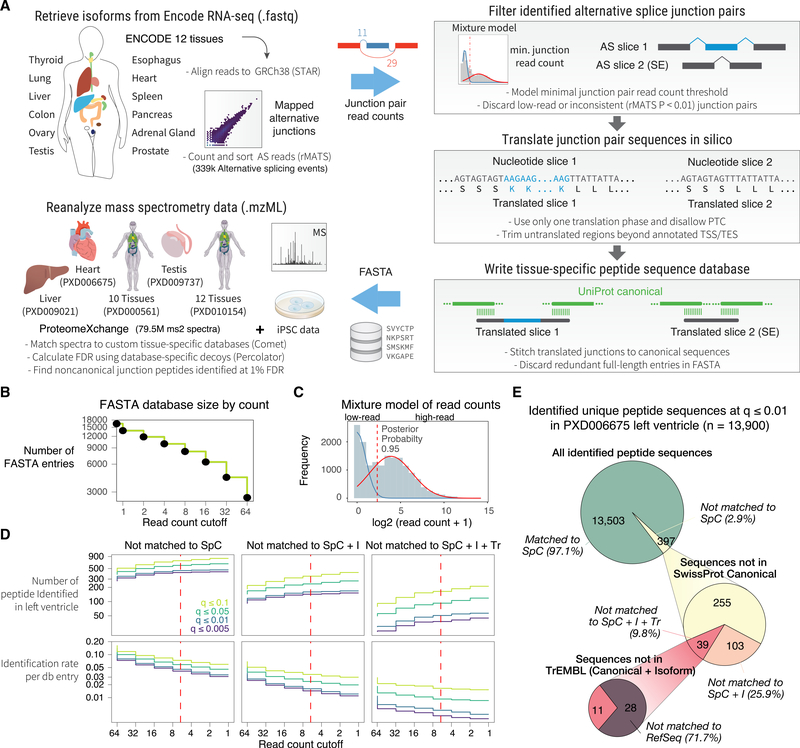
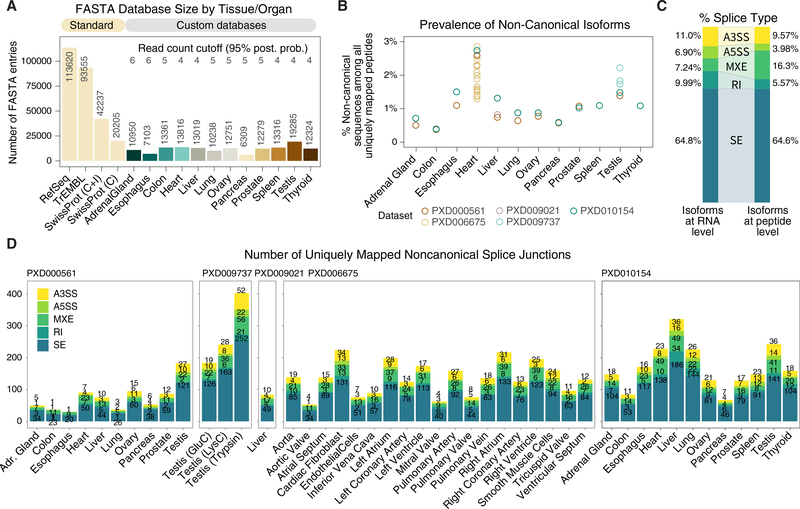
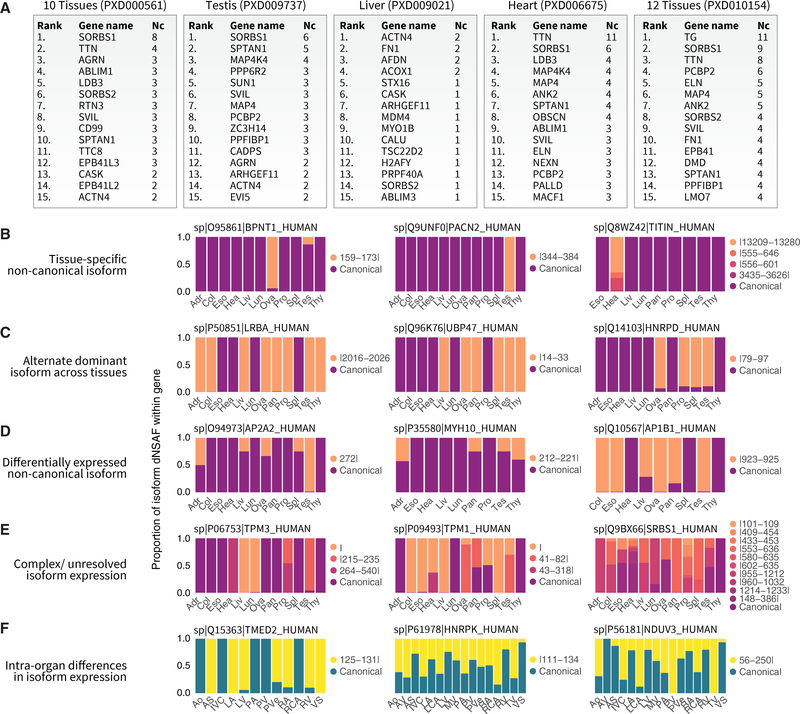
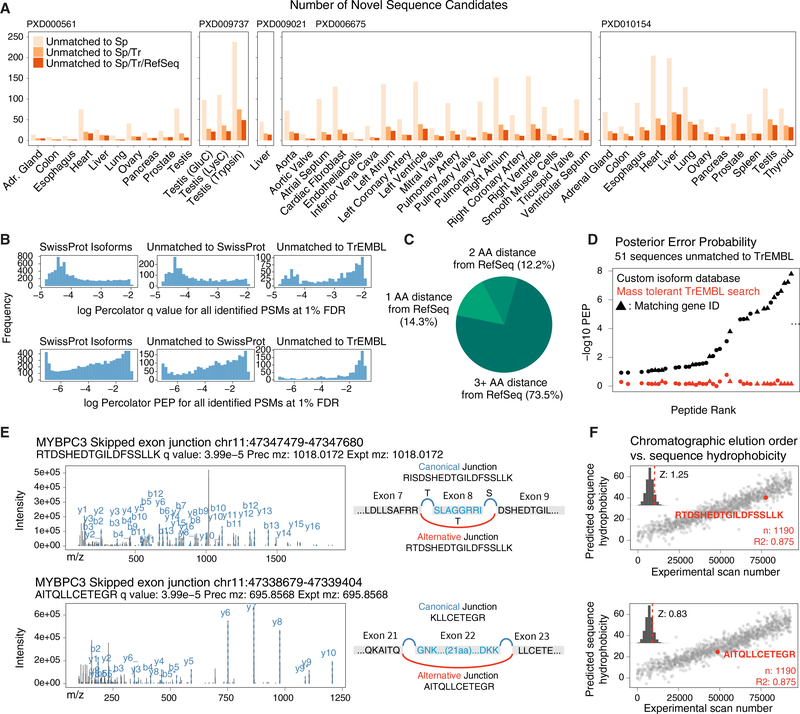
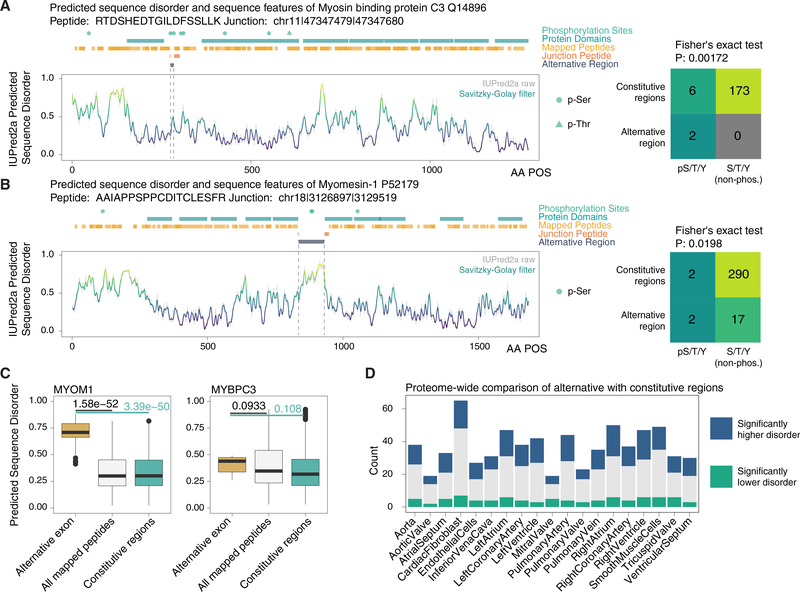
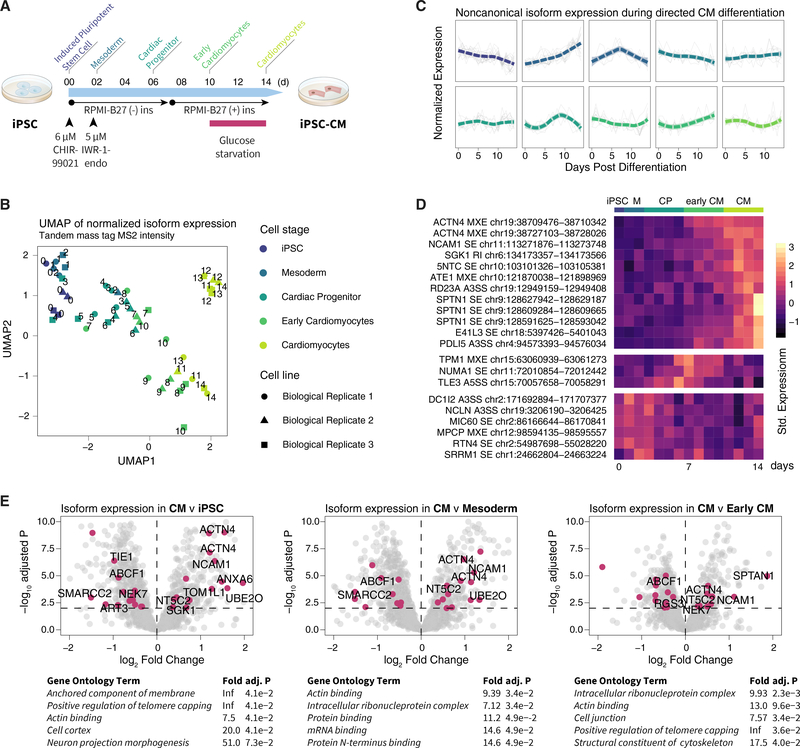
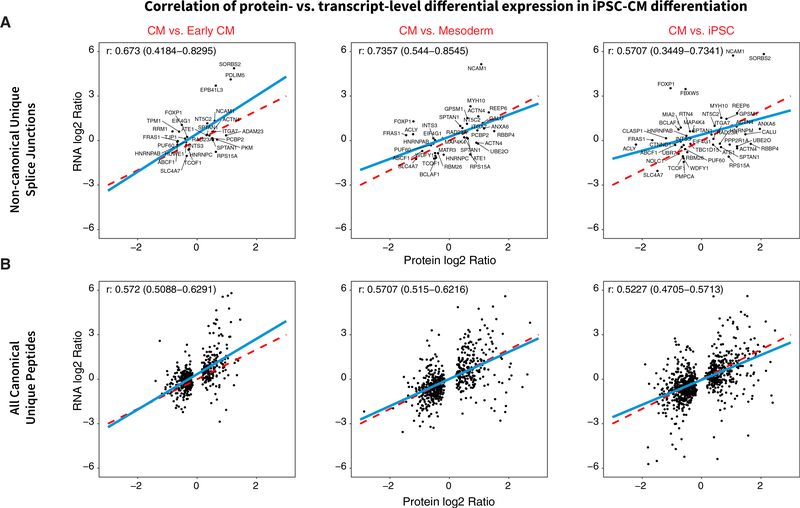
The protein-level translational status and function of many alternative splicing events remain poorly understood. We use an RNA sequencing (RNA-seq)-guided proteomics method to identify protein alternative splicing isoforms in the human proteome by constructing tissue-specific protein databases that prioritize transcript splice junction pairs with high translational potential. Using the custom databases to reanalyze ∼80 million mass spectra in public proteomics datasets, we identify more than 1,500 noncanonical protein isoforms across 12 human tissues, including ∼400 sequences undocumented on TrEMBL and RefSeq databases. We apply the method to original quantitative mass spectrometry experiments and observe widespread isoform regulation during human induced pluripotent stem cell cardiomyocyte differentiation. On a proteome scale, alternative isoform regions overlap frequently with disordered sequences and post-translational modification sites, suggesting that alternative splicing may regulate protein function through modulating intrinsically disordered regions. The described approach may help elucidate functional consequences of alternative splicing and expand the scope of proteomics investigations in various systems.

Keywords: alternative splicing; cardiomyocyte differentiation; human proteome; induced pluripotent stem cells; intrinsically disordered region; mass spectrometry; protein isoforms; proteoforms; proteomics; splice isoforms.


Conflict of interest statement

DECLARATION OF INTERESTS

The authors declare no competing interests.

Figures

Figure 1.
Figure 1.. Splice-Junction-Centric Approach to Identify Protein Isoforms
(A) Schematic of the method. ENCODE RNA-seq data from 12 human tissues are mapped to GRCh38. AS pairs are extracted then filtered by junction read counts and consistency. Candidate junctions are trimmed using Ensembl GTF-annotated translation start site (TSS) and translation end site (TES) and then translated in-frame by using either GTF-annotated reading frames or by choosing a frame that does not lead to PTC. The translated junction pairs are extended to encompass the full protein sequence. The created custom tissue-specific databases are used to identify noncanonical protein isoforms in public and original MS data. (B) Number of translated sequences versus minimal skipped junction read count threshold following in silico translation in ENCODE human heart data. Inclusion of low-read junctions increases database size. (C) Gaussian mixture fitting overlaid on skipped junction read counts of all AS events in the heart database. Dotted line: chosen threshold. (D) Number of identified noncanonical isoform sequences in the reanalyzed human heart left ventricle MS data versus junction read count thresholds. Color: Percolator FDR cutoff calculated with database-specific decoys. (E) Proportion of identified distinct peptide sequences in the left ventricle dataset (13,900 total) not matchable to SwissProt canonical (SpC), SwissProt canonical + isoform (SpC + I), TrEMBL (Tr), or RefSeq.
Figure 2.
Figure 2.. Identification of Noncanonical Isoforms in the Human Proteome
(A) Comparison on the number of sequences in standard databases (RefSeq TrEMBL, SwissProt canonical + isoform, and SwissProt canonical) versus the custom tissue-specific databases. The custom databases have fewer sequences than SwissProt (B) The proportion of distinct peptides uniquely mappable to noncanonical isoforms per tissue, with the heart and testis particularly enriched in noncanonical isoforms. Color of data points corresponds to each of 5 reanalyzed human proteome datasets. (C) Proportion of AS types in RNA-seq data (left) compared to identified noncanonical peptides (right), showing higher translatable rate for MXE. (D) The number of uniquely identified noncanonical junction peptides at 1% FDR across tissues in 5 reanalyzed human proteome datasets (ProteomeXchange: PXD000561, PXD009737, PXD009021, PXD006675, and PXD010154), including noncanonical sequences from known isoforms and undocumented sequences. Color: AS type (A3SS, A5SS, MXE, RI, and SE).
Figure 3.
Figure 3.. Protein Isoform Diversity and Tissue-Specific Expression
(A) Top 15 genes associated with the most identified noncanonical isoform (Nc) sequences across reanalyzed human proteome datasets. (B-E) Distributed normalized spectral abundance factor (dNSAF)-based assessment of relative isoform prevalence for each gene across tissues in cases where unique peptide junctions are resolvable. Isoforms across databases are harmonized by junction position and sequence alignment (insertion | deletion on legends) against the canonical sequence. Examples show 4 classes of tissue distributions in the data. (B) Tissue-specific isoforms confined to only one assessed tissue, frequently the testis and ovary but also the heart. (C) Two isoforms of a gene with alternate expression in different tissues. (D) Quantitative differences in the expression levels of alternative versus canonical isoforms. (E) Complex patterns of multiple junctions, including instances where the relative abundance of the canonical isoform is indeterminable by dNSAF in some tissues due to the absence of unique sequences. (F) Tissue-specific expression is also evident in anatomical regions within the heart, including isoforms preferentially found in the myocardium over the vasculature. Adr, adrenal gland; Col, colon; Eso, esophagus; Hea, heart; Liv, liver; Lun, lung; Ova, ovary; Pan, pancreas; Pro, prostate; Spl, spleen; Tes, testis; Thy, thyroid; Ao, aorta; AV, aortic valve; AS, atrial septum; IVC, inferior vena cava; LA, left atrium; LCA, left coronary artery; LV, left ventricle; MV, mitral valve; PA, pulmonary artery; PV, pulmonary valve; PVe, pulmonary vein; RA, right atrium; RCA, right coronary artery; RV, right ventricle; TV, tricuspid valve; VS, ventricular septum.
Figure 4.
Figure 4.. Splice Junctions Include Peptides Undocumented in Common Databases
(A) Number of undocumented sequence candidates in each reanalyzed tissue across 5 public human proteome datasets. (B) Distribution of Percolator FDR and posterior error probability (PEP) of noncanonical sequences that are matched to SwissProt isoforms (left) against those not in SwissProt (middle) or TrEMBL (right). (C) Proportion of peptide sequences that are not mappable to RefSeq, allowing 1, 2, or 3 mismatches. (D) Comparison of −log10 Percolator PEP for 51 left ventricle peptide spectrum matches to sequences not in TrEMBL versus the results from the corresponding spectra in a mass tolerant open search against TrEMBL. (E) Tandem mass spectra of two identified splice junction peptides (RTDSHEDTGILDFSSLLK and AITQLLCETEGR for MYPBC3) not found in SwissProt, TrEMBL, or RefSeq. (F) The predicted hydrophobicity of the two undocumented sequences shows the sequence eluted at the expected retention time when the spectrum was acquired. Inset: Z score of residuals from best-fit line.
Figure 5.
Figure 5.. Splice Isoforms Preferentially Overlap with Disordered Protein Regions
(A) Sequence features of MYBPC3 highlighting PKA regulatory sites overlapping with the alternative region (residues skipped in the noncanonical isoform) of the protein, and the identified junction peptide spanning the excluded region. Sequence disorder was predicted using IUPred2a and aligned with annotated protein domains and PTM sites on UniProt. (Right) Contingency table on the number of annotated phosphorylation sites and serine/threonine/tyrosine that are not annotated to be phosphorylated in the excluded region versus the rest of the protein sequence. (B) As above, for an MYOM1 SE isoform. (C) Boxplots showing the distribution of sequence disorder in the alternative region (gold) of MYOM1 and MYBPC3 versus all residues uniquely identified by peptide in the database search (white) and the full-length protein sequence excluding the alternative region (green). p value: Mann-Whitney test. Box: 25th–75th percentile; whiskers: 5th-95th percentile. (D) On a proteome scale, alternative regions are significantly associated with higher sequence disorder (blue) over the rest of the protein.
Figure 6.
Figure 6.. Expression of Protein Isoforms during iPSC Cardiac Differentiation
(A) Schematic for human-iPSC-directed cardiac differentiation protocol with annotated stages (iPSC, day 0; mesoderm, day 1–2; cardiac progenitor, day 3–6; early CM, day 7–10; CM, day 11–14). (B) UMAP projection of tandem mass tag intensity shows that total protein expression reflects differentiation stages (n = 3 biological replicates). (C) Hierarchical clustering of noncanonical peptide expression during iPSC-CM differentiation shows diverse temporal behaviors of noncanonical isoforms in each cluster. (D) Heatmap of row-standardized expression of noncanonical isoforms with cell-specific expression during differentiation (n = 3 biological replicates). (E) Volcano plot of logFC versus −log10-adjusted p values comparing protein expression between CM with (left) iPSC, (center) mesoderm, and (right) early CM. Data points, isoforms; magenta, differentially expressed noncanonical isoforms (limmaadj. p ≤ 0.01); differentially expressed isoforms not found in SwissProt are labeled.
Figure 7.
Figure 7.. Correlation of Isoform Differential Regulation at Transcript and Protein Levels
Scatterplots showing differential expression (logFC) of isoforms at transcript (y axis) versus protein (x axis) levels during iPSC-CM differentiation for noncanonical junction sequences only (A) and all canonical SwissProt unique sequences (B) that were quantified in both RNA-seq and MS and found to be differentially regulated. Protein and transcript isoform logFC show robust positive correlation (Pearson’s r, 0.57–0.74 noncanonical isoforms; 0.52–0.57 canonical). Blue line, best-fit linear regression; red dashed line, unity.

References

    1. Adusumilli R, and Mallick P (2017). Data Conversion with ProteoWizard msConvert. Methods Mol. Biol 1550, 339–368. - PubMed
    1. Aebersold R, Agar JN, Amster IJ, Baker MS, Bertozzi CR, Boja ES, Costello CE, Cravatt BF, Fenselau C, Garcia BA, et al. (2018). How many human proteoforms are there? Nat. Chem. Biol 14, 206–214. - PMC - PubMed
    1. Alfaro JA, Sinha A, Kislinger T, and Boutros PC (2014). Onco-proteogenomics: cancer proteomics joins forces with genomics. Nat. Methods 11, 1107–1113. - PubMed
    1. Ballouz S, Dobin A, Gingeras TR, and Gillis J (2018). The fractured landscape of RNA-seq alignment: the default in our STARs. Nucleic Acids Res. 46, 5125–5138. - PMC - PubMed
    1. Barbosa-Morais NL, Irimia M, Pan Q, Xiong HY, Gueroussov S, Lee LJ, Slobodeniuc V, Kutter C, Watt S, Colak R, et al. (2012). The evolutionary landscape of alternative splicing in vertebrate species. Science 338, 1587–1593. - PubMed

Publication types