. 2020 Jun;39(6):1801-1811.
doi: 10.1109/TMI.2019.2958256. Epub 2019 Dec 6.

Optimized Combination of Multiple Graphs With Application to the Integration of Brain Imaging and (epi)Genomics Data

Optimized Combination of Multiple Graphs With Application to the Integration of Brain Imaging and (epi)Genomics Data

Yuntong Bai et al. IEEE Trans Med Imaging. 2020 Jun.

Abstract

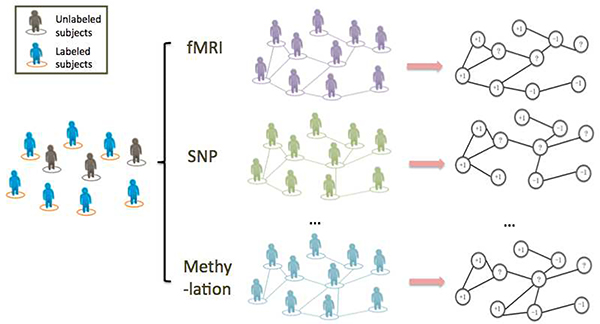
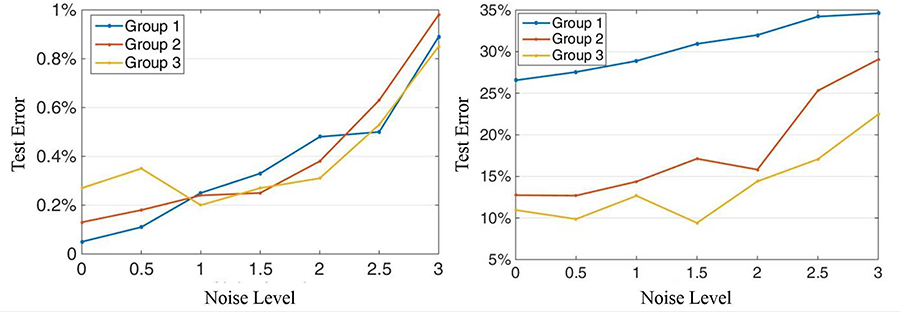
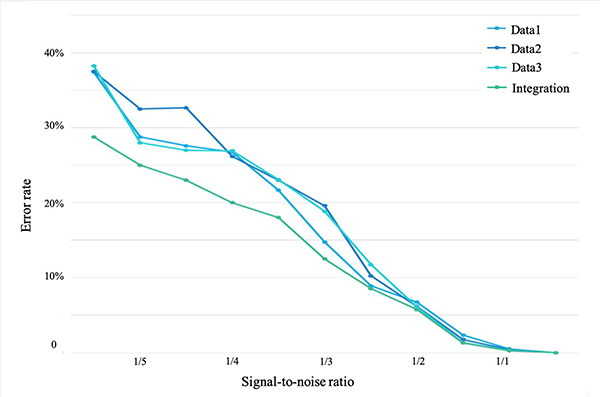
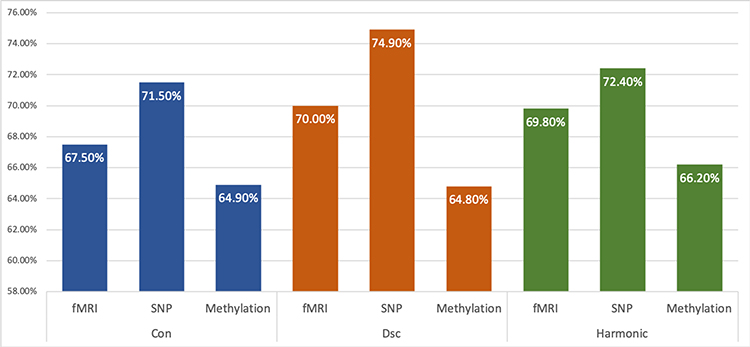
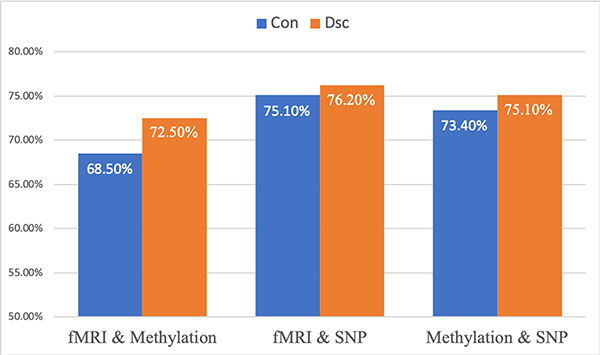
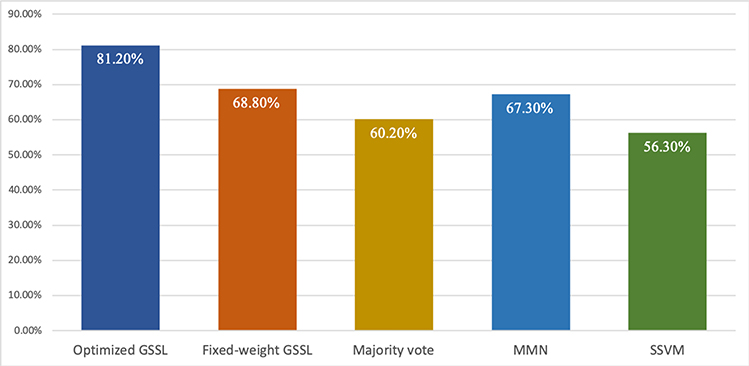
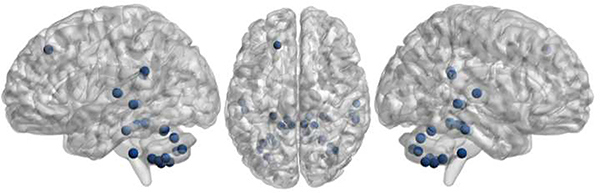
With the rapid development of high-throughput technologies, a growing amount of multi-omics data are collected, giving rise to a great demand for combining such data for biomedical discovery. Due to the cost and time to label the data manually, the number of labelled samples is limited. This motivated the need for semi-supervised learning algorithms. In this work, we applied a graph-based semi-supervised learning (GSSL) to classify a severe chronic mental disorder, schizophrenia (SZ). An advantage of GSSL is that it can simultaneously analyse more than two types of data, while many existing models focus on pairwise data analysis. In particular, we applied GSSL to the analysis of single nucleotide polymorphism (SNP), functional magnetic resonance imaging (fMRI) and DNA methylation data, which accounts for genetics, brain imaging (endophenotypes), and environmental factors (epigenomics) respectively. While parameter selection has been an open challenge for most models, another key contribution of this work is that we explored the parameter space to interpret their meaning and established practical guidelines. Based on the practical significance of each hyper-parameter, a relatively small range of candidate values can be determined in a data-driven way to both optimize and speed up the parameter tuning process. We validated the model through both synthetic data and a real SZ dataset of 184 subjects from the Mental Illness and Neuroscience Discovery (MIND) Clinical Imaging Consortium. In comparison to several existing approaches, our algorithm achieved better performance in terms of classification accuracy. We also confirmed the significance of several brain regions associated with SZ.


Figures

Fig. 1:
Fig. 1:
Graph construction from views of data: when performing a binary classification task on a group of people, no matter labelled or not, similarity matrices can be extracted from various types of data (e.g., fMRI, SNP or DNA methylation data). All entries of the similarity matrices are non-negative and the (i,j)th entry of one particular similarity matrix measures the strength of the connection between subject i and subject j in the corresponding view. Then each matrix can be depicted as an undirected graph that consists of two parts: nodes that represent individuals, and edges connecting the nodes. Nodes corresponding to labelled subjects are labelled as either ‘+1’ or ‘−1’ based on their phenotype. Unlabelled nodes are marked with’?’ and the goal is to predict their class using the graph. Edges connecting the nodes measure the pairwise similarity. If there is no edge connecting two nodes, the similarity between these two is neglectable. To combine the information from different data is equivalent to integrating the extracted graphs.
Fig. 2:
Fig. 2:
Classification performance using (a) GSSL algorithm and (b) SVM with RBF kernel. Group 1 to 3 correspond to using 10%, 20% and 25% of the whole data as training group. The y-axis represents test error, and the x-axis represents the noise level L.
Fig. 3:
Fig. 3:
The classification performance using high dimensional synthetic data with multiviews. With growing signal-to-noise ratio, the testing error is reduced. In general, the method is robust to noise within a reasonable range.
Fig. 4:
Fig. 4:
A comparison of SZ classification accuracy (100% minus testing error) using single type of omics data with different graph-based method. From left to right: 1. ‘Con’: GSSL with fully connected graphs; 2. ‘Dsc’: GSSL with disconnected graphs where each subgraph has at least one labelled node;3. ‘Harmonic’: harmonic function proposed in [13] with disconnected graphs where each subgraph has at least one labelled node.
Fig. 5:
Fig. 5:
SZ classification accuracy (100% minus testing error) with pair-wise combination of omics data. From left to right: optimized combination : 1. fMRI and DNA methylation data; 2. fMRI and SNP data; 3. DNA methylation and SNP data. Blue and orange bars correspond to fully-connected graphs and disconnected graphs, respectively.
Fig. 6:
Fig. 6:
SZ classification accuracy (100% minus testing error) with integration of SNP, DNA methylation and fMRI data with different methods. From left to right: 1. GSSL with optimized weights; 2. GSSL with fixed weight; 3. GSSL with majority vote; 4. majority-neighborhood-based classification by mean fusion (MMN); 5. similarity-network-fusion-based SVM (SSVM).
Fig. 7:
Fig. 7:
Visualization of 14 important brain regions confirmed by our analysis.

References

    1. Higdon R, Earl RK, Stanberry L, Hudac CM, Montague E, Stewart E, et al. The promise of multi-omics and clinical data integration to identify and target personalized healthcare approaches in autism spectrum disorders. Omics: a journal of integrative biology, 19(4):197–208, 2015. - PMC - PubMed
    1. Huang S, Chaudhary K, and Garmire LX More is better: Recent progress in multi-omics data integration methods. Frontiers in Genetics, 8:84, 2017. - PMC - PubMed
    1. Miao R, Luo H, Zhou H, Li G, Bu D, Yang X, et al. Identification of prognostic biomarkers in hepatitis b virus-related hepatocellular carcinoma and stratification by integrative multi-omics analysis. Journal of hepatology, 61(4):840–849, 2014. - PubMed
    1. Cisek K, Krochmal M, Klein J, and Mischak H The application of multi-omics and systems biology to identify therapeutic targets in chronic kidney disease. Nephrology Dialysis Transplantation, 31(12):2003–2011, 2015. - PubMed
    1. Wheelock CE, Goss VM, Balgoma D, Nicholas B, Brandsma J, Skipp PJ, et al. Application of omics technologies to biomarker discovery in inflammatory lung diseases. European Respiratory Journal, 42(3):802–825, 2013. - PubMed

Publication types