. 2019 Dec 2;60(15):5112-5123.
doi: 10.1167/iovs.19-27761.

Deep Phenotyping of PDE6C-Associated Achromatopsia

Affiliations

Deep Phenotyping of PDE6C-Associated Achromatopsia

Michalis Georgiou et al. Invest Ophthalmol Vis Sci. .

Abstract

Purpose: To perform deep phenotyping of subjects with PDE6C achromatopsia and examine disease natural history.

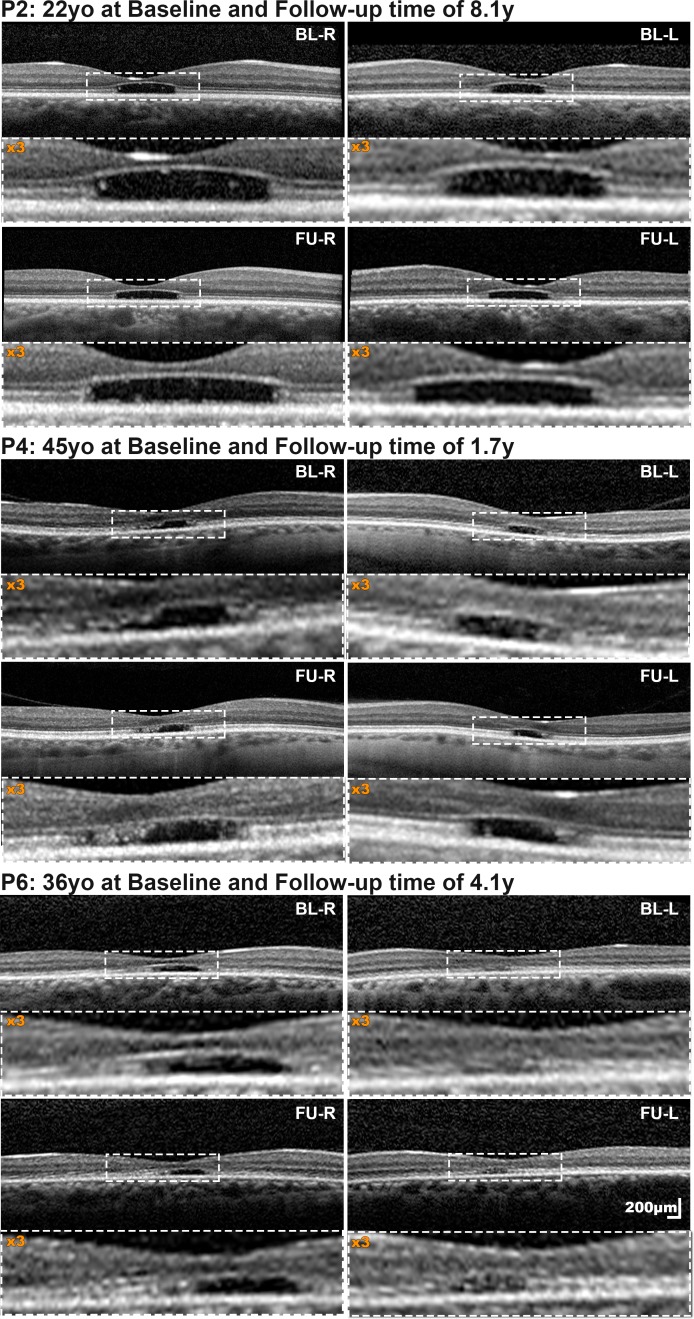
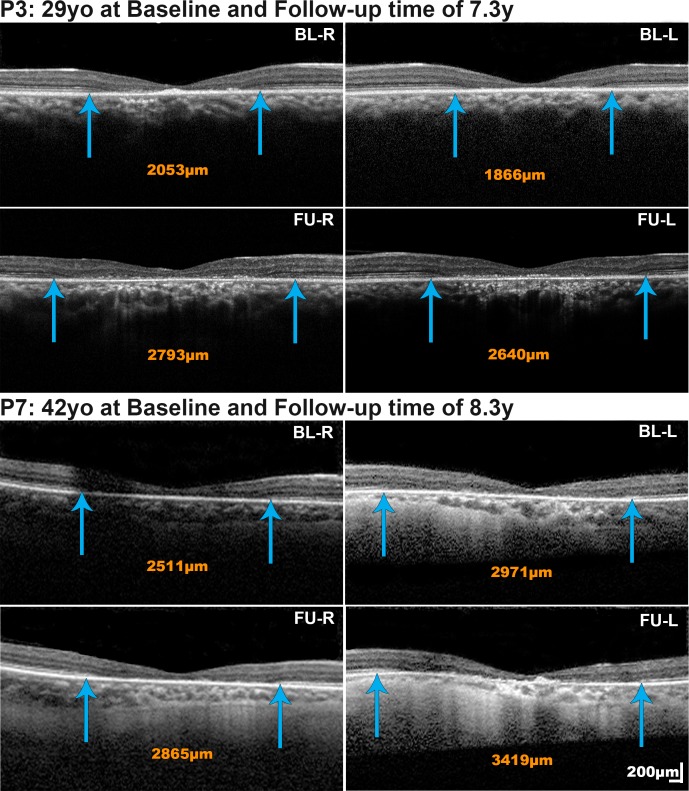
Methods: Eight subjects with disease-causing variants in PDE6C were assessed in detail, including clinical phenotype, best-corrected visual acuity, fundus autofluorescence, and optical coherence tomography. Six subjects also had confocal and nonconfocal adaptive optics scanning light ophthalmoscopy, axial length, international standard pattern and full-field electroretinography (ERG), short-wavelength flash (S-cone) ERGs, and color vision testing.

Results: All subjects presented with early-onset nystagmus, decreased best-corrected visual acuity, light sensitivity, and severe color vision loss, and five of them had high myopia. We identified three novel disease-causing variants and provide phenotype data associated with nine variants for the first time. No subjects had foveal hypoplasia or residual ellipsoid zone (EZ) at the foveal center; one had an absent EZ, three had a hyporeflective zone, and four had outer retinal atrophy. The mean width of the central EZ lesion on optical coherence tomography at baseline was 1923 μm. The mean annual increase in EZ lesion size was 48.3 μm. Fundus autofluorescence revealed a central hypoautofluorescence with a surrounding ring of increased signal (n = 5). The mean hypoautofluorescent area at baseline was 3.33 mm2 and increased in size by a mean of 0.13 mm2/year. Nonconfocal adaptive optics scanning light ophthalmoscopy revealed residual foveal cones in only one of two cases. Full-field ERGs were consistent with severe generalized cone system dysfunction but with relative preservation of S-cone sensitivity.

Conclusions: PDE6C retinopathy is a severe cone dysfunction syndrome often presenting as typical achromatopsia but without foveal hypoplasia. Myopia and slowly progressive maculopathy are common features. There are few (if any) residual foveal cones for intervention in older adults.


Figures

Figure 1
Figure 1
Spectral-domain optical coherence tomography (SD-OCT) in cases with minimal change over time. For all patients, both baseline and follow-up horizontal transfoveal scans are presented at the same scale. The central area marked with a dashed white rectangle is magnified (×3), below each scan. All three subjects had a grade 4 EZ (presence of hyporeflective zone) both at baseline and follow-up, confined to the fovea, with minimal increase in the EZ lesion size of 3.54/8.87, 2.01/0.68, and 1.65/2.76 μm/year for right/left eyes of P2, P4, and P6, respectively. BL-R, baseline right eye; BL-L, baseline left eye; FU-R, follow-up right eye; FU-L, follow-up left eye; y, years; yo, years old.
Figure 2
Figure 2
Spectral-domain optical coherence tomography (SD-OCT) in cases with progression over time. The nasal and temporal border of the EZ lesion are marked with blue arrows and in the extent of the lesion reported in orange numbers. The size of the EZ lesion increased in P3 and P7 at rates (right eye/left eye) of 102.02/106.71 μm/year and 42.52/53.67 μm/year, respectively. Scale bars = 200 microns, with all scans at the same scale.
Figure 3
Figure 3
Fundus autofluorescence (FAF) images at baseline and follow-up for both eyes of six patients. P2, P3, P5, P7, and P8 have a central area of hypoautofluorescence with a surrounding ring of increased signal. Both the area of atrophy and the ring of increased signal are expanding at comparable rates from the foveal center to the periphery. The rate, however, was variable among subjects, with patients P2 and P7 progressing minimally, if at all. P4 has a normal-appearing FAF at baseline and follow-up, with subtle foveal changes. All images are at the same scale. R, right eye; L, left eye
Figure 4
Figure 4
International-standard full-field ERGs and S-cone ERGs recorded from five subjects and one representative control subject for comparison (N). Data are shown for one eye but all had symmetrical responses. Broken lines replace blink/eye movement artefacts related to nystagmus, for clarity. Note increased amplitude scaling of LA 30 Hz and LA3 ERGs in the patients compared with the control. The DA10 ERG a-waves were normal or mildly subnormal, with a tendency to be smaller in older subjects (P7 and P8). The mean a-wave amplitude was decreased. Single flash cone (LA3) ERG b-waves were detectable but delayed, simplified, and reduced. The LA3 ERG and S-cone ERG waveforms were similar (see text for details).
Figure 5
Figure 5
ERG graphs. (A) The mean a-wave amplitude was 33% lower than the mean for a control group of 130 unaffected individuals. Light-adapted (LA) 30-Hz flicker ERGs were undetectable or residual (P7). (B) and (C) show data from right eyes. (B) The DA10 ERG a- and b-wave peak times were within normal limits. (C) The LA3 ERG and S-cone ERG amplitudes were similar. The lower limit of normal amplitude for the LA3 ERG is 101 μV and that for the S-cone ERG is 10 μV.
Figure 6
Figure 6
Adaptive optics scanning light ophthalmoscopy (AOSLO) of P2. (A) Confocal AOSLO photoreceptor mosaic scaled and superimposed on an FAF image. A central dark atrophic region was imaged, revealing a lack of waveguiding properties. The white square marks the 200-μm square in greater magnification in (B). (B) Confocal imaging and (C) split-detection image over the same location. The top right corner lacks waveguiding properties on (B) and ambiguous cellular structures (blue arrow heads, remnant inner segments) are seen on split-detection (C). A few cones at the edge of the lesion have greater preserved reflectivity, and inner segments on split-detection and are marked with yellow arrowheads. Scale bar for (A), 1000 μm; and for (B, C), 100 μm
Figure 7
Figure 7
Adaptive optics scanning light ophthalmoscopy (AOSLO) of P4. (A) Confocal image over the fovea with lack of normal waveguiding properties. Few bright spots, which may be waveguiding cones, are marked with yellow arrowheads. (B) Split-detection AOSLO over the exact same location reveals an island of residual inner segments. The yellow arrowheads mark the same location as in (A) and the bright spots on confocal appear to have corresponding inner segments. The blue cross marks the location of the calculated peak cone density (11,895 cones/mm2). Scale bar: 100 μm

References

    1. Hirji N, Aboshiha J, Georgiou M, et al. Achromatopsia: clinical features, molecular genetics, animal models and therapeutic options. Ophthalmic Genet. 2018;39:1–9. - PubMed
    1. Aboshiha J, Dubis AM, Carroll J, et al. The cone dysfunction syndromes. Br J Ophthalmol. 2016;100:115–121. - PMC - PubMed
    1. Wissinger B, Jagle H, Kohl S, et al. Human rod monochromacy: linkage analysis and mapping of a cone photoreceptor expressed candidate gene on chromosome 2q11. Genomics. 1998;51:325–331. - PubMed
    1. Wissinger B, Gamer D, Jagle H, et al. CNGA3 mutations in hereditary cone photoreceptor disorders. Am J Hum Genet. 2001;69:722–737. - PMC - PubMed
    1. Mayer AK, Van Cauwenbergh C, Rother C, et al. CNGB3 mutation spectrum including copy number variations in 552 achromatopsia patients. Hum Mutat. 2017;38:1579–1591. - PubMed

Publication types

MeSH terms

Substances

Supplementary concepts