

Gut Microbiomes of the Eastern Oyster (Crassostrea virginica) and the Blue Mussel (Mytilus edulis): Temporal Variation and the Influence of Marine Aggregate-Associated Microbial Communities
- PMID: 31826972
- PMCID: PMC6908423
- DOI: 10.1128/mSphere.00730-19
Gut Microbiomes of the Eastern Oyster (Crassostrea virginica) and the Blue Mussel (Mytilus edulis): Temporal Variation and the Influence of Marine Aggregate-Associated Microbial Communities
Abstract
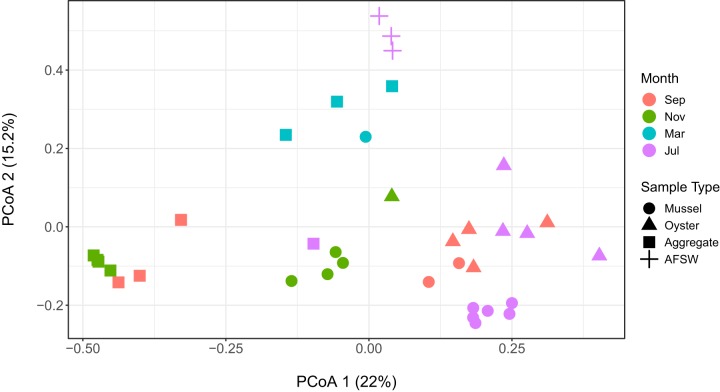
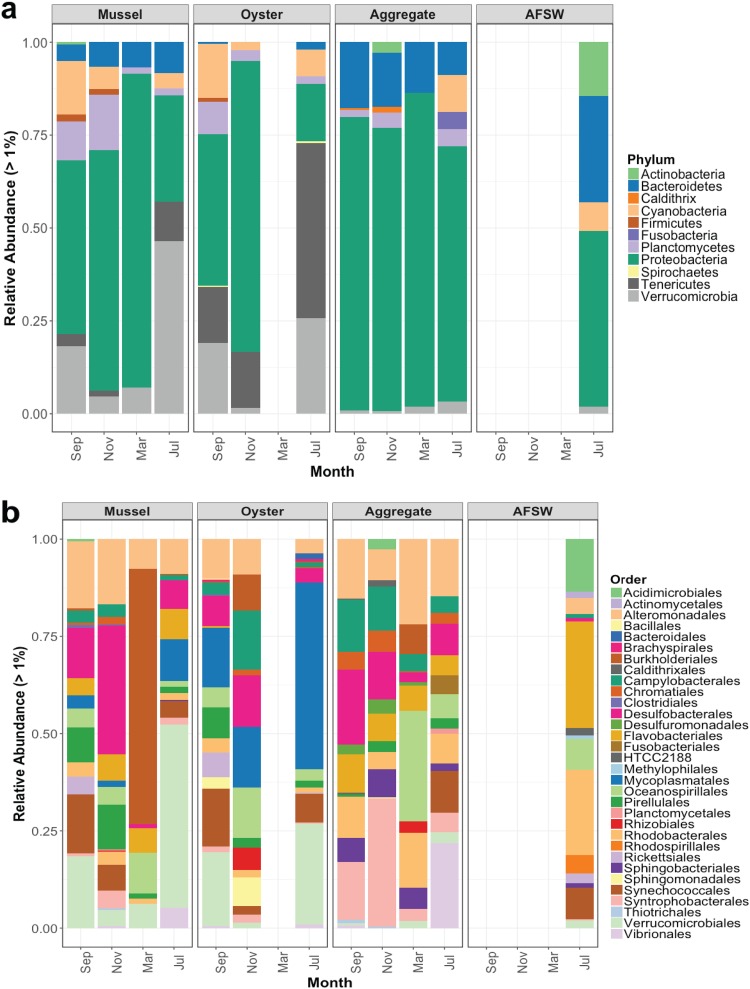
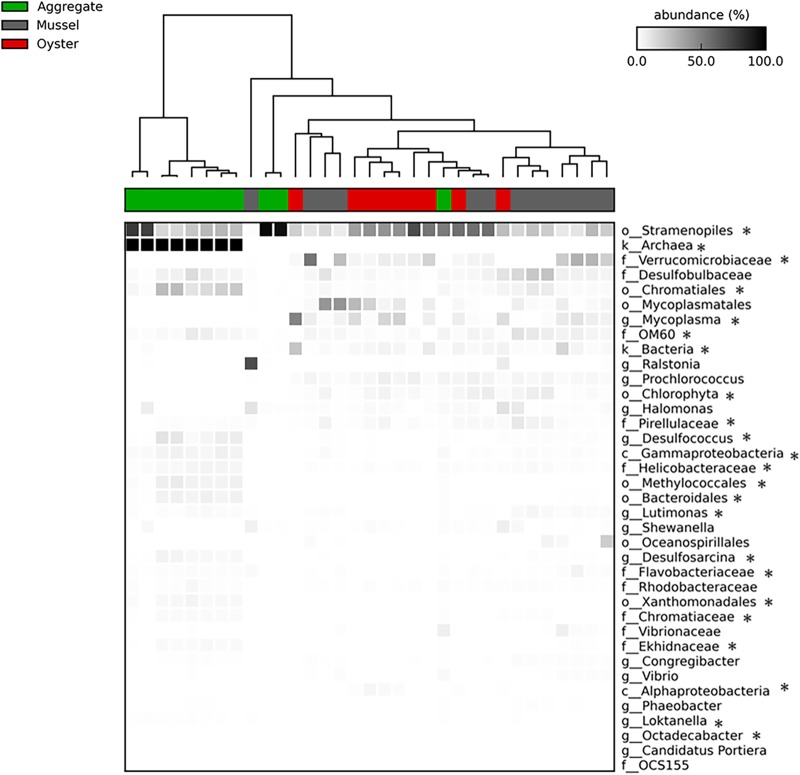
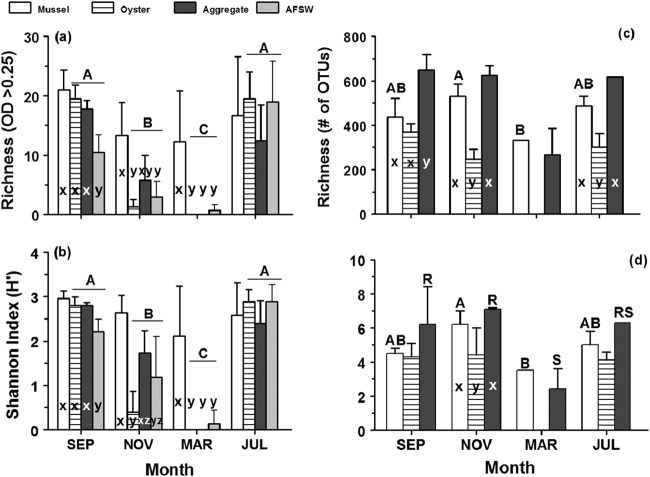
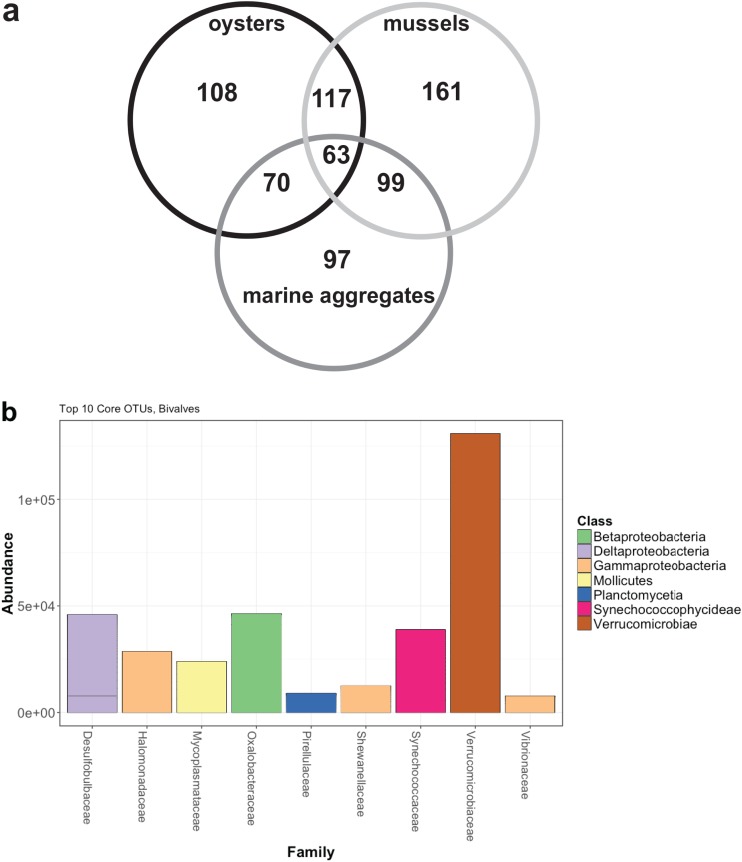
Gut microbial community structure was evaluated for two species of bivalve molluscs, the eastern oyster (Crassostrea virginica) and the blue mussel (Mytilus edulis) collected from Long Island Sound, Connecticut, over the course of a year. These bivalves utilize a shared feeding mechanism, which may result in similar gut microbial communities. Their particle diet, marine aggregates, and surrounding environment, aggregate-free seawater (AFSW), were also collected for comparison. Due to the suspension-feeding activities of bivalves, the potential for aggregate- and AFSW-associated microbiota to influence their microbial communities may be significant. Both taxonomic and functional diversity of the samples were assessed. 16S rRNA gene amplicon sequencing indicated that oysters and mussels maintained similar, but not identical, gut microbiomes, with some temporal variation. Throughout the year, bivalve species had gut microbial community compositions that were more similar to one another than to aggregates. Within a month, bivalves shared on average a quarter of their total operational taxonomic units (OTUs) with each other and a 10th of their total OTUs with aggregates. During months with warm water temperatures, individuals within each of the four sample types had similar alpha diversity, but again, temporal variation was observed. On a functional level, bivalve gut microbial communities exhibited variation attributed to host species and season. Unlike oysters, mussel gut bacterial communities maintained high richness and evenness values throughout the year, even when values for the particle diet and AFSW were reduced. Overall, a core gut bivalve microbiome was present, and it was partially influenced by the marine aggregate microbial community.IMPORTANCE This work investigates the influence that extrinsic factors, diet, and the environment can have on the microbiomes of shellfish. Over the course of a year, the gut microbial communities of two species of bivalves, oysters and mussels, held under identical conditions in coastal marine waters were compared. While the mussels and oysters harbored gut microbial communities with similar composition, on a functional level, they exhibited species and temporal variation. These results indicate that intrinsic factors influence the bivalve microbiome, resulting in species variability, even when environmental conditions, feeding mechanism, and particle diet are constant. Seasonal and multispecies comparisons for bivalve-associated microbial communities are rare, and we believe this research represents an important contribution. The results presented here advance our understanding of the symbiotic interactions between marine invertebrates, the microbial communities they harbor, and the environment.
Keywords: 16S rRNA gene; aggregate; bacteria; bivalve; gut; microbiome; mussel; oyster.
Copyright © 2019 Pierce and Ward.
Figures
Similar articles
-
Microbiome Analysis Reveals Diversity and Function of Mollicutes Associated with the Eastern Oyster, Crassostrea virginica.mSphere. 2021 May 12;6(3):e00227-21. doi: 10.1128/mSphere.00227-21. mSphere. 2021. PMID: 33980678 Free PMC article.
-
Host Species and Environment Shape the Gut Microbiota of Cohabiting Marine Bivalves.Microb Ecol. 2023 Oct;86(3):1755-1772. doi: 10.1007/s00248-023-02192-z. Epub 2023 Feb 22. Microb Ecol. 2023. PMID: 36811710 Free PMC article.
-
Comparative 16SrDNA Gene-Based Microbiota Profiles of the Pacific Oyster (Crassostrea gigas) and the Mediterranean Mussel (Mytilus galloprovincialis) from a Shellfish Farm (Ligurian Sea, Italy).Microb Ecol. 2018 Feb;75(2):495-504. doi: 10.1007/s00248-017-1051-6. Epub 2017 Aug 12. Microb Ecol. 2018. PMID: 28803409
-
Vibrio-bivalve interactions in health and disease.Environ Microbiol. 2020 Oct;22(10):4323-4341. doi: 10.1111/1462-2920.15055. Epub 2020 Jun 8. Environ Microbiol. 2020. PMID: 32363732 Review.
-
Shellfish and residual chemical contaminants: hazards, monitoring, and health risk assessment along French coasts.Rev Environ Contam Toxicol. 2011;213:55-111. doi: 10.1007/978-1-4419-9860-6_3. Rev Environ Contam Toxicol. 2011. PMID: 21541848 Review.
Cited by
-
Gut Microbiomes of Freshwater Mussels (Unionidae) Are Taxonomically and Phylogenetically Variable across Years but Remain Functionally Stable.Microorganisms. 2021 Feb 16;9(2):411. doi: 10.3390/microorganisms9020411. Microorganisms. 2021. PMID: 33669471 Free PMC article.
-
Characterizing the cirri and gut microbiomes of the intertidal barnacle Semibalanus balanoides.Anim Microbiome. 2020 Nov 13;2(1):41. doi: 10.1186/s42523-020-00058-0. Anim Microbiome. 2020. PMID: 33499976 Free PMC article.
-
Comparative evaluation of specimen type and processing conditions for studying oyster microbiomes.Front Microbiol. 2025 Jan 8;15:1504487. doi: 10.3389/fmicb.2024.1504487. eCollection 2024. Front Microbiol. 2025. PMID: 39845046 Free PMC article.
-
Direct Comparison of Fecal and Gut Microbiota in the Blue Mussel (Mytilus edulis) Discourages Fecal Sampling as a Proxy for Resident Gut Community.Microb Ecol. 2021 Jan;81(1):180-192. doi: 10.1007/s00248-020-01553-2. Epub 2020 Jul 7. Microb Ecol. 2021. PMID: 32638043
-
Bivalve microbiomes are shaped by host species, size, parasite infection, and environment.PeerJ. 2024 Oct 8;12:e18082. doi: 10.7717/peerj.18082. eCollection 2024. PeerJ. 2024. PMID: 39399422 Free PMC article.
References
Publication types
MeSH terms
Substances
LinkOut - more resources
Full Text Sources
