. 2019 Dec 11;10(1):5649.
doi: 10.1038/s41467-019-13542-2.

Mutant p53 drives clonal hematopoiesis through modulating epigenetic pathway

Affiliations

Mutant p53 drives clonal hematopoiesis through modulating epigenetic pathway

Sisi Chen et al. Nat Commun. .

Erratum in

  • Author Correction: Mutant p53 drives clonal hematopoiesis through modulating epigenetic pathway.
    Chen S, Wang Q, Yu H, Capitano ML, Vemula S, Nabinger SC, Gao R, Yao C, Kobayashi M, Geng Z, Fahey A, Henley D, Liu SZ, Barajas S, Cai W, Wolf ER, Ramdas B, Cai Z, Gao H, Luo N, Sun Y, Wong TN, Link DC, Liu Y, Boswell HS, Mayo LD, Huang G, Kapur R, Yoder MC, Broxmeyer HE, Gao Z, Liu Y. Chen S, et al. Nat Commun. 2020 Jul 28;11(1):3856. doi: 10.1038/s41467-020-17555-0. Nat Commun. 2020. PMID: 32724180 Free PMC article.

Abstract

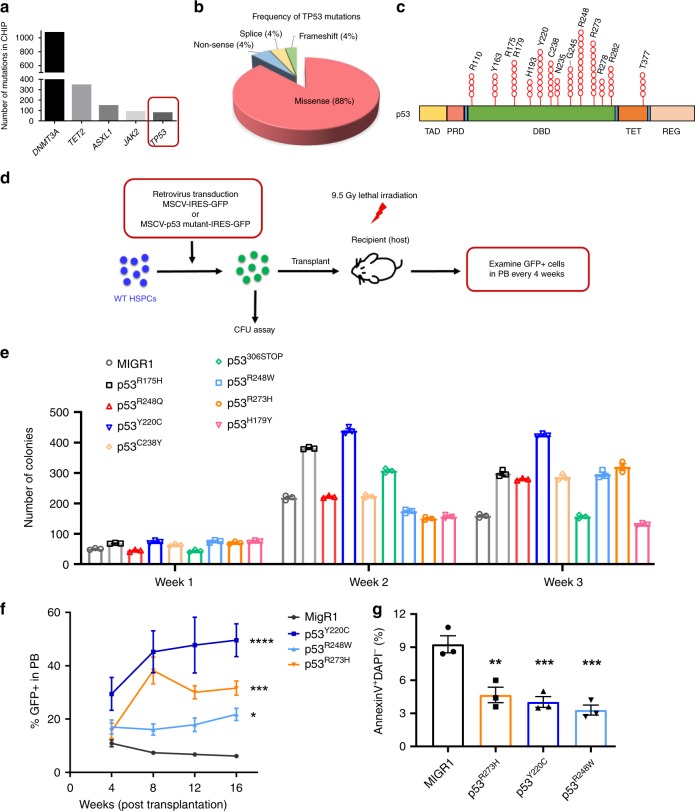
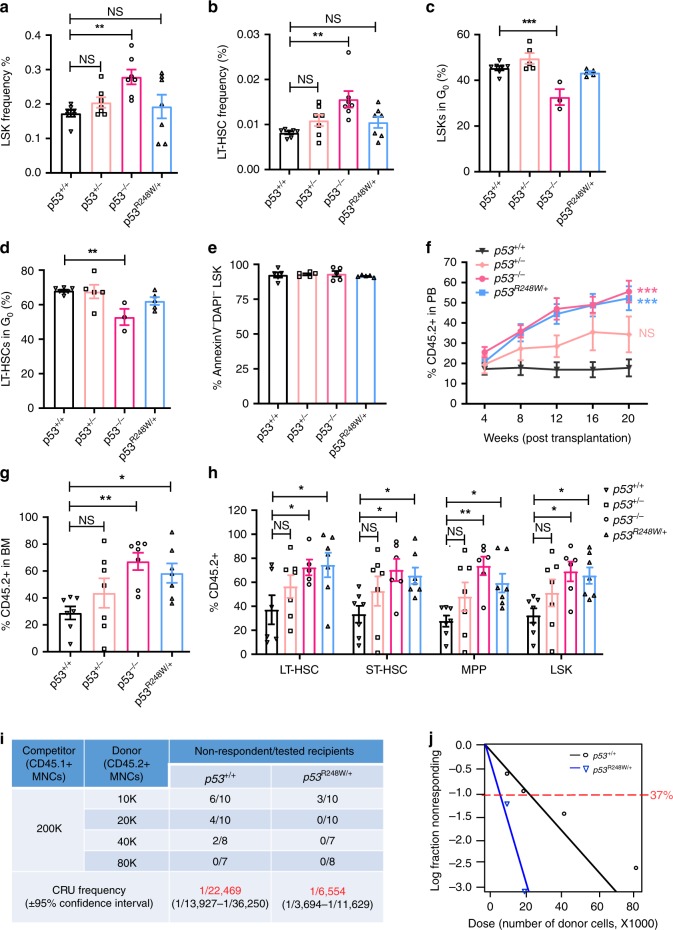
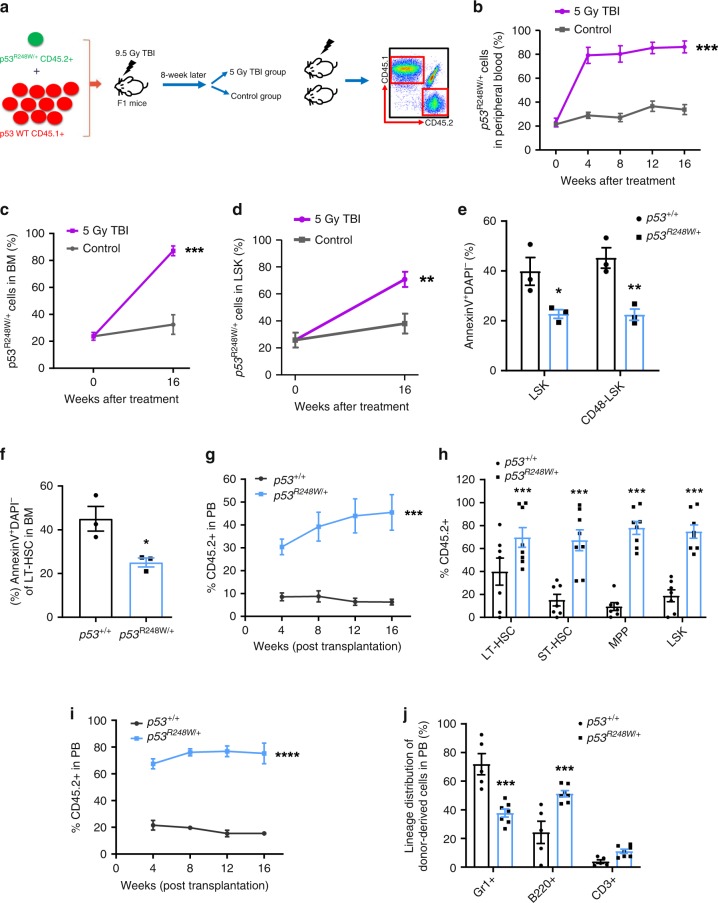
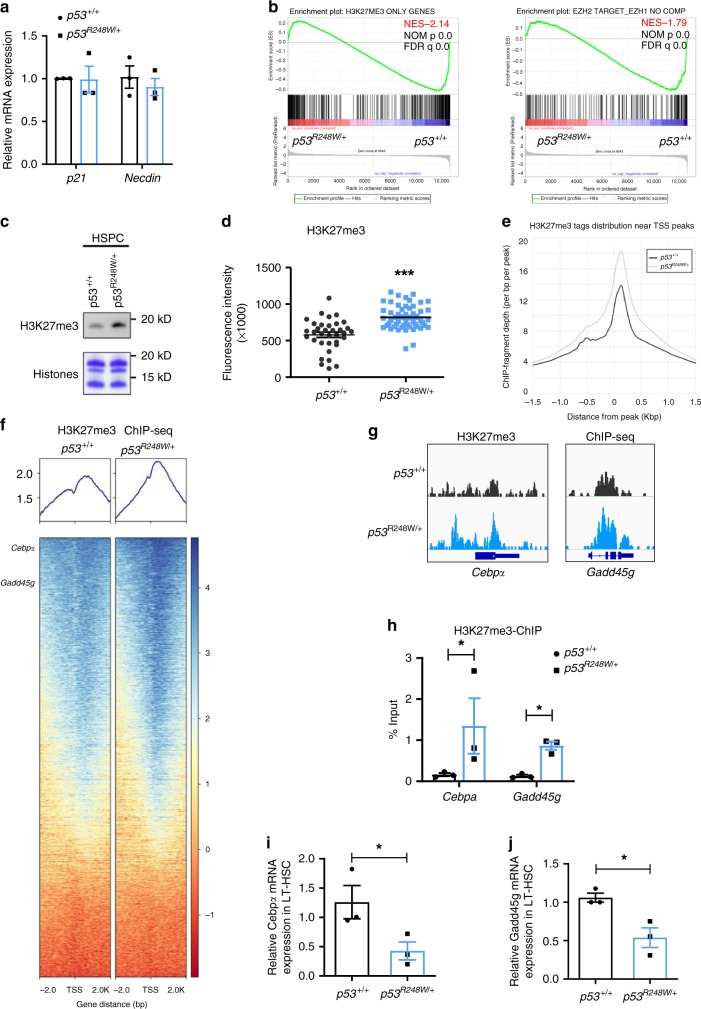
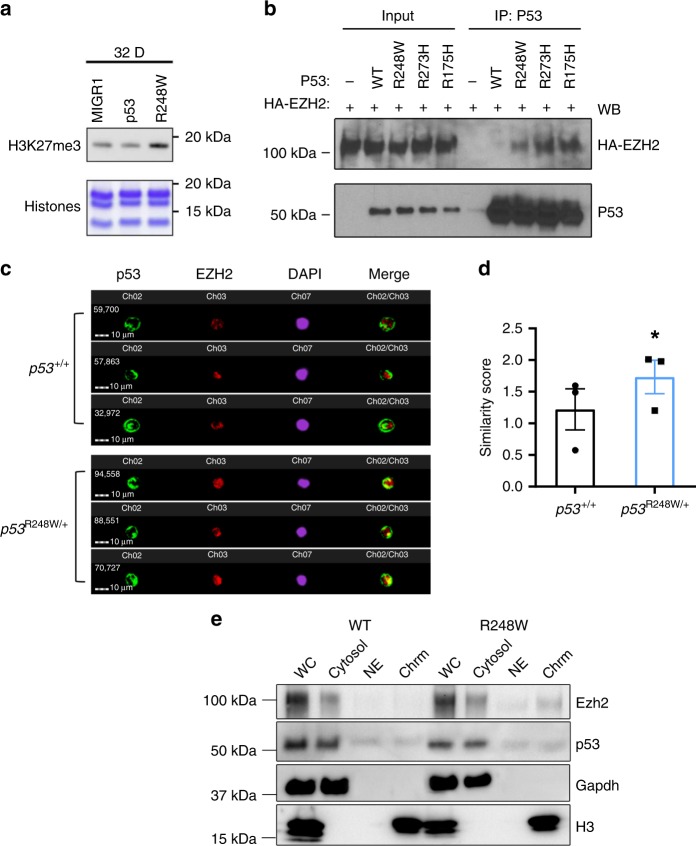
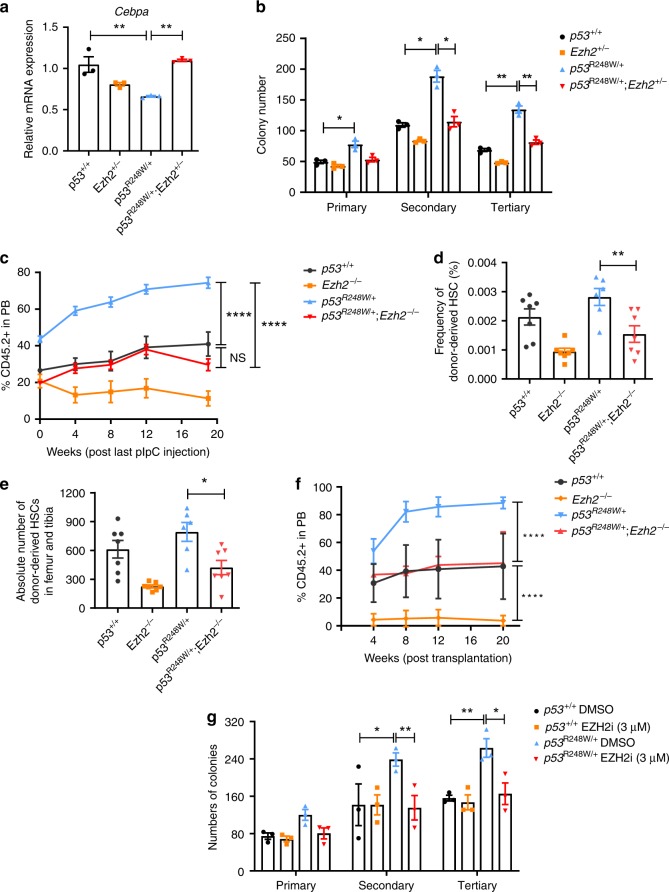
Clonal hematopoiesis of indeterminate potential (CHIP) increases with age and is associated with increased risks of hematological malignancies. While TP53 mutations have been identified in CHIP, the molecular mechanisms by which mutant p53 promotes hematopoietic stem and progenitor cell (HSPC) expansion are largely unknown. Here we discover that mutant p53 confers a competitive advantage to HSPCs following transplantation and promotes HSPC expansion after radiation-induced stress. Mechanistically, mutant p53 interacts with EZH2 and enhances its association with the chromatin, thereby increasing the levels of H3K27me3 in genes regulating HSPC self-renewal and differentiation. Furthermore, genetic and pharmacological inhibition of EZH2 decreases the repopulating potential of p53 mutant HSPCs. Thus, we uncover an epigenetic mechanism by which mutant p53 drives clonal hematopoiesis. Our work will likely establish epigenetic regulator EZH2 as a novel therapeutic target for preventing CHIP progression and treating hematological malignancies with TP53 mutations.


Conflict of interest statement

The authors declare no competing interests.

Figures

Fig. 1
Fig. 1. TP53 mutations identified in CHIP enhance HSPC repopulating potential.
a Tumor suppressor gene TP53 ranks in the top five among genes that were mutated in clonal hematopoiesis with indeterminate potential (CHIP). b Pie chart representing different types of TP53 mutations identified in CHIP. c TP53 mutations in CHIP are enriched in the DNA-binding domain (DBD) of the p53 protein. TAD, transactivation domain; PRD, proline-rich domain; DBD, DNA-binding domain; TET, tetramerization domain; and REG, carboxy-terminal regulatory domain. d Several hot-spot TP53 mutations identified in CHIP were introduced into wild-type hematopoietic stem and progenitor cells (HSPCs) using retrovirus-mediated transduction. In vitro and in vivo stem and progenitor cell assays were then performed using sorted GFP (green fluorescent protein)-postive cells. e Serial replating assays of HSPCs expressing different mutant p53 proteins. The methylcellulose cultures were serially replated, weekly, for 3 weeks; n = 3 independent experiments performed in duplicate. f Percentage of GFP+ cells in the peripheral blood (PB) of recipient mice following competitive transplantation; n = 3–5 mice per group. g HSPCs expressing mutant p53 proteins were assessed for apoptosis at 24 h after radiation (2 Gy); n = 3 independent experiments. Data are represented as mean ± SEM. P-values were calculated using two-way ANOVA (analysis of variance) with Dunnett’s multiple comparisons test in e and f, one-way ANOVA with Dunnett’s multiple comparisons test in g; *P < 0.05, **P < 0.01, ***P < 0.001, ****P < 0.0001. Source data are provided as a Source Data file.
Fig. 2
Fig. 2. p53R248W/+ confers a competitive advantage to HSPCs.
a The frequency of LinSca1+Kit+ cells (LSKs) in the bone marrow (BM) of p53+/+, p53+/−, p53−/−, and p53R248W/+ mice; n = 7 mice per genotype. b The frequency of long-term hematopoietic stem cells (LT-HSCs) in the BM of p53+/+, p53+/−, p53−/−, and p53R248W/+ mice; n = 7 mice per genotype. c The quiescence of LSKs was determined by Ki67 and DAPI (4′,6-diamidino-2-phenylindole) staining followed by flow cytometry analysis; n = 3–7 mice per genotype. d The quiescence of LT-HSCs was determined by Ki67 and DAPI staining and flow cytometry analysis; n = 3–7 mice per genotype. e The apoptosis of LSKs was determined by Annexin V and DAPI staining and flow cytometry analysis; n = 5 mice per genotype. f Percentage of donor-derived cells in PB of recipient mice at 20 weeks following HSC transplantation; n = 7 mice per group. g Percentage of donor-derived cells in the BM of recipient mice at 20 weeks following HSC transplantation; n = 7 mice per group. h Percentage of donor-derived LT-HSCs, short-term hematopoietic stem cells (ST-HSCs), multi-potent progenitors (MPPs), and LSKs in the BM of recipient mice repopulated with p53+/+, p53+/−, p53−/−, or p53R248W/+ HSCs; n = 7 mice per genotype. i Measuring the number of functional HSCs in the BM of p53+/+ and p53R248W/+ mice utilizing limiting dilution transplantation assays. Recipients with <2% donor-derived cells in the peripheral blood were defined as non-respondent; n = 7–10 mice per group. P = 0.00114. j Poisson statistical analysis of data from Fig. 2i using L-Calc software. Shapes represent the percentage of negative mice for each dose of cells. Solid lines indicate the best-fit linear model for each dataset. Data are represented as mean ± SEM. P-values were calculated using one-way ANOVA with Dunnett’s multiple comparisons test in a, b, c, d, e, g, and h, two-way ANOVA with Dunnett’s multiple comparisons test in f, and χ2 test in i and j; *P < 0.05, **P < 0.01, ***P < 0.001. Source data are provided as a Source Data file.
Fig. 3
Fig. 3. p53R248W/+ confers a survival advantage to HSPCs after radiation.
a BM chimeras were generated by transplanting a 1:10 ratio of p53R248W/+ cells (CD45.2+) to p53+/+ cells (CD45.1+) into irradiated recipient mice (CD45.1+CD45.2+). After hematopoietic reconstitution (8 weeks), mice were treated with or without 5 gray (Gy) total body irradiation (TBI). b Percentage of p53R248W/+ (CD45.2+) cells in PB of recipient mice following TBI treatment; n = 7 mice per group. c Percentage of p53R248W/+ cells (CD45.2+) in the BM of recipient mice at 16 weeks following TBI treatment; n = 7 mice per group. d Percentage of p53R248W/+ LSK cells (CD45.2+) in the BM of recipient mice at 16 weeks following TBI treatment; n = 7 mice per group. e Hematopoietic stem and progenitor cells from p53+/+ and p53R248W/+ mice were assessed for apoptosis 2 h after 2 Gy TBI; n = 3 mice per group. f HSCs purified from the BM of p53+/+ and p53R248W/+ mice were treated with 2 Gy TBI and then assessed for apoptosis; n = 3 mice per group. g Competitive transplantation assays using BM cells isolated from p53+/+ and p53R248W/+ mice treated with 2 Gy TBI. Two hours following TBI, we isolated BM cells from irradiated mice and transplanted 500,000 live BM cells together with equal number of competitor BM cells into lethally irradiated recipient mice. The percentage of donor-derived cells in the PB of recipient mice; n = 7–8 mice per group. h Percentage of donor-derived LT-HSCs, ST-HSCs, MPPs, and LSK cells in the PB of the primary recipient mice 16 weeks following transplantation; n = 7–8 mice per group. i Contribution of p53+/+ and p53R248W/+ BM cells to recipient mouse PB in secondary transplantation assays; n = 5–7 mice per group. j Lineage contribution of donor-derived cells in the PB of secondary recipient mice 16 weeks following transplantation; n = 5–7 mice per group. Data are represented as mean ± SEM. P-values were calculated using two-way ANOVA with Bonferroni’s multiple comparisons test in b, e, g, i, and j, unpaired t-test with Welch’s correction in c, d, f, and h; *P < 0.05, **P < 0.01, ***P < 0.001, ****P < 0.0001. Source data are provided as a Source Data file.
Fig. 4
Fig. 4. EZH2 targets were significantly downregulated in p53 mutant HSPCs.
a Quantitative reverse transcription polymerase chain reaction (RT-PCR) analysis of mRNA levels of p53 target genes, including p21 and Necdin, in HSCs; n = 3 biological replicates. b Gene Set Enrichment Assays (GSEA) analysis shows that EZH2 targets were significantly downregulated in p53 mutant HSPC compared to p53+/+ HSPCs. c p53 mutant HSPCs display increased levels of H3K27me3 (trimethylation at lysine 27 of histone H3) determined by immuno-blot analysis. d Lineage depleted HSPCs were stained with SLAM (signaling lymphocyte activation molecule) surface markers (CD48 and CD150) before fixation. Median fluorescence intensity of H3K27me3 in p53+/+ and p53R248W/+ HSCs (LinSca1+Kit+CD48CD150+ cells) was detected by ImageStream flow cytometry analysis. p53+/+ n = 35 cells, p53R248W/+ n = 52 cells. e H3K27me3 ChIP-seq (chromatin immunoprecipitation sequencing) tag density in p53+/+ and p53R248W/+ HSPCs, centered on TSS (transcription start site). f Heat map shows genes in HSPCs marked by H3K27me3. g Genome browser views of H3K27me3 ChIP-seq profiles of Cebpα (CCAAT/enhancer-binding protein alpha) and Gadd45g (growth arrest and DNA-damage-inducible 45 gamma). h H3K27me3 enrichment on Cebpα and Gadd45g genes in p53+/+ and p53R248W/+ HSPCs were examined by H3K27me3-ChIP assays; n = 3 independent experiments. i Quantitative RT-PCR analysis of mRNA levels of Cebpα in p53+/+ and p53R248W/+ LT-HSCs; n = 3 biological replicates. j Quantitative RT-PCR analysis of mRNA levels of Gadd45g in p53+/+ and p53R248W/+ LT-HSCs; n = 3 biological replicates. Data are represented as mean ± SEM. P-values were calculated using unpaired t test with Welch’s correction in a and d, paired t-test in h, i, and j, and GSEA software in b; *P < 0.05, ***P < 0.001. Source data are provided as a Source Data file.
Fig. 5
Fig. 5. Mutant p53 enhances the association of EZH2 with the chromatin in HSPCs.
a 32D cells expressing mutant p53, but not wild-type (WT) p53, displayed increased levels of H3K27me3 as determined by immuno-blot analysis. b Several mutant p53 proteins, but not wild-type p53, show enhanced association with EZH2 as assayed by co-IP (co-immunoprecipitation) experiments. c Mutant p53 and EZH2 localization in HSPCs (LinSca1+Kit+CD150+) as determined by ImageStream flow cytometry analysis. d Quantification of p53 and Ezh2 co-localization in the nucleus of HSPCs (LinSca1+Kit+CD150+). A similarity feature determined the amount of overlay between p53 and Ezh2 within the DAPI mask. The higher the similarity score is, the more co-localized staining is within the nucleus; n = 3 biological replicates. e Cellular fractionation shows increased EZH2 association with the chromatin fraction in p53 mutant HSPCs. The absence of Gapdh (glyceraldehyde 3-phosphate dehydrogenase) and exclusive distribution of histone H3 in the chromatin fraction indicates no cross contamination between different cellular compartments. WC whole cell extract, Cyto cytosol, NE nuclear cytosol, Chrm chromatin. Data are represented as mean ± SEM. P-values were calculated using paired t-test in d; *P < 0.05. Source data are provided as a Source Data file.
Fig. 6
Fig. 6. Loss of EZH2 decreases the repopulating potential of p53 mutant HSPCs.
a Cebpα expression in p53+/+, Ezh2+/−, p53R248W/+, and p53R248W/+ Ezh2+/− HSPCs; n = 3 biological replicates. b Serial replating assays of BM cells from p53+/+, Ezh2+/−, p53R248W/+ and p53R248W/+ Ezh2+/− mice; n = 3 independent experiments. c Percentage of donor-derived cells in the PB of recipient mice at 20 weeks following pI:pC (polyinosinic:polycytidylic acid) treatment; n = 7 mice per group. d Percentage of donor-derived HSCs in the BM of recipient mice at 20 weeks following pI:pC treatment; n = 6–7 mice per group. e The absolute number of donor-derived HSCs in the BM of recipient mice at 20 weeks following pI:pC treatment; n = 6–7 mice per group. f Percentage of donor-derived cells in the PB of recipient mice at 20 weeks following secondary transplantation; n = 7 mice per group. g Serial replating assays using p53+/+ and p53R248W/+ BM cells treated with DMSO (dimethyl sulfoxide) or EZH2 inhibitor (3 µM); n = 3 independent experiments. Data are represented as mean ± SEM. P-values were calculated using one-way ANOVA with Tukey’s multiple comparisons test in a, d, and e, two-way ANOVA with Tukey’s multiple comparison test in b, c, f, and g; *P < 0.05, **P < 0.01, ****P < 0.0001. Source data are provided as a Source Data file.

References

    1. Steensma DP, et al. Clonal hematopoiesis of indeterminate potential and its distinction from myelodysplastic syndromes. Blood. 2015;126:9–16. doi: 10.1182/blood-2015-03-631747. - DOI - PMC - PubMed
    1. Sperling AS, Gibson CJ, Ebert BL. The genetics of myelodysplastic syndrome: from clonal haematopoiesis to secondary leukaemia. Nat. Rev. Cancer. 2017;17:5–19. doi: 10.1038/nrc.2016.112. - DOI - PMC - PubMed
    1. Jan M, Ebert BL, Jaiswal S. Clonal hematopoiesis. Semin. Hematol. 2017;54:43–50. doi: 10.1053/j.seminhematol.2016.10.002. - DOI - PMC - PubMed
    1. Genovese G, et al. Clonal hematopoiesis and blood-cancer risk inferred from blood DNA sequence. N. Engl. J. Med. 2014;371:2477–2487. doi: 10.1056/NEJMoa1409405. - DOI - PMC - PubMed
    1. Jaiswal S, et al. Age-related clonal hematopoiesis associated with adverse outcomes. N. Engl. J. Med. 2014;371:2488–2498. doi: 10.1056/NEJMoa1408617. - DOI - PMC - PubMed

Publication types

MeSH terms