. 2019 Dec 11;10(1):5657.
doi: 10.1038/s41467-019-13527-1.

DNA methylation directs microRNA biogenesis in mammalian cells

Affiliations

DNA methylation directs microRNA biogenesis in mammalian cells

Ohad Glaich et al. Nat Commun. .

Abstract

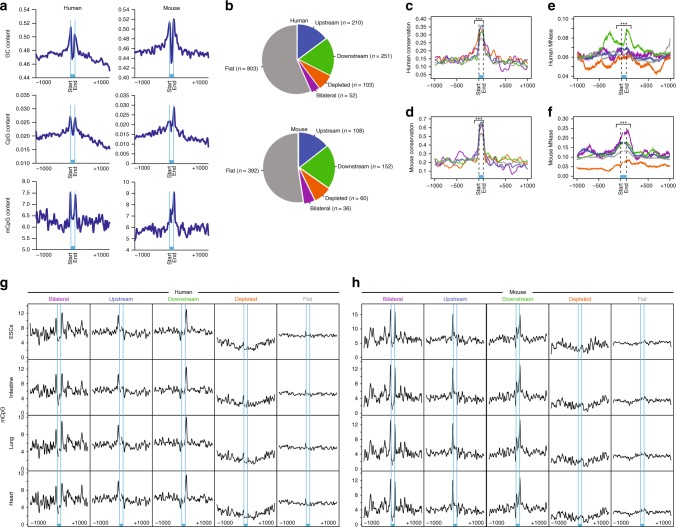
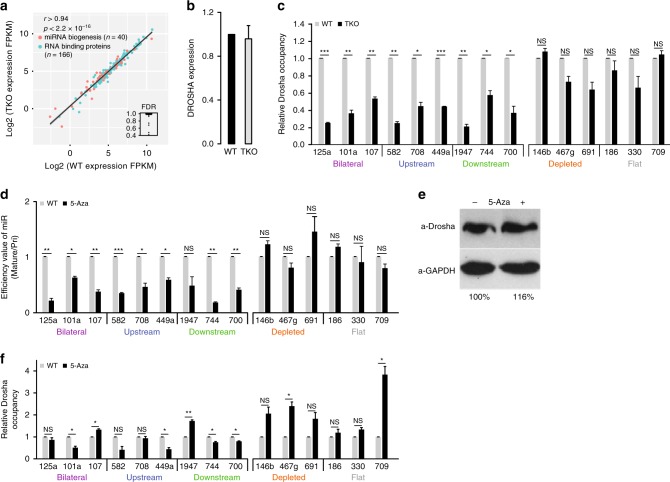
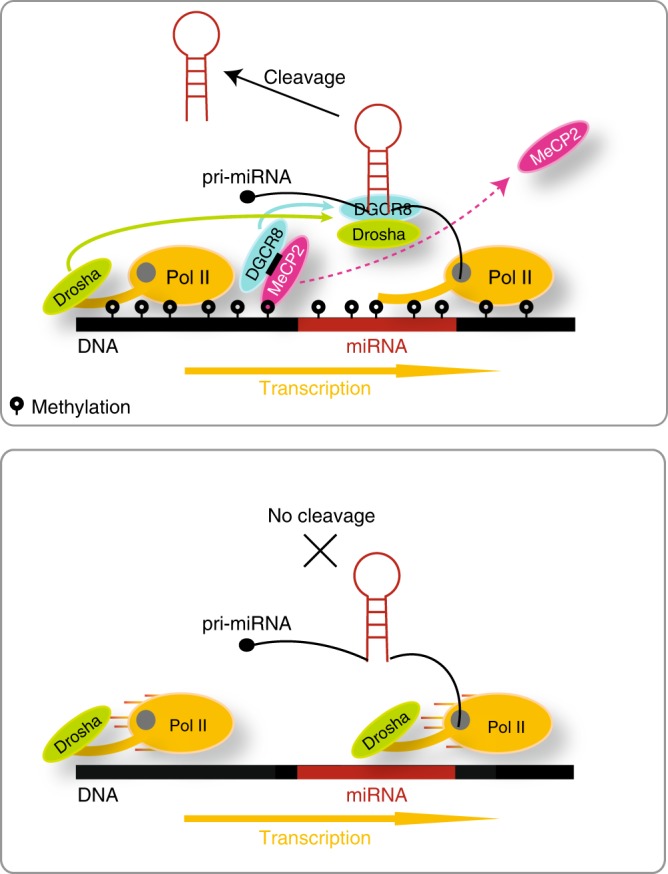
MicroRNA (miRNA) biogenesis initiates co-transcriptionally, but how the Microprocessor machinery pinpoints the locations of short precursor miRNA sequences within long flanking regions of the transcript is not known. Here we show that miRNA biogenesis depends on DNA methylation. When the regions flanking the miRNA coding sequence are highly methylated, the miRNAs are more highly expressed, have greater sequence conservation, and are more likely to drive cancer-related phenotypes than miRNAs encoded by unmethylated loci. We show that the removal of DNA methylation from miRNA loci leads to their downregulation. Further, we found that MeCP2 binding to methylated miRNA loci halts RNA polymerase II elongation, leading to enhanced processing of the primary miRNA by Drosha. Taken together, our data reveal that DNA methylation directly affects miRNA biogenesis.


Conflict of interest statement

The authors declare no competing interests.

Figures

Fig. 1
Fig. 1. Methylation marks the locations of pre-miRNA boundaries at the DNA level.
a GC content (upper panel), CpG content (middle panel), and methylated CpG content (lower panel) across 100 bp of miRNA-encoding sequence and an additional 1000 bp of the flanking regions for human and mouse. The miRNA location is indicated in light blue. b Pie charts illustrating the different methylation profiles found in human and mouse miRNA loci. c, d Plot of mean conservation scores across 100 bp of miRNA and additional 1000 bp of the flanking regions for c human and d mouse. To evaluate statistical significance the miRNA regions (100 bp) were tested against 100 bp of adjacent upstream regions. All t-tests were significant with ***p < 0.0001. e, f Plots show MNase-seq signal reflective of nucleosome occupancy across 100 bp of miRNA and additional 1000 bp of the flanking regions in (e) humans and (f) mouse. To evaluate statistical significance, miRNA regions (100 bp and an additional 50 bp of the adjacent upstream and downstream regions) of bilateral, upstream, and downstream groups were tested against depleted and flat groups. All t-tests were significant with ***p < 0.0001. g, h miRNA methylation profiles in (g) human and (h) mouse intestine, lung, heart, and embryonic stem cells.
Fig. 2
Fig. 2. DNA methylation affects miRNA biogenesis.
a Mean methylated CpG signal plotted across 100 bp of miRNA region and an additional 200 bp of the flanking regions for top and bottom quartiles of miRNA expression. The miRNA region (100 bp) and 25 flanking bp between the two groups were tested for statistical significance. ***p < 0.0001; t-test. b Quantification of DNMT genomic presence by PCR for WT and TKO mouse ESCs. GAPDH was used as the loading control. Source data are provided as a Source Data file. c NanoString microarray miRNA expression data in WT vs. TKO cells. Representative miRNAs used for validation are highlighted with open black circles. d Plot of the mean differences in mature miRNA expression in WT vs. TKO mouse ESCs. miRNA expression was compared between WT and TKO cells within each group and for all the methylated groups together using one-sided paired t-test. p-values are given above each bar. e Efficiency values, calculated as the level of mature miRNA divided by the level of pri-miRNA for the methylated miRNAs and unmethylated miRNAs in WT and TKO mouse ESCs. Data were normalized to RPLP0 for pri-miRNAs and U6 for mature miRNAs. Error bars represent ± SEM (n = 3). * represents p < 0.05; ** represents p < 0.01; NS = Not Significant; t-test. Source data are provided as a Source Data file. f Plot of differential gene expression (log2 FPKM of WT/TKO) vs. differential mature miRNA expression as measured by NanoString analysis. R- and p-values of Pearson’s product-moment correlation are given.
Fig. 3
Fig. 3. Drosha genomic occupancy is sensitive to DNA methylation.
a Plot of expression of transcripts encoding miRNA biogenesis proteins (n = 40) and other RNA-binding proteins (n = 166) in WT vs. TKO cells. R- and p-values of Pearson’s product-moment correlation are given. b Drosha mRNA levels in WT and TKO mouse ESCs quantified by qRT-PCR. Bars represent means of three independent experiments. Values were normalized to tubulin. c Relative Drosha occupancy over miRNA genomic regions in WT and TKO mouse ESCs determined by ChIP with an antibody against Drosha. Immunoprecipitated DNA was quantified by qRT-PCR with primers spanning the indicated pre-miRNA sequences. Data were normalized to input DNA. d Efficiency of miRNA biogenesis measured as the ratio of mature miRNA to pri-miRNA expression levels for the indicated miRNAs in WT mouse ESCs upon treatment with 2.5 µM 5-Aza relative to vehicle control. Data were normalized to RPLP0 for pri-miRNAs and RNU6 for mature miRNAs. e Drosha protein levels in untreated control WT mouse ESCs and cells treated with 2.5 µM 5-Aza. GAPDH was used as the loading control. f Relative Drosha occupancy over miRNA genomic regions in untreated WT mouse ESCs and cells treated with 2.5 µM 5-Aza determined by ChIP with an antibody against Drosha. Immunoprecipitated DNA was quantified by qRT-PCR with primers spanning the indicated pre-miRNA sequences of the methylated and unmethylated groups. Data were normalized to input DNA. All Error bars represent ± SEM (n = 3). * represents p < 0.05; ** represents p < 0.01; *** represents p < 0.001; NS = not significant; t-test. Source data are provided as a Source Data file.
Fig. 4
Fig. 4. MeCP2 binding at methylated miRNA loci slows Pol II allowing miRNAs biogenesis.
a Pol II-pSer2 occupancies for each group of miRNAs across 100 bp of miRNA region and 100 bp of the flanking regions. Regions upstream of the 5‘ ends of the pre-miRNAs between all methylated groups vs. the unmethylated groups were tested. All tests were statistically significant. ***p < 0.001; t-test. b Relative Pol II-pSer2 to Pol II-pSer5 (Ser2/Ser5) occupancies analyzed by ChIP over select miRNA regions in WT and TKO mouse ESCs. Immunoprecipitated DNA was quantified by qRT-PCR using primers spanning the indicated pre-miRNA sequences. Data were normalized to input DNA. c MeCP2 occupancies in regions upstream of start sites between all methylated groups vs. the two unmethylated groups were tested. All tests were statistically significant except for the test between the bilateral and the depleted groups. ***p < 0.001; t-test. d Relative MeCP2 occupancy over miRNA genomic regions in WT and TKO ESCs determined by ChIP analysis. Immunoprecipitated DNA was quantified by qRT-PCR using primers spanning the indicated pre-miRNA sequences. Data were normalized to input DNA. e SP1 occupancy for each group of miRNAs. The regions upstream of the start sites between all methylated groups vs. the unmethylated groups were tested. All tests were statistically significant. ***p < 0.001; t-test. f MeCP2 protein levels in WT mouse ESCs upon treatment with siMeCP2 or siControl. GAPDH was used as a loading control. g Efficiency values for the methylated miRNAs and unmethylated miRNAs from WT mouse ESCs upon treatment with siMeCP2 or siControl. Data were normalized to RPLP0 for pri-miRNAs and U6 for mature miRNAs. h Relative Pol II-pSer2 to Pol II-pSer5 (Ser2/Ser5) occupancy analyzed by ChIP in WT mouse ESCs upon treatment with siMeCP2 or siControl. Immunoprecipitated DNA was quantified by qRT-PCR. Data were normalized to input DNA. All error bars represent ± SEM (n = 3); * represents p < 0.05; ** represents p < 0.01; *** represents p < 0.001; NS = not significant; t-test. Source data are provided as a Source Data file.
Fig. 5
Fig. 5. A schematic model of DNA methylation-dependent miRNA processing.
Top: MeCP2 binds DGCR8 and slows Pol II elongation. This provides an opportunity for Drosha and DGCR8 to interact with the nascent pri-miRNA. Bottom: In the absence of DNA methylation Pol II-mediated elongation is rapid, and Drosha is unable to bind to the nascent pri-miRNAs.

References

    1. Bell RE, Levy C. The three M’s: melanoma, microphthalmia-associated transcription factor and microRNA. Pigment Cell Melanoma Res. 2011;24:1088–1106. doi: 10.1111/j.1755-148X.2011.00931.x. - DOI - PubMed
    1. Voorhoeve PM, Agami R. Classifying microRNAs in cancer: the good, the bad and the ugly. Biochim. Biophys. Acta. 2007;1775:274–282. - PubMed
    1. Filipowicz W, Bhattacharyya SN, Sonenberg N. Mechanisms of post-transcriptional regulation by microRNAs: are the answers in sight? Nat. Rev. Genet. 2008;9:102–114. doi: 10.1038/nrg2290. - DOI - PubMed
    1. Bartel DP. MicroRNAs: genomics, biogenesis, mechanism, and function. Cell. 2004;116:281–297. doi: 10.1016/S0092-8674(04)00045-5. - DOI - PubMed
    1. Kim VN. MicroRNA biogenesis: coordinated cropping and dicing. Nat. Rev. Mol. Cell Biol. 2005;6:376–385. doi: 10.1038/nrm1644. - DOI - PubMed

Publication types

LinkOut - more resources