. 2019 Dec 11;10(1):5648.
doi: 10.1038/s41467-019-13540-4.

The autophagy receptor p62/SQST-1 promotes proteostasis and longevity in C. elegans by inducing autophagy

Affiliations

The autophagy receptor p62/SQST-1 promotes proteostasis and longevity in C. elegans by inducing autophagy

Caroline Kumsta et al. Nat Commun. .

Abstract

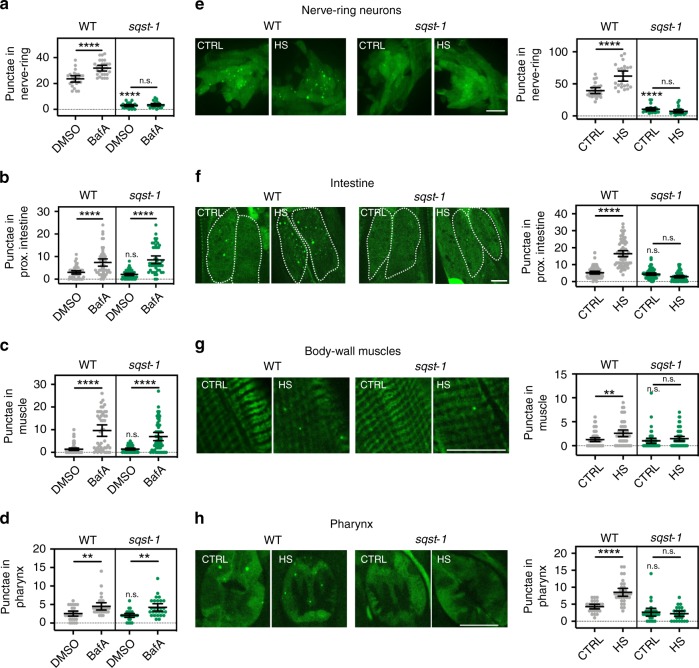
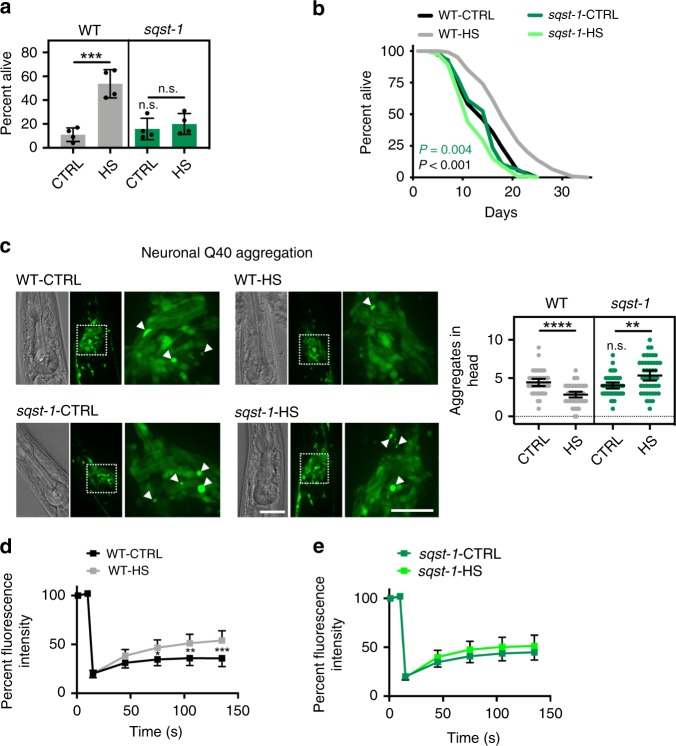
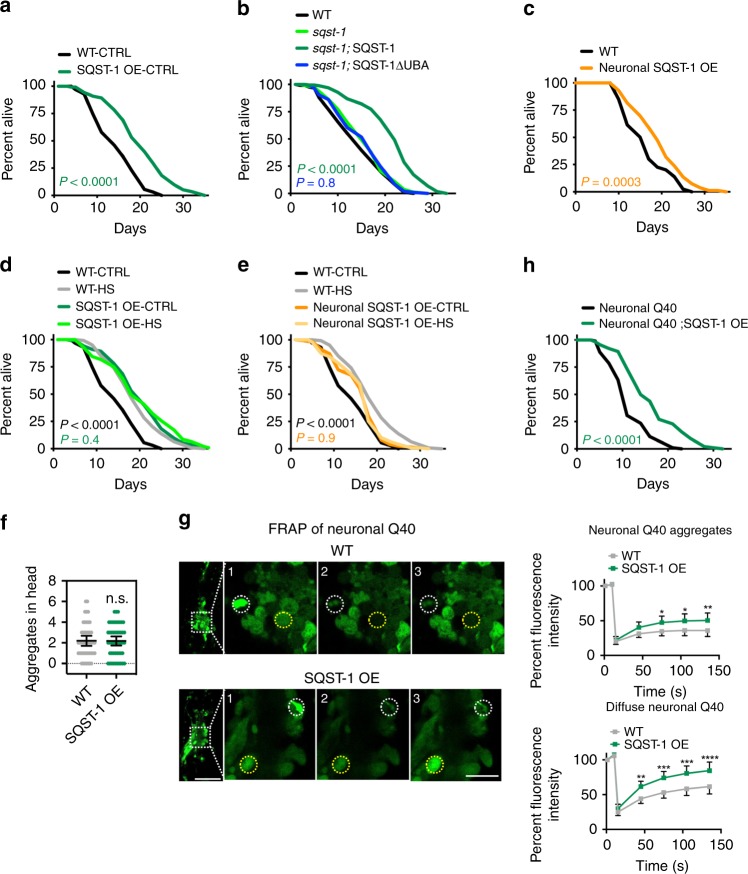
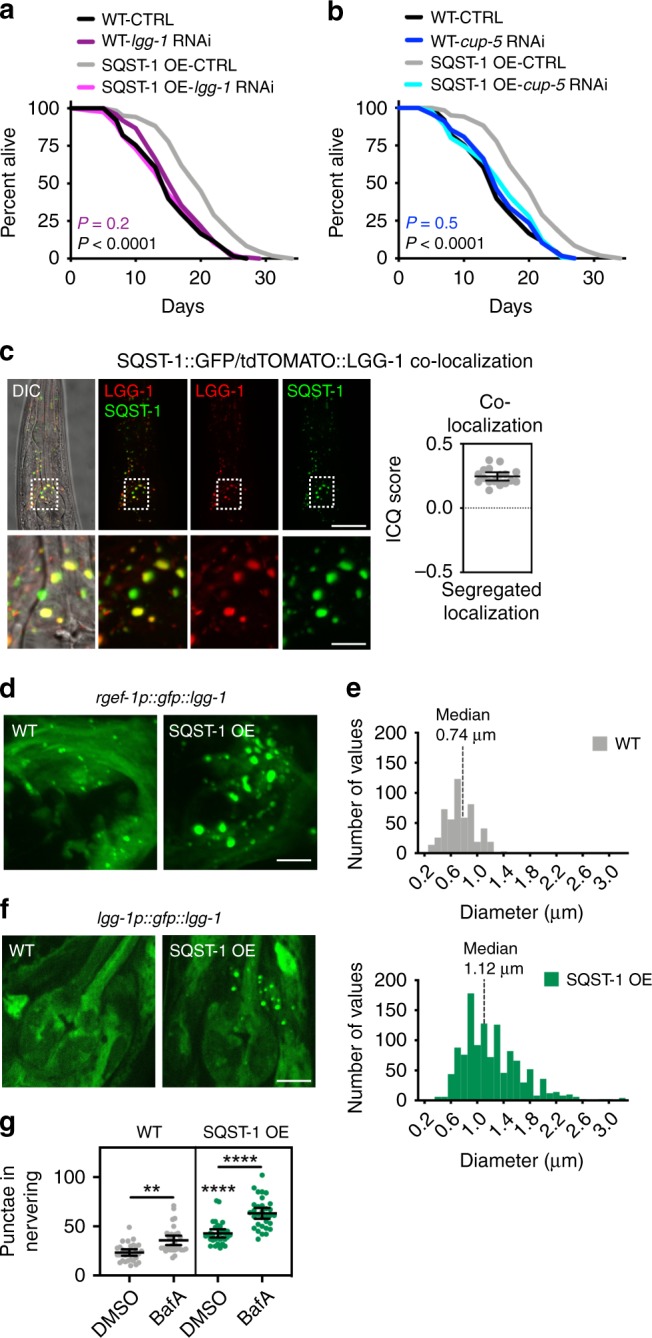
Autophagy can degrade cargos with the help of selective autophagy receptors such as p62/SQSTM1, which facilitates the degradation of ubiquitinated cargo. While the process of autophagy has been linked to aging, the impact of selective autophagy in lifespan regulation remains unclear. We have recently shown in Caenorhabditis elegans that transcript levels of sqst-1/p62 increase upon a hormetic heat shock, suggesting a role of SQST-1/p62 in stress response and aging. Here, we find that sqst-1/p62 is required for hormetic benefits of heat shock, including longevity, improved neuronal proteostasis, and autophagy induction. Furthermore, overexpression of SQST-1/p62 is sufficient to induce autophagy in distinct tissues, extend lifespan, and improve the fitness of mutants with defects in proteostasis in an autophagy-dependent manner. Collectively, these findings illustrate that increased expression of a selective autophagy receptor is sufficient to induce autophagy, enhance proteostasis and extend longevity, and demonstrate an important role for sqst-1/p62 in proteotoxic stress responses.


Conflict of interest statement

The authors declare no competing interests.

Figures

Fig. 1
Fig. 1
sqst-1 is required for autophagy induction after hormetic heat shock (HS). ad Autophagy flux was measured at 20 °C in WT and sqst-1(ok2892) (sqst-1) animals on day 1 of adulthood expressing rgef-1p::gfp::lgg-1 (a) or lgg-1p::gfp::lgg-1 (bd). WT and sqst-1 animals were injected with vehicle (DMSO) or bafilomycin A1 (BafA) to block autophagy at the lysosomal acidification step. GFP::LGG-1/Atg8-positive punctae were quantified from three independent experiments in a nerve-ring neurons (WT-DMSO, N = 25; WT-BafA, N = 28; sqst-1-DMSO, N = 25, sqst-1-BafA, N = 24 animals), b proximal intestinal cells (WT-DMSO, N = 49; WT-BafA, N = 50; sqst-1-DMSO, N = 55, sqst-1-BafA, N = 46 cells), c body-wall muscle (WT-DMSO, N = 71; WT-BafA, N = 44; sqst-1-DMSO, N = 48, sqst-1-BafA, N = 53 animals), and d and the terminal pharyngeal bulb (WT-DMSO, N = 28; WT-BafA, N = 29; sqst-1-DMSO, N = 28, sqst-1-BafA, N = 27 animals), Error bars indicate 95% CI. ns: P > 0.05, **P < 0.01, ****P < 0.0001, by two-way ANOVA with Tukey’s multiple comparisons test. eh GFP::LGG-1/Atg8-positive punctae were counted in WT and sqst-1(ok2892) (sqst-1) animals on day 1 of adulthood expressing rgef-1p::gfp::lgg-1 (e) or lgg-1p::gfp::lgg-1 (fh). Animals were maintained under control conditions 15 °C (CTRL) or subjected to HS for 1 h at 36 °C (HS). Animals were imaged at time of highest induction in autophagy as previously characterized. GFP::LGG-1/Atg8 punctae were quantified from three independent experiments in e nerve-ring neurons (WT-CTRL, N = 24; WT-HS, N = 23; sqst-1-CTRL, N = 23, sqst-1-HS, N = 24 animals) with 2 h of recovery after HS, f proximal intestinal cells (WT-CTRL, N = 67; WT-HS, N = 70; sqst-1-CTRL, N = 66, sqst-1-HS, N = 71 cells) with 4 h of recovery after HS, g body-wall muscle (WT-CTRL, N = 60; WT-HS, N = 48; sqst-1-CTRL, N = 50, sqst-1-HS, N = 60 animals) (no recovery), and h terminal pharyngeal bulb (WT-CTRL, N = 26; WT-HS, N = 32; sqst-1-CTRL, N = 26, sqst-1-HS, N = 25 animals) with 4 h of recovery after HS. Error bars indicate 95% CI. ns: P > 0.05, **P < 0.01, ****P < 0.0001, by two-way ANOVA with Tukey’s multiple comparisons test. Scale bar: 10 μm. Source data are provided in the Source Data file.
Fig. 2
Fig. 2
sqst-1 is required for the organismal benefits of a hormetic heat shock (HS). a Survival of WT (N2) and sqst-1(ok2892) (sqst-1) animals subjected to HS on day 1 of adulthood, and then incubated for 7 h at 36 °C on day 3 of adulthood (n = 4 plates). Error bars indicate SD, ns: P > 0.8, ***P < 0.001 by two-way ANOVA with Tukey’s multiple comparisons test. See Supplementary Table 1 for experimental details and additional repeats. b Lifespan analysis of WT and sqst-1(ok2892) (sqst-1) animals at 20 °C subjected to 1h HS at 36 °C on day 1 of adulthood. WT-CTRL animals (N = 126) compared with WT-HS animals (N = 110): P < 0.0001; sqst-1-CTRL animals (N = 128) (P = 0.3 to WT) compared with sqst-1-HS animals (N = 115): P = 0.004, by log-rank test. See Supplementary Table 2 for experimental details and additional repeats. c Neuronal PolyQ (rgef-1p::Q40::yfp) aggregates detected on day 4 of adulthood in WT and sqst-1(ok2892) (sqst-1) animals maintained under control conditions (20 °C, CTRL) or subjected to HS (1 h at 36 °C) on day 1 of adulthood (HS). Scale bar 20 μm. The number of neuronal PolyQ aggregates were quantified from three independent experiments in WT-CTRL, N = 43; WT-HS, N = 50; sqst-1-CTRL, N = 48, sqst-1-HS, N = 45 animals. Error bars indicate 95% CI. ns: P > 0.6, **P < 0.01, ****P < 0.0001, by two-way ANOVA with Tukey’s multiple comparisons test. Scale bar 20 and 10 μm for close-up. d, e FRAP measurements of neuronal PolyQ (rgef-1p::Q40::yfp) aggregates on day 8 of adulthood in WT (e) and sqst-1(ok2892) (sqst-1) (f) animals maintained under control conditions (20 °C, CTRL) or subjected to HS (1 h at 36 °C) on day 1 of adulthood (HS). The fluorescence signal was bleached after 20 s and fluorescence recovery was measured for 2 min. The average % of fluorescence intensity was quantified from three independent experiments in WT-CTRL, N = 32; WT-HS, N = 30; sqst-1-CTRL, N = 32, sqst-1-HS, N = 31 animals. Error bars indicate 95% CI. **P < 0.05, **P < 0.01, ***P < 0.001, by two-way ANOVA with Sidak’s multiple comparisons test. P > 0.05 for all timepoints when comparing WT-CTRL and sqst-1-CTRL by two-way ANOVA with Sidak’s multiple comparisons test. Source data are provided in the Source Data file.
Fig. 3
Fig. 3
SQST-1 overexpression extends C. elegans lifespan and improves proteostasis. a Lifespan analysis of WT (N2) (N = 58 animals) and SQST-1 OE (sqst-1p::sqst-1::gfp (1)) (N = 88 animals) animals at 20 °C: P-value by log-rank test. b Lifespan analysis of WT (N2) (N = 92 animals), sqst-1(syb764) (N = 88 animals), and sqst-1(syb764) animals expressing either sqst-1p::sqst-1 + rol-6 (sqst-1; SQST-1) (N = 124 animals) or sqst-1p::sqst-1ΔUBA + rol-6 (sqst-1; SQST-1ΔUBA) (N = 107 animals) at 20 °C. P-values by log-rank test. c Lifespan analysis of WT (N2) (N = 85 animals) and neuronal SQST-1 OE (rgef-1p::sqst-1::gfp (1)) (N = 85 animals) animals at 20 °C. P-value by log-rank test. d Lifespan analysis of WT (N2) and SQST-1 OE (sqst-1p::sqst-1::gfp (1)) animals subjected to hormetic HS on day 1 of adulthood. WT-CTRL, N = 126; WT-HS, N = 111; SQST-1 OE-CTRL, N = 116, SQST-1 OE-HS, N = 106 animals at 20 °C. P-values by log-rank test. e Lifespan analysis of WT (N2) and neuronal SQST-1 OE (rgef-1p::sqst-1::gfp (1)) animals subjected to hormetic HS on day 1 of adulthood. WT-CTRL, N = 126; WT-HS, N = 111; Neuronal SQST-1 OE-CTRL, N = 123, SQST-1 OE-HS, N = 120 animals at 20 °C. P-values by log-rank test. ae See Supplementary Data 2 and Table 3 for experimental repeats. f Quantification of neuronal PolyQ aggregates (rgef-1p::Q40::yfp) on day 5 of adulthood from three independent experiments in WT (N = 31 animals) and SQST-1 OE animals (sqst-1p::sqst-1 + rol-6) (N = 30 animals). Error bars indicate 95% CI. ns: P > 0.05 by t-test. g Fluorescence images and FRAP measurements of the aggregated (white dashed circles) and diffuse (yellow dashed circles) portion of neuronal PolyQ (rgef-1p::Q40::yfp) on day 8 of adulthood in WT and SQST-1-overexpressing animals sqst-1p::sqst-1 + rol-6 (SQST-1 OE) at 20 °C. Fluorescence signal bleached after 10 s (timepoint 2) and fluorescence recovery was measured for 2 min. The average % of fluorescence intensity was quantified from three independent experiments in WT, N = 32; SQST-1 OE, N = 31. Image numbers correspond to the indicated timepoints. Error bars indicate 95% CI. All measurements are P > 0.05 by two-way ANOVA with Sidak’s multiple comparisons test unless indicated otherwise *P < 0.05, **P < 0.01, ***P < 0.001, ****P < 0.0001. Outline of pharyngeal bulbs in image of head region. Scale bar: 20 and 10 μm for close-up. h Lifespan analysis of Neuronal Q40-expressing animals (rgef-1p::Q40::yfp) (N = 39 animals) and Neuronal Q40; SQST-1 OE (rgef-1p::Q40::yfp; sqst-1p::sqst-1 + rol-6) (N = 79 animals) at 20 °C. P-value by log-rank test. See Supplementary Table 4 for experimental repeats. Source data are provided in the Source Data file.
Fig. 4
Fig. 4
SQST-1 overexpression induces neuronal autophagy. a, b Lifespan analysis of WT and sqst-1p::sqst-1::gfp (SQST-1 OE) animals at 20 °C subjected to bacteria expressing empty vector (CTRL) or dsRNA targeting autophagy genes (a) lgg-1/ATG8 and (b) cup-5 from day 1 of adulthood. WT-CTRL, N = 121; WT-lgg-1/ATG8 RNAi, N = 121; WT-cup-5 RNAi, N = 124; SQST-1 OE-CTRL, N = 108, SQST-1 OE-lgg-1/ATG8 RNAi, N = 116; SQST-1 OE-cup-5 RNAi, N = 129 animals. P-values by log-rank test. See Supplementary Data 3 for experimental repeats. c Colocalization of SQST-1 and LGG-1/Atg8 in the head region of animals expressing sqst-1p::sqst-1::gfp and lgg-1p::tdtomato::lgg-1. First panel is overlay of DIC (differential interference contrast) image and GFP (SQST-1) and tdTOMATO (LGG-1/Atg8) fluorescence. Second panel is overlay of GFP (SQST-1) and tdTOMATO (LGG-1/Atg8) fluorescence, followed by single fluorescent channels. Scale bar: 10 and 2.5 μm in close-up. Intensity correlation quotient (ICQ) values between 0 and 0.5 indicate colocalization and values between 0 and −0.5 indicate segregated fluorescence. ICQ score were quantified in entire head region from two independent experiments (N = 17 animals). Error bars indicate 95% CI. d GFP::LGG-1/Atg8-positive punctae in nerve-ring neurons of WT and SQST-1 OE (sqst-1p::sqst-1) animals on day 1 of adulthood expressing neuronal GFP::LGG-1 (rgef-1p::gfp::lgg-1). Scale bar: 10 μm. e Histogram of GFP::LGG-1/Atg8 structures binned by their diameter in nerve-ring neurons of WT (N = 519 GFP::LGG-1/Atg8 structures) and SQST-1 OE (N = 1196 GFP::LGG-1/Atg8 structures) animals with indicated median diameter. P < 0.0001 by Wilcoxon signed rank test. See Supplementary Table 5. f GFP::LGG-1/Atg8-positive punctae in nerve-ring neurons of WT and SQST-1 OE (sqst-1p::sqst-1) animals on day 1 of adulthood expressing GFP::LGG-1 under its endogenous promoter (lgg-1p::gfp::lgg-1). Scale bar: 10 μm. g Autophagy-flux measurements were performed at 20 °C in WT and SQST-1 OE animals on day 1 of adulthood expressing rgef-1p::gfp::lgg-1. WT and SQST-1 OE animals were injected with vehicle (DMSO) or bafilomycin A1 (BafA) to block autophagy at the lysosomal acidification step. GFP::LGG-1/Atg8-positive punctae were quantified from three independent experiments (WT-DMSO, N = 30; WT-BafA, N = 32; SQST-1 OE-DMSO, N = 31, SQST-1 OE-BafA, N = 32 animals). Error bars indicate 95% CI. **P < 0.01, ****P < 0.0001, by two-way ANOVA with Tukey’s multiple comparisons test. Source data for (a), (b), (c), (e), and (g) are provided in the Source Data file.

References

    1. Kroemer G, Marino G, Levine B. Autophagy and the integrated stress response. Mol. Cell. 2010;40:280–293. doi: 10.1016/j.molcel.2010.09.023. - DOI - PMC - PubMed
    1. Kumsta C, Chang JT, Schmalz J, Hansen M. Hormetic heat stress and HSF-1 induce autophagy to improve survival and proteostasis in C. elegans. Nat. Commun. 2017;8:14337. doi: 10.1038/ncomms14337. - DOI - PMC - PubMed
    1. Hansen M, Rubinsztein DC, Walker DW. Autophagy as a promoter of longevity: insights from model organisms. Nat. Rev. Mol. Cell Biol. 2018;19:579–593. doi: 10.1038/s41580-018-0033-y. - DOI - PMC - PubMed
    1. Gatica D, Lahiri V, Klionsky DJ. Cargo recognition and degradation by selective autophagy. Nat. Cell Biol. 2018;20:233–242. doi: 10.1038/s41556-018-0037-z. - DOI - PMC - PubMed
    1. Pankiv S, et al. p62/SQSTM1 binds directly to Atg8/LC3 to facilitate degradation of ubiquitinated protein aggregates by autophagy. J. Biol. Chem. 2007;282:24131–24145. doi: 10.1074/jbc.M702824200. - DOI - PubMed

Publication types