. 2019 Dec 11;9(1):18911.
doi: 10.1038/s41598-019-54849-w.

Improving the odds of drug development success through human genomics: modelling study

Affiliations

Improving the odds of drug development success through human genomics: modelling study

Aroon D Hingorani et al. Sci Rep. .

Abstract

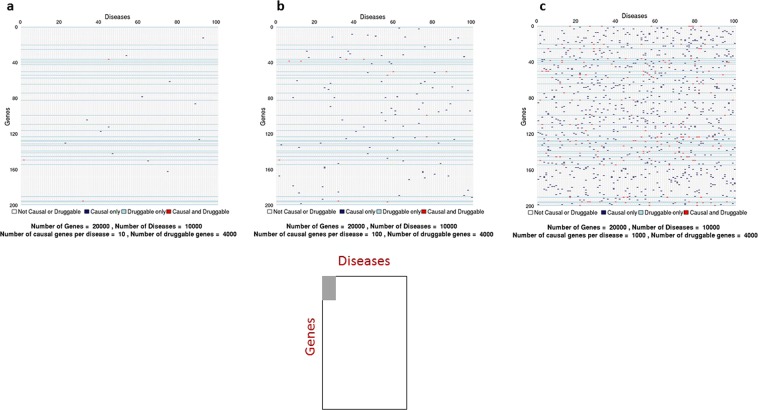
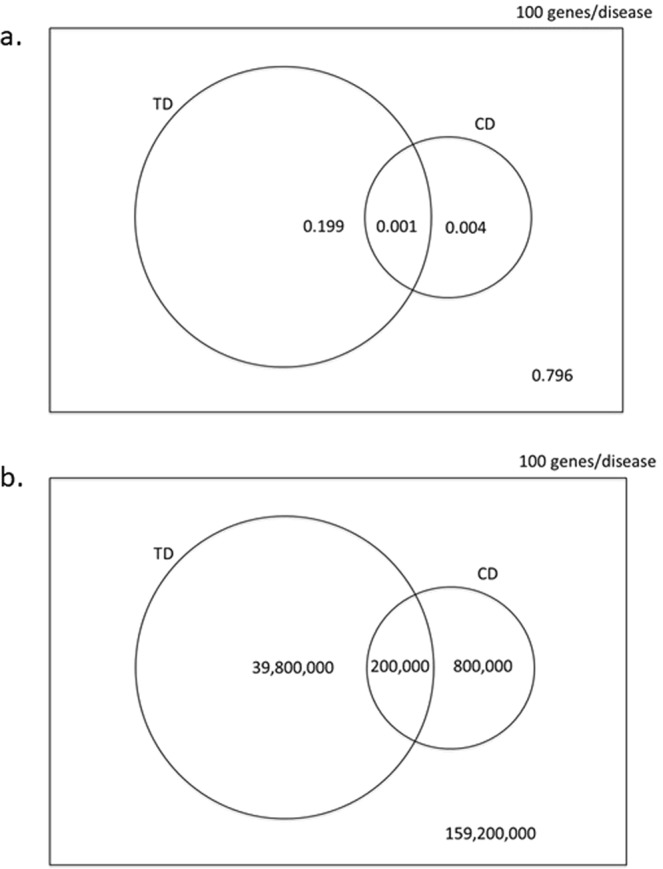
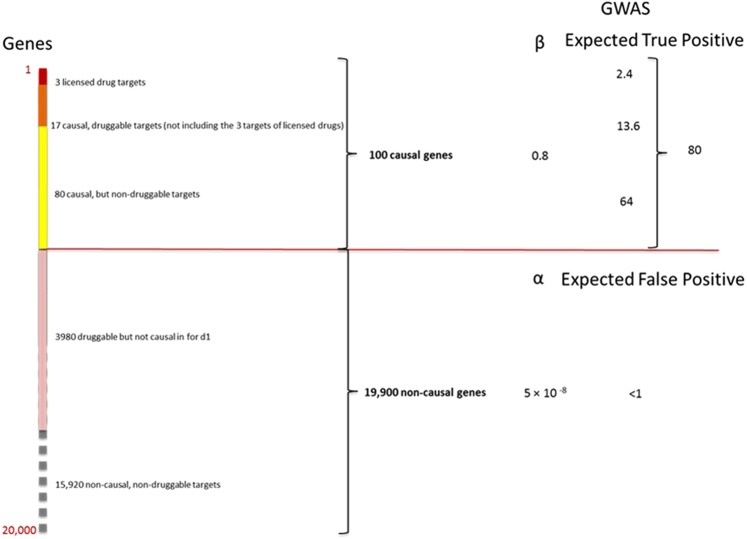
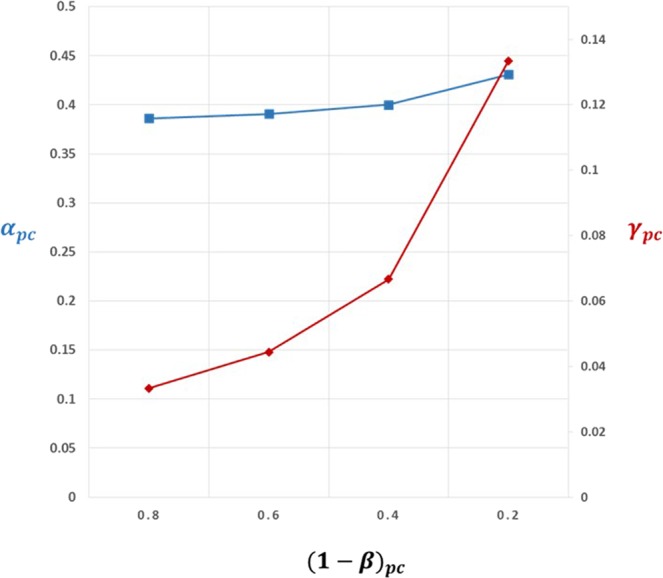
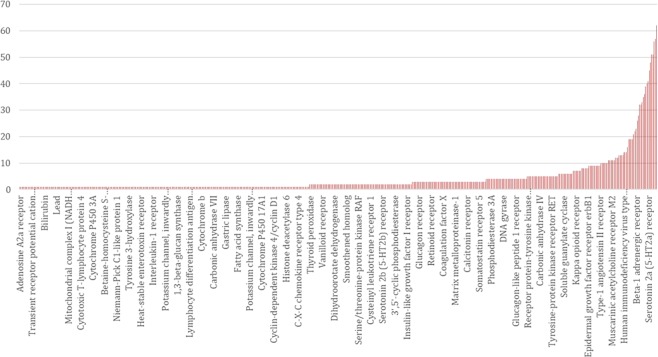
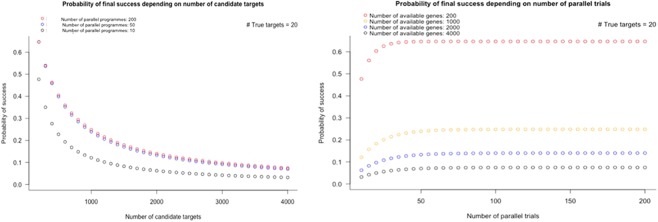
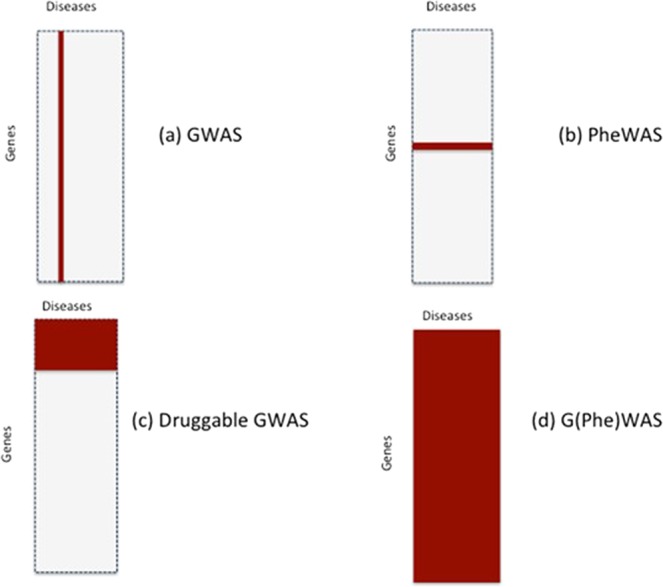
Lack of efficacy in the intended disease indication is the major cause of clinical phase drug development failure. Explanations could include the poor external validity of pre-clinical (cell, tissue, and animal) models of human disease and the high false discovery rate (FDR) in preclinical science. FDR is related to the proportion of true relationships available for discovery (γ), and the type 1 (false-positive) and type 2 (false negative) error rates of the experiments designed to uncover them. We estimated the FDR in preclinical science, its effect on drug development success rates, and improvements expected from use of human genomics rather than preclinical studies as the primary source of evidence for drug target identification. Calculations were based on a sample space defined by all human diseases - the 'disease-ome' - represented as columns; and all protein coding genes - 'the protein-coding genome'- represented as rows, producing a matrix of unique gene- (or protein-) disease pairings. We parameterised the space based on 10,000 diseases, 20,000 protein-coding genes, 100 causal genes per disease and 4000 genes encoding druggable targets, examining the effect of varying the parameters and a range of underlying assumptions, on the inferences drawn. We estimated γ, defined mathematical relationships between preclinical FDR and drug development success rates, and estimated improvements in success rates based on human genomics (rather than orthodox preclinical studies). Around one in every 200 protein-disease pairings was estimated to be causal (γ = 0.005) giving an FDR in preclinical research of 92.6%, which likely makes a major contribution to the reported drug development failure rate of 96%. Observed success rate was only slightly greater than expected for a random pick from the sample space. Values for γ back-calculated from reported preclinical and clinical drug development success rates were also close to the a priori estimates. Substituting genome wide (or druggable genome wide) association studies for preclinical studies as the major information source for drug target identification was estimated to reverse the probability of late stage failure because of the more stringent type 1 error rate employed and the ability to interrogate every potential druggable target in the same experiment. Genetic studies conducted at much larger scale, with greater resolution of disease end-points, e.g. by connecting genomics and electronic health record data within healthcare systems has the potential to produce radical improvement in drug development success rate.


Conflict of interest statement

Benevolent AI provided financial support in the form of salaries for two authors – Dr. Felix Kruger and Professor John Overington during part of the period covered by this work. Benevolent AI did not play a role in the study design, data collection and analysis, decision to publish, or preparation of the manuscript.

Figures

Figure 1
Figure 1
Sample space (NG × NT) defined by 10,000 human diseases (columns) and 20,000 protein coding genes (rows). Expanded region comprising 1/10,000tℎ of the whole sample space is enlarged: (a) based on 10th causative genes per disease); (b) (based on 100 causative genes per disease); and c (based on 1000 causative genes per disease). Each cell represents a unique gene-disease pairing. Dark blue cells indicate causal gene-disease pairings, light blue cells druggable gene-disease pairings, with red cells indicating causal and druggable gene disease pairings.
Figure 2
Figure 2
Venn diagram illustrating the (a) the probabilities of selecting and (b) the number of causal, druggable gene-disease pair (CDTD), a druggable gene disease pair (TD) and a causal, gene disease pair (CD) from 200 × 106 gene disease pairings, 100 causal genes per disease and 4000 druggable genes from the 20,000 in the genome. (Not to scale).
Figure 3
Figure 3
Re-assorted ‘therapeutic genome’ of a hypothetical disease (d1). The 20,000 protein coding genes are organised into 100 causal and 19,900 non-causal genes. Causal genes are further subdivided into 20 that are also druggable and 80 that are not. Of the 20 causal, druggable genes, 3 are the targets of licensed drugs for the treatment of d1. Of the non-causal genes, 3980 are druggable but not causal for d1. The right hand panel indicates the expected number of true and false positive genes (including druggable genes) expected in a GWAS of d1 undertaken with a sample size that provides power, 1 − β = 0.8 and type 1 error rate of α = 5 × 10−8 at all loci.
Figure 4
Figure 4
Back calculation of proportion of true target-disease relationships (γpc) studied in preclinical development, inferred from observed rates of clinical success (SC = 0.1) and preclinical success (Spc = 0.4). Estimates of γpc assume power in clinical phase development(1 − βc) = 0.8 and false positive rate in clinical development, αc = 0.05, so that the proportion of true target-disease relationships in clinical development, γc = 0.0667. The graph shows estimates of γpc (red line) for a range of values for power (1 − βpc) in preclinical development and corresponding estimates of the preclinical false positive rate, αpc (blue line). (See text for details).
Figure 5
Figure 5
Distribution of number of licensed drug compounds per target.
Figure 6
Figure 6
Probability of orthodox drug development success according to the number of candidate targets in the initial sampling frame (left panel) and the number of parallel preclinical development programmes pursued (right panel). The calculations assume there are 4000druggable genes and 20 causal, druggable targets per disease.
Figure 7
Figure 7
Study designs relevant to drug target identification and validation based on human genomics: (a) conventional genome-wide association analysis in which variation in 20,000 genes is tested against a single disease; (b) phenome wide association analysis of a gene encoding a drug target in which variation in a single druggable gene is evaluated against many (all) diseases; (c) druggable genome and phenome wide association analysis; and (d) whole genome and phenome wide association analysis.

References

    1. Paul Steven M., Mytelka Daniel S., Dunwiddie Christopher T., Persinger Charles C., Munos Bernard H., Lindborg Stacy R., Schacht Aaron L. How to improve R&D productivity: the pharmaceutical industry's grand challenge. Nature Reviews Drug Discovery. 2010;9(3):203–214. doi: 10.1038/nrd3078. - DOI - PubMed
    1. Hay Michael, Thomas David W, Craighead John L, Economides Celia, Rosenthal Jesse. Clinical development success rates for investigational drugs. Nature Biotechnology. 2014;32(1):40–51. doi: 10.1038/nbt.2786. - DOI - PubMed
    1. Munos Bernard. Lessons from 60 years of pharmaceutical innovation. Nature Reviews Drug Discovery. 2009;8(12):959–968. doi: 10.1038/nrd2961. - DOI - PubMed
    1. Pammolli Fabio, Magazzini Laura, Riccaboni Massimo. The productivity crisis in pharmaceutical R&D. Nature Reviews Drug Discovery. 2011;10(6):428–438. doi: 10.1038/nrd3405. - DOI - PubMed
    1. Scannell Jack W., Blanckley Alex, Boldon Helen, Warrington Brian. Diagnosing the decline in pharmaceutical R&D efficiency. Nature Reviews Drug Discovery. 2012;11(3):191–200. doi: 10.1038/nrd3681. - DOI - PubMed

Publication types