. 2019 Dec 11;9(1):18795.
doi: 10.1038/s41598-019-55455-6.

Clinical Implications of Sub-grouping HER2 Positive Tumors by Amplicon Structure and Co-amplified Genes

Affiliations

Clinical Implications of Sub-grouping HER2 Positive Tumors by Amplicon Structure and Co-amplified Genes

Myriam Maoz et al. Sci Rep. .

Erratum in

Abstract

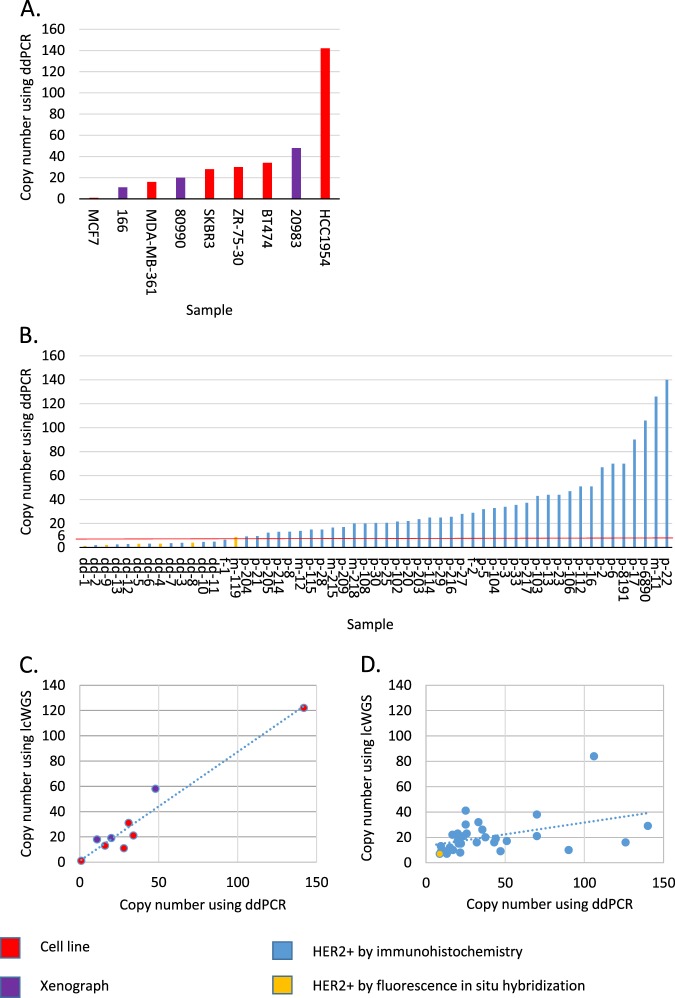
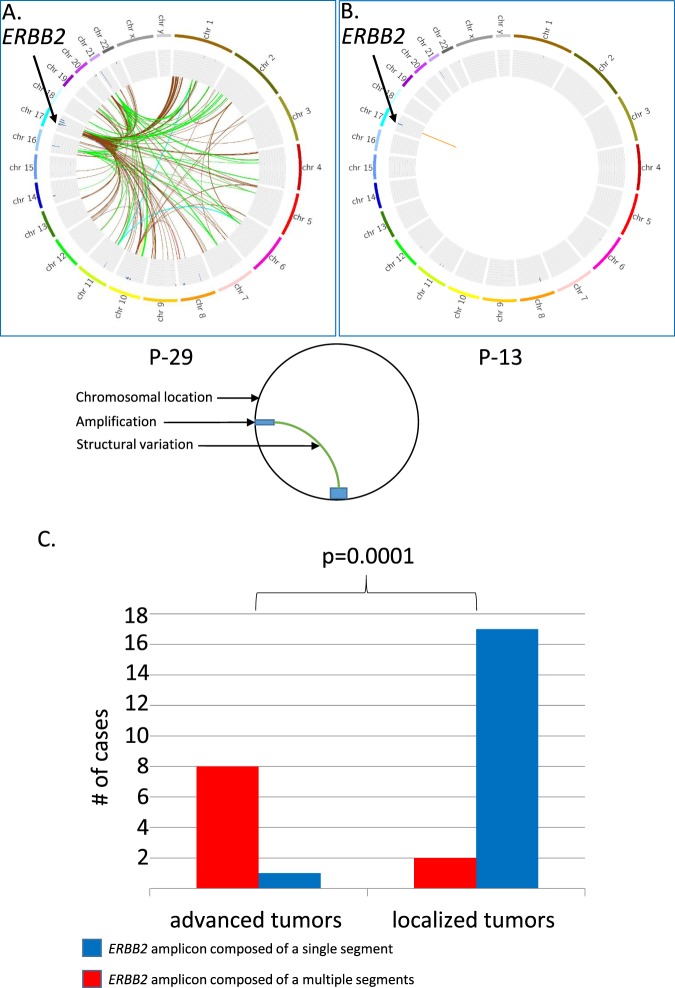
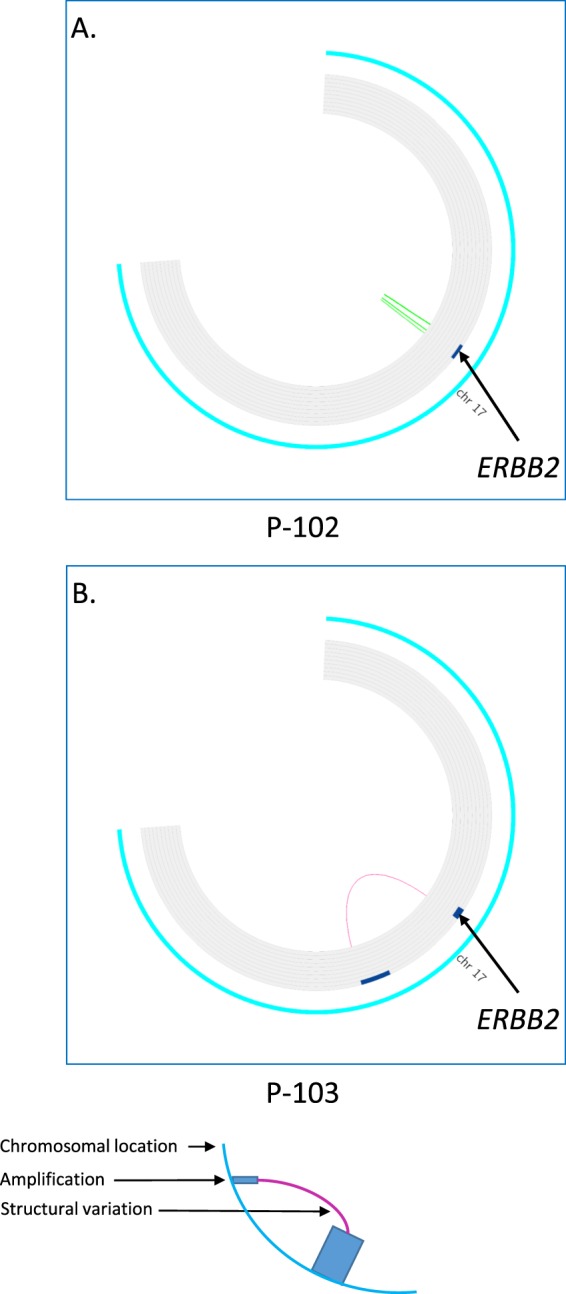
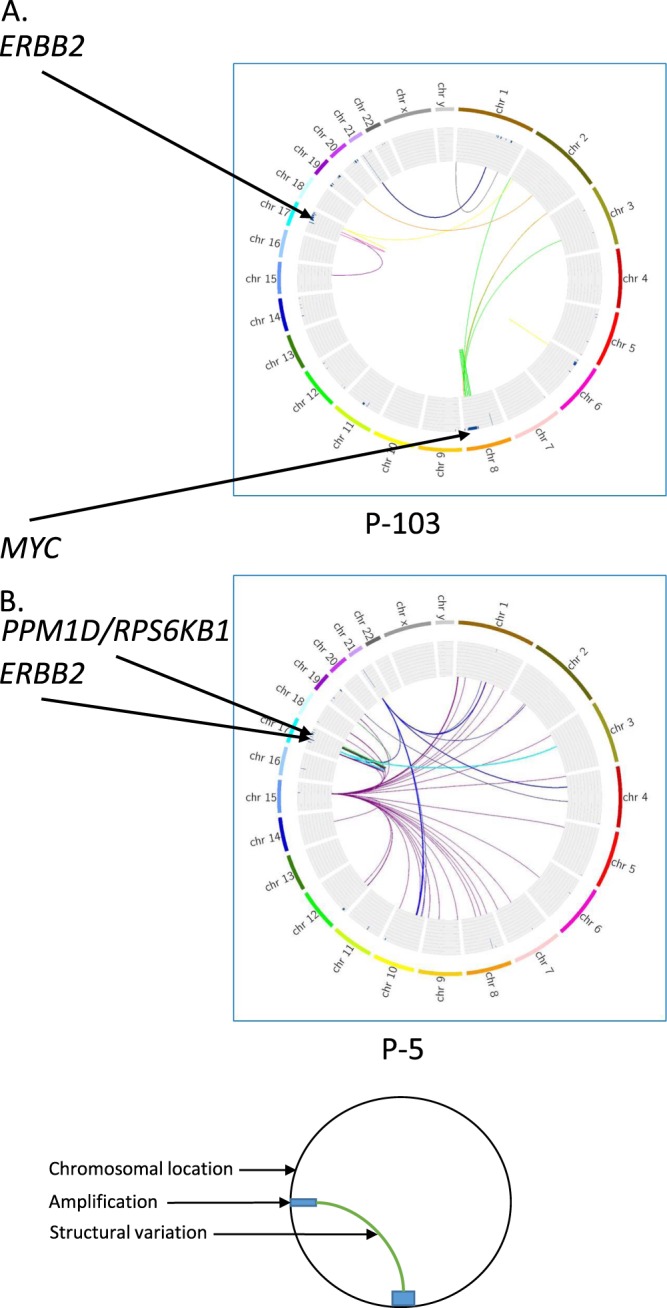
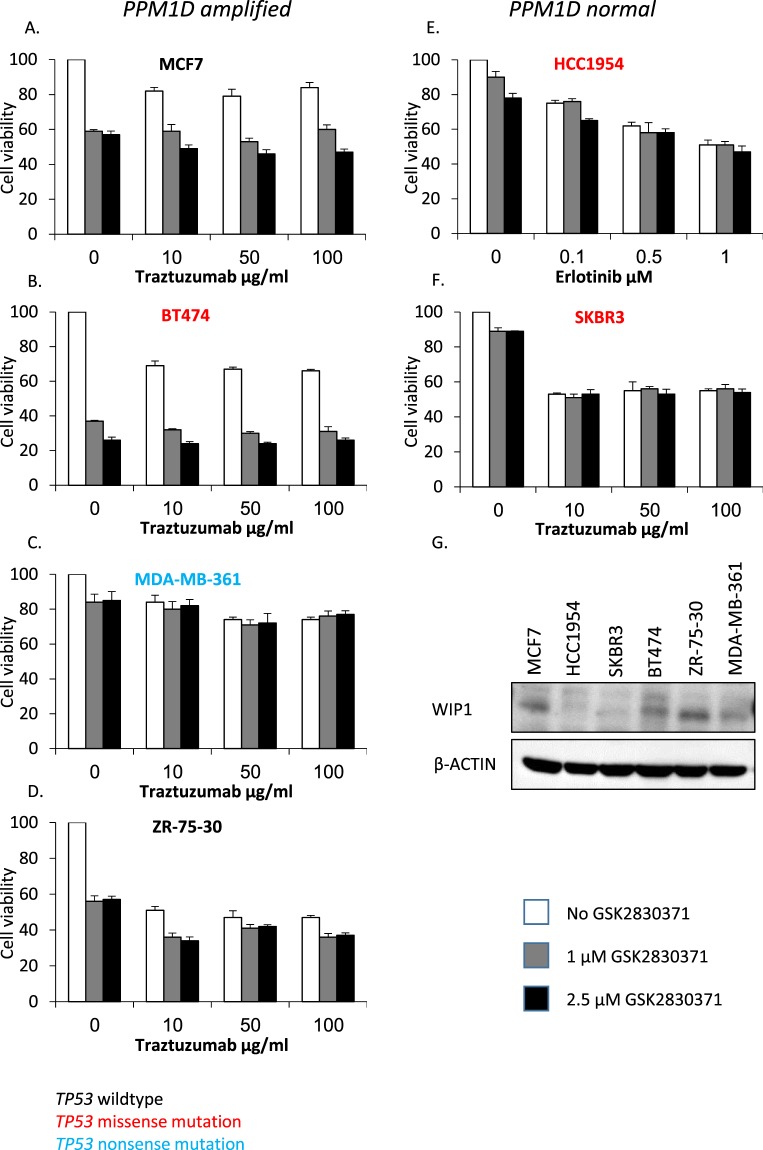
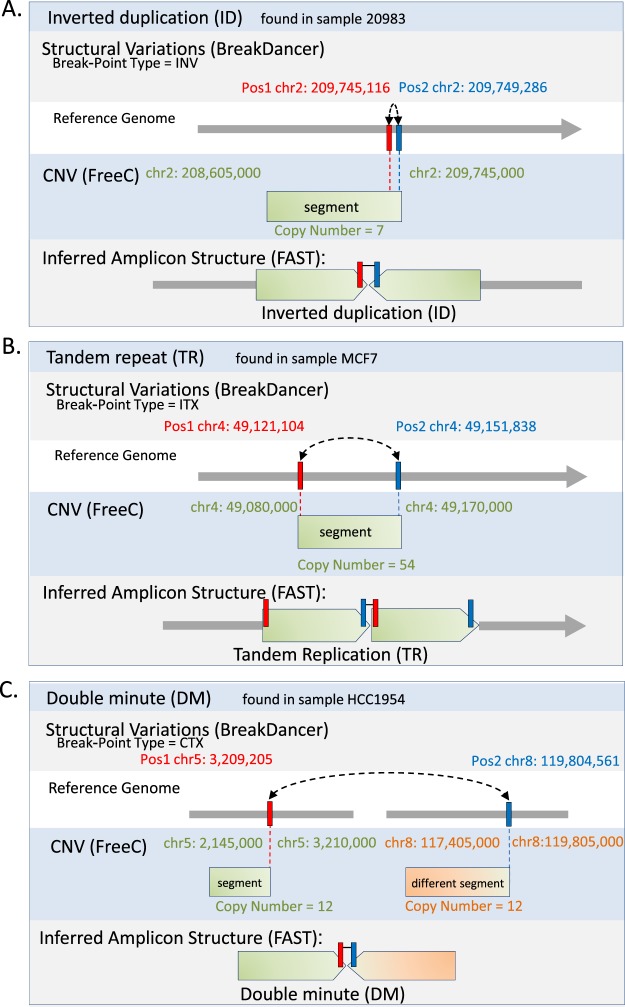
ERBB2 amplification is a prognostic marker for aggressive tumors and a predictive marker for prolonged survival following treatment with HER2 inhibitors. We attempt to sub-group HER2+ tumors based on amplicon structures and co-amplified genes. We examined five HER2+ cell lines, three HER2+ xenographs and 57 HER2+ tumor tissues. ERBB2 amplification was analyzed using digital droplet PCR and low coverage whole genome sequencing. In some HER2+ tumors PPM1D, that encodes WIP1, is co-amplified. Cell lines were treated with HER2 and WIP1 inhibitors. We find that inverted duplication is the amplicon structure in the majority of HER2+ tumors. In patients suffering from an early stage disease the ERBB2 amplicon is composed of a single segment while in patients suffering from advanced cancer the amplicon is composed of several different segments. We find robust WIP1 inhibition in some HER2+ PPM1D amplified cell lines. Sub-grouping HER2+ tumors using low coverage whole genome sequencing identifies inverted duplications as the main amplicon structure and based on the number of segments, differentiates between local and advanced tumors. In addition, we found that we could determine if a tumor is a recurrent tumor or second primary tumor and identify co-amplified oncogenes that may serve as targets for therapy.


Conflict of interest statement

The authors declare no competing interests.

Figures

Figure 1
Figure 1
ERBB2 copy number in study samples. We measured ERBB2 CN using ddPCR and lcWGS in six samples derived from cell lines, colored red; three xenographs, colored purple (panel A); 55 HER2+ tumors, colored blue and six FISH positive tumors, colored orange. 42 tumors were found ddPCR positive, using a cut-off of six copies, and were further examined using lcWGS (panel B). In samples derived from cell lines and xenographs the correlation between ddPCR and lcWGS is strong, with a linear regression represented by the dotted line with a R2 of 0.94 (panel C). In 42 samples derived from FFPE two ddPCR positive samples are negative when measured using lcWGS, with a CN of two. In the 40 remaining samples the correlation between tests is weaker, with a linear regression represented by the dotted line with a R2 of 0.19 (panel D).
Figure 2
Figure 2
ERBB2 amplicon structure is different in patient with localized and advanced disease. FAST analysis of low coverage whole genome sequencing (lcWGS) of two primary breast ER+/HER2+ tumors is visualized using Circus. The external ring represents chromosomal location; the inner ring shows areas of amplification as blue bars. Colored lines represent structural variations (SV), all the SV in an amplicon are colored with the same color. Although both (P-29 and P-13) are primary breast ER+/HER2+ tumors, P-29 was resected from a patient suffering from a metastatic disease as a palliative measure and P-13 was resected from a patient with a localized disease with curative intent. In P-29 the ERBB2 amplicon is composed of several segments (Panel A) and in P-13 of a single segment (Panel B). The ERBB2 amplicon is composed of a single segment, colored blue, in 17/19 patients with localized tumors, and is composed of multiple segments, colored red, in 8/9 patients with advanced tumors, Fisher exact test, two sided p = 0.0001 (Panel C).
Figure 3
Figure 3
Difference in ERBB2 amplicon in two breast tumors from the same patient. FAST analysis of low coverage whole genome sequencing (lcWGS) of two primary ER+/HER2+ and ER?/HER2+ breast tumors is visualized using Circus. The external ring represents chromosomal location on chromosome 17, the inner ring shows areas of amplification as blue bars. Colored lines represent structural variations (SV). Both tumors (P-102 and P-103) are primary HER2+ breast cancer. In P-102 the ERBB2 amplicon spans chr17:37,125,000-38,715,000, has eight copies and has an inverted duplication amplicon structure (panel A) while In P-103 the ERBB2 amplicon spans chr17:36,960,000-38,070,000, has 16 copies and has a double minute amplicon structure (panel B).
Figure 4
Figure 4
MYC, PPM1D and RPS6KB1 co-amplification with ERBB2. FAST analysis of low coverage whole genome sequencing (lcWGS) of two primary ER+/HER2+ breast tumors is visualized using Circus. The external ring represents chromosomal location; the inner ring shows areas of amplification as blue bars. Colored lines represent structural variations (SV), all the SV in an amplicon are colored with the same color. Although both tumors (P-5 and P-103) are primary breast ER+/HER2+ the co-amplified genes are different. In P-103 MYC co-amplification, colored green (panel A) while in P-5 PPM1D and RPS6KB1 co-amplification, colored green (panel B).
Figure 5
Figure 5
WIP1 and HER2 co-inhibition in different cell lines. We measured cell viability (y-axis) of cell lines with (MCF7, BT474, MDA-MB-361 and ZR-75-30) or without (HCC1954 and SKBR3) PPM1D amplification. Some cell lines are TP53 wildtype (MCF7 and ZR-75-30), colored black; some harbor a TP53 missense mutation (HCC1954, SKBR3 and BT474), colored red and one harbors a TP53 nonsense mutation (MDA-MB-361), colored blue. Cell lines were treated with HER2 inhibitors and with GSK2830371, a WIP1 inhibitor. Cell viability decreased by WIP1 inhibition in some of the PPM1D amplified cell lines (pane A, B and D) but not in PPM1D normal cell lines (pane E and F) and a PPM1D amplified, TP53 nonsense mutated cell line (pane C). We measured WIP1 levels by immunoblotting, elevated WIP1 protein levels were found in cell lines with PPM1D amplification compared to cell lines without PPM1D amplification (pane G.).
Figure 6
Figure 6
Identification of amplicon structure (AS) using copy number variation (CNV) and structural variation (SV). Following low coverage whole genome sequencing of tumor DNA we detected and analyzed structural variation (SV) using BreakDancer and enumerated copy number (CN) using Control-FREEC. The data was integrated and further analyzed using FindAmpliconSTructure: FAST, to identify regions with genomic amplification and infer amplicon structure (AS). (A) Identification of inverted duplication (ID) based amplification: A break-point of type Inversion (INV) was found by BreakDancer between Pos1 and Pos2 (chr2: 209,745,116 and chr2: 209,749,286). A segment (chr2:208,605,000-209,745,000 in 7 copies) was found by FreeC, the right edge of which coincides with Pos1 and Pos2. This combination delineates an amplicon structure of Inverted duplication (ID), in which the segment is repeated head-to-head. (B) Identification of tandem repeat (TR) based amplification: A break-point of type Internal-Translocation (ITX) was found by BreakDancer between Pos1 and Pos2 (chr4: 49,121,104 and chr4: 49,151,838). A segment (chr4: 49,080,000-49,170,000 in 54 copies) was found by FreeC, coinciding with Pos1 and Pos2, as shown. This combination delineates an amplicon structure of Tandem Repeat (TR), in which the segment is repeated head-to-tail. (C) Identification of double minute (DM) based amplification: A break-point of type inter-chromosomal translocation (CTX) was found by BreakDancer between Pos1 and Pos2 (chr5: 3,209,205 and chr8: 119,804,561). Two segments were found by FreeC (chr5: 2,145,000-3,210,000 in 12 copies, and chr8: 117,405,000-119,805,000 in 12 copies), one edge of each segment coincides with one of the break-points’ positions. This combination delineates an amplicon structure of Double Minute (DM), in which segments from different chromosomes are linked. The following link to a session in UCSC Browser shows the CN and SV tracks of samples.

References

    1. Krause DS, Van Etten RA. Tyrosine kinases as targets for cancer therapy. N Engl J Med. 2005;353:172–187. doi: 10.1056/NEJMra044389. - DOI - PubMed
    1. Slamon DJ, et al. Human breast cancer: correlation of relapse and survival with amplification of the HER-2/neu oncogene. Science. 1987;235:177–182. doi: 10.1126/science.3798106. - DOI - PubMed
    1. Curtis C, et al. The genomic and transcriptomic architecture of 2,000 breast tumours reveals novel subgroups. Nature. 2012;486:346–352. doi: 10.1038/nature10983. - DOI - PMC - PubMed
    1. Yin W, Jiang Y, Shen Z, Shao Z, Lu J. Trastuzumab in the adjuvant treatment of HER2-positive early breast cancer patients: a meta-analysis of published randomized controlled trials. PloS one. 2011;6:e21030. doi: 10.1371/journal.pone.0021030. - DOI - PMC - PubMed
    1. Bang YJ, et al. Trastuzumab in combination with chemotherapy versus chemotherapy alone for treatment of HER2-positive advanced gastric or gastro-oesophageal junction cancer (ToGA): a phase 3, open-label, randomised controlled trial. Lancet. 2010;376:687–697. doi: 10.1016/S0140-6736(10)61121-X. - DOI - PubMed

Publication types

MeSH terms