. 2019 Dec;576(7787):482-486.
doi: 10.1038/s41586-019-1832-9. Epub 2019 Dec 11.

KRAS4A directly regulates hexokinase 1

Affiliations

KRAS4A directly regulates hexokinase 1

Caroline R Amendola et al. Nature. 2019 Dec.

Abstract

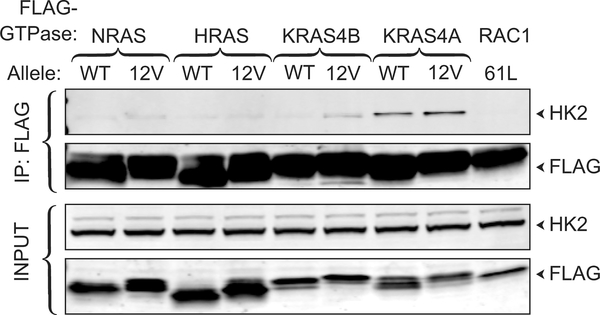
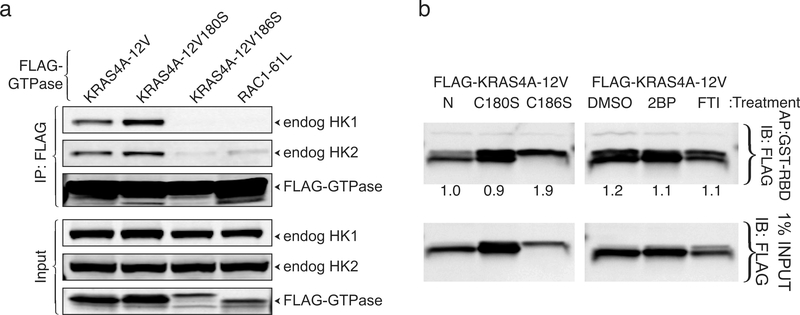
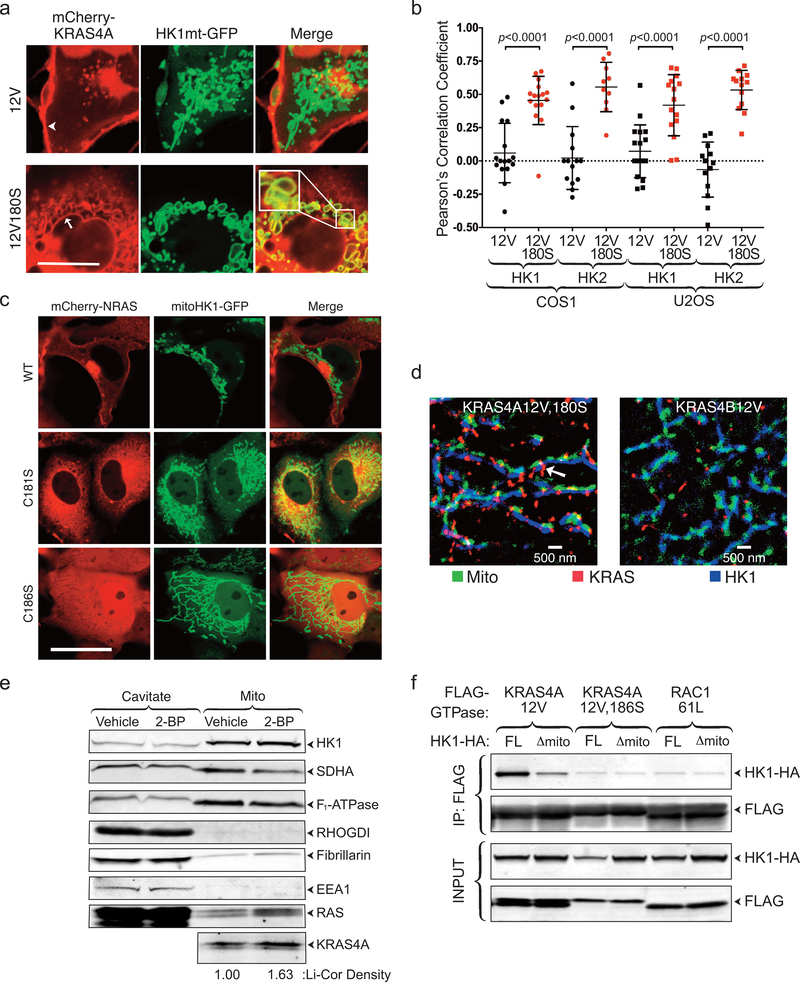
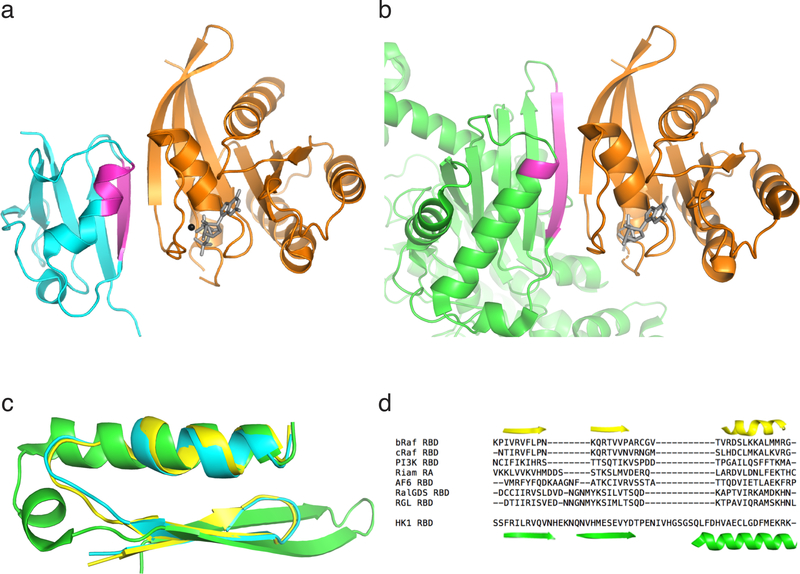
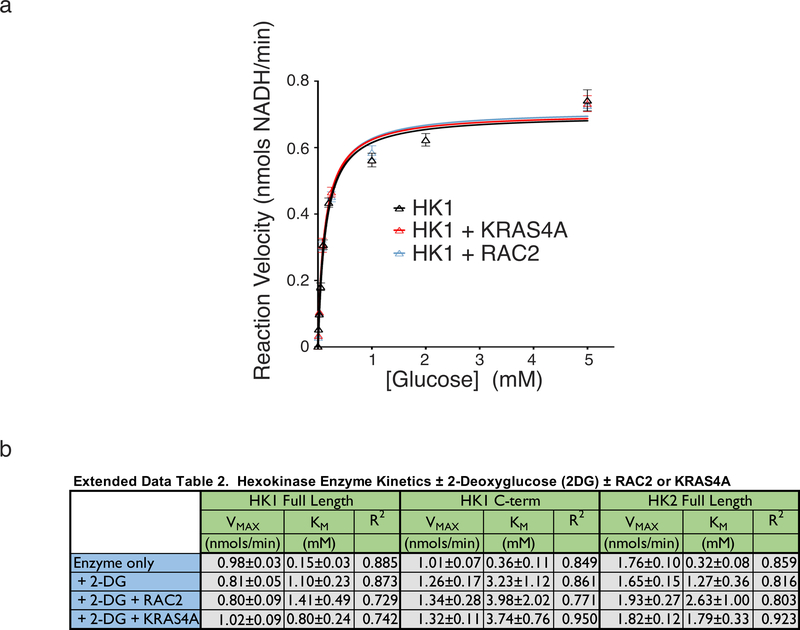
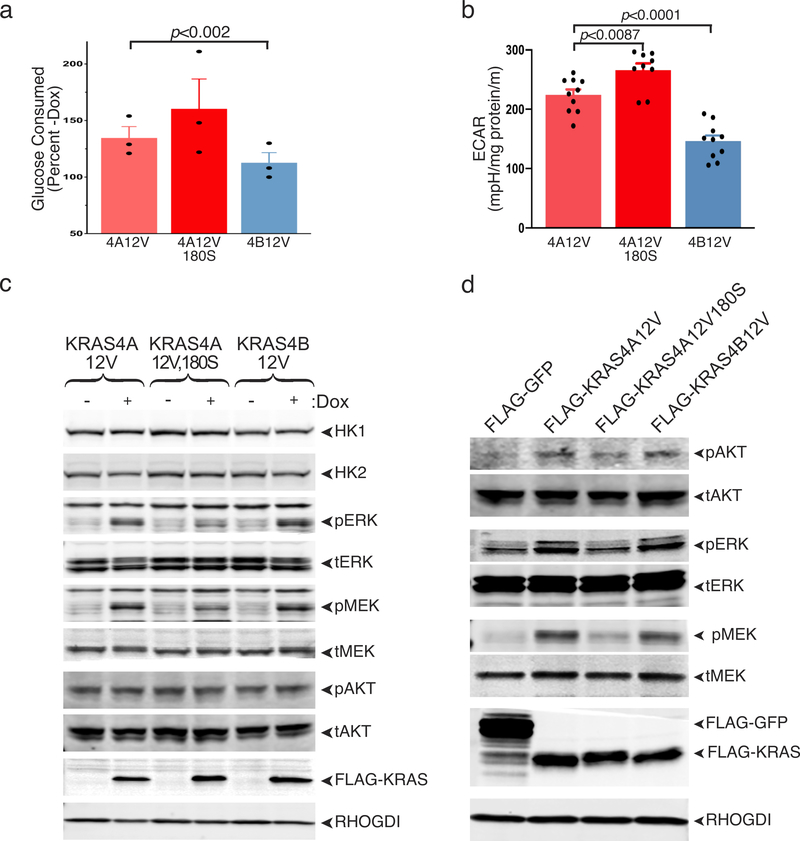
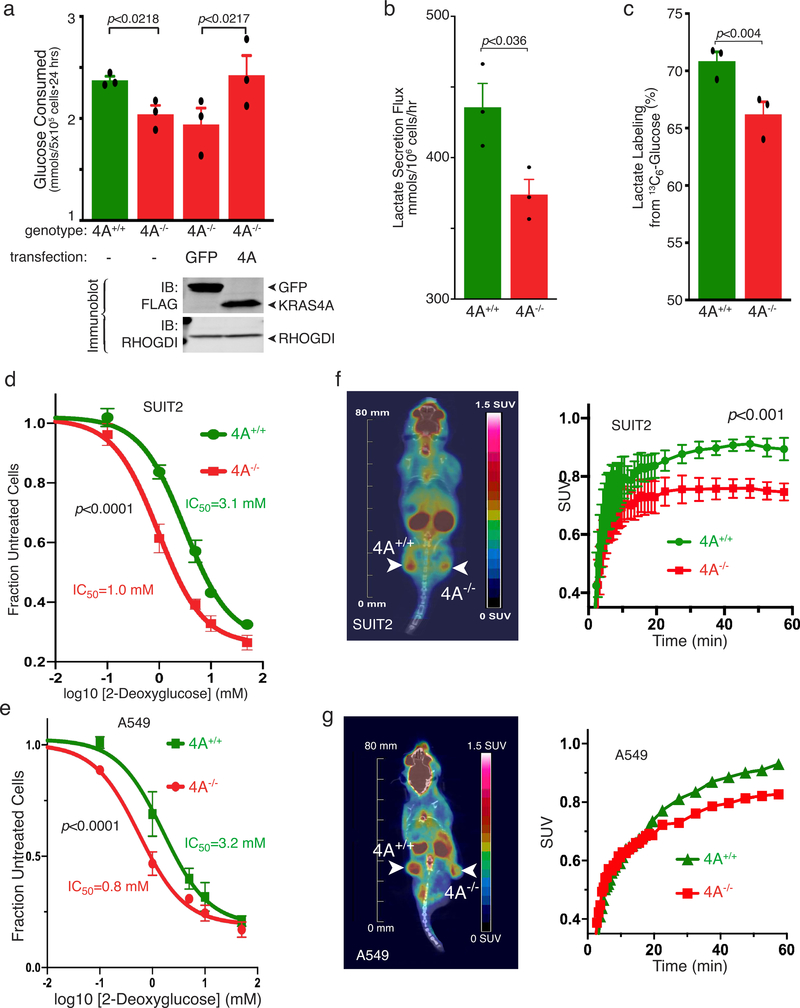
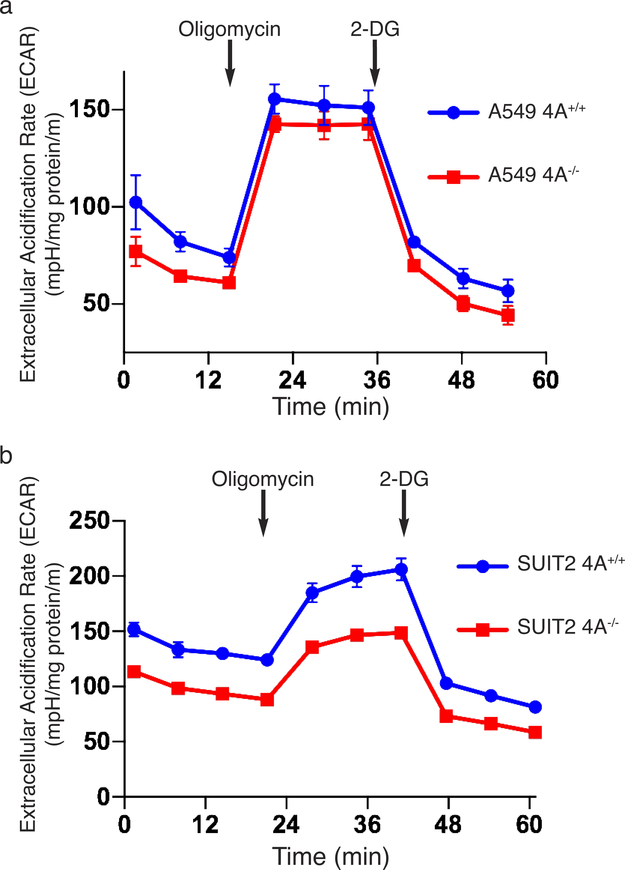
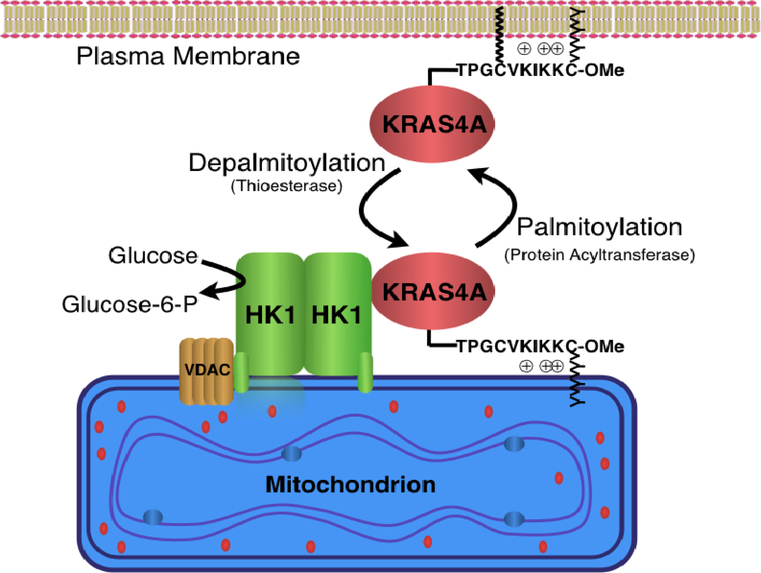
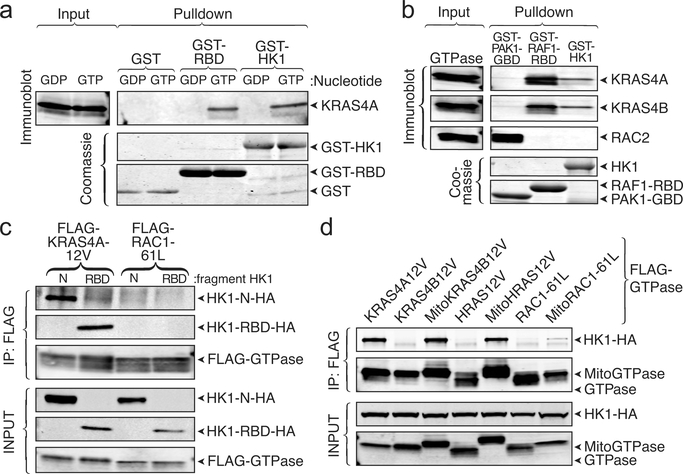
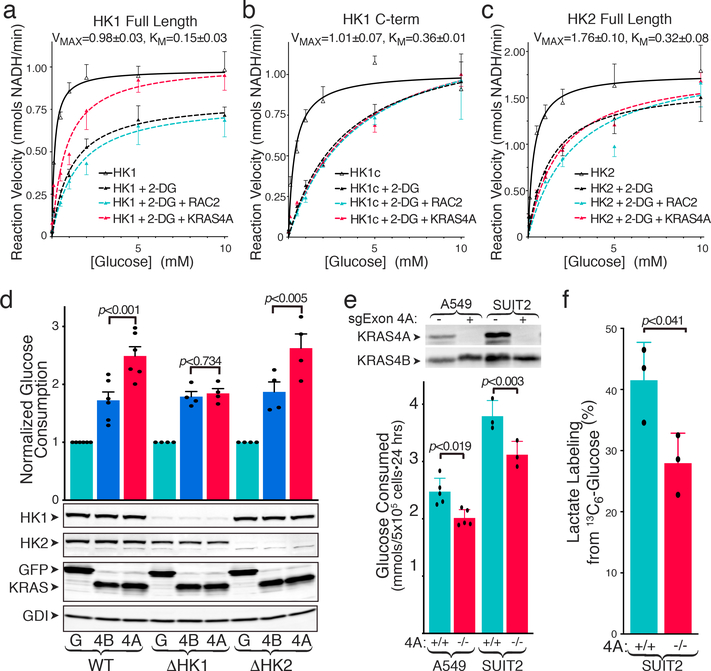
The most frequently mutated oncogene in cancer is KRAS, which uses alternative fourth exons to generate two gene products (KRAS4A and KRAS4B) that differ only in their C-terminal membrane-targeting region1. Because oncogenic mutations occur in exons 2 or 3, two constitutively active KRAS proteins-each capable of transforming cells-are encoded when KRAS is activated by mutation2. No functional distinctions among the splice variants have so far been established. Oncogenic KRAS alters the metabolism of tumour cells3 in several ways, including increased glucose uptake and glycolysis even in the presence of abundant oxygen4 (the Warburg effect). Whereas these metabolic effects of oncogenic KRAS have been explained by transcriptional upregulation of glucose transporters and glycolytic enzymes3-5, it is not known whether there is direct regulation of metabolic enzymes. Here we report a direct, GTP-dependent interaction between KRAS4A and hexokinase 1 (HK1) that alters the activity of the kinase, and thereby establish that HK1 is an effector of KRAS4A. This interaction is unique to KRAS4A because the palmitoylation-depalmitoylation cycle of this RAS isoform enables colocalization with HK1 on the outer mitochondrial membrane. The expression of KRAS4A in cancer may drive unique metabolic vulnerabilities that can be exploited therapeutically.


Conflict of interest statement

Competing Interests: A.C.K. has financial interests in Vescor Therapeutics, LLC. A.C.K. is an inventor on patents pertaining to KRAS regulated metabolic pathways, redox control pathways in pancreatic cancer, targeting GOT1 as therapeutic approach, and the autophagic control of iron metabolism. A.C.K. is on the SAB of Rafael/Cornerstone Pharmaceuticals.

Figures

Extended Data Figure 1. |
Extended Data Figure 1. |. KRAS4A binds HK2 in an isoform-specific and GTP-dependent fashion.
The indicated FLAG-tagged RAS constructs (±G12V mutations) were expressed in HeLa cells and immunoprecipitated with anti-FLAG beads. Blots were probed for FLAG-tagged proteins and endogenous HK2. FLAG-RAC161L served as the negative control. The immunoblot shown is representative of 4 independent experiments.
Extended Data Figure 2. |
Extended Data Figure 2. |. Association of KRAS4A with HK1 and HK2 requires prenylation but is diminished by palmitoylation.
a, HeLa cells expressing the indicated, FLAG-tagged GTPase were lysed, KRAS4A or RAC1 were immunoprecipitated, and the precipitates blotted for FLAG-tagged GTPases or endogenous HK1 or HK2. b, To confirm that the results in (a) reflect membrane targeting rather than GTP loading, the relative GTP loading of the KRAS4A proteins was determined by GST-RBD affinity capture. FLAG-KRAS4A with an activating 12V mutation and either a native (N) membrane-targeting sequence or one with the indicated substitution were expressed in HEK293 cells (left). In addition, FLAG-KRAS4A12V expressing cells were treated with 2BP to inhibit palmitoylation or FTI to inhibit farnesylation (right). Total FLAG-KRAS12V was measured by anti-FLAG immunoblot of 1% of the lysate (bottom) and GTP-bound FLAG-KRAS4A was measured by affinity purification of the remaining lysate with GST-RBD (top). The number under each lane is the amount of GTP-bound KRAS4A relative to lane 1 after normalization for expression (bottom). a-b, Immunoblots shown are representative of 2 independent experiments.
Extended Data Figure 3. |
Extended Data Figure 3. |. Colocalization of palmitoylation-deficient KRAS4A but not NRAS with HK1 on mitochondria.
a, Representative live-cell images of COS1 cells co-transfected with the indicated mCherry-KRAS4A constructs and GFP extended with the mitochondrial-targeting sequence of HK1 (HK1mt-GFP). Arrowhead and arrow indicate plasma membrane and nuclear envelope, respectively; scale bar represents 10 μm. The cell shown is representative of hundreds on each plate of 5 independent transfections. b, Colocalization of KRAS4A ±palmitoylation with HK1 and HK2. COS1 or U2OS cells were co-transfected with GFP-tagged HK1 or HK2 and mCherry-tagged, constitutively active KRAS4A12V, with or without mutation of cysteine 180 to serine (180S) to block palmitoylation. The cells were imaged alive with a Zeiss LSM 800 and the Pearson’s correlation coefficient between the red and green channels was measured. Data plotted as mean±SD of the values measured in 15 cells examined (n=15). Significance was determined by unpaired, two-tailed student’s t-test. c, Neither WT nor palmitoylation-deficient NRAS colocalizes with HK1-targeted GFP on mitochondria. mCherry tagged WT, palmitoylation-deficient (C181S), or prenylation-deficient (C186S) NRAS were coexpressed in COS1 cells with GFP extended with the mitochondrial targeting region of HK1 (mitoHK1-GFP) and imaged alive with an inverted Zeiss 800 laser scanning confocal microscope. Bar indicates 10 μm. Images shown are representative of hundreds of transfected cells on each plate in 2 independent experiments. d, Super-resolution (STORM) image of U2OS cells transfected with FLAG-KRAS4A12V,180S or FLAG-KRAS4B12V showing colocalization with HK1 on the OMM (arrow) of KRAS4A12V,180S but not KRAS4B12V. n=3. e, Mitochondria were purified from HCT-15 cells pre-treated with vehicle or 2-BP and analyzed by immunoblot with the indicated antibodies: succinate dehydrogenase (SDHA, mitochondrial matrix), F1-ATPase (mitochondrial inner membrane), RHOGDI (cytosol), fibrillarin (nucleolus), EEA1 (endosomes). RAS indicates total RAS detected by a pan-RAS antibody. KRAS4A immunoblot was quantified by Li-Cor Odyssey infrared scanner. Immunoblot shown is representative of 2 independent experiments. f, The interaction of KRAS4A with HK1 requires the HK1 OMM targeting sequence. The indicated FLAG-tagged KRAS4A constructs were co-expressed in HEK293 cells with HA-tagged full-length HK1 (FL) or HK1 missing its OMM-targeting region (Δ1–21; Δmito). FLAG-KRAS4A was immunoprecipitated, and binding to HK1 was assessed with an anti-HA immunoblot. The immunoblot shown is representative of 4 independent experiments.
Extended Data Figure 4. |
Extended Data Figure 4. |. A putative RAS binding region in HK1.
a, Crystal structure (PDB 4G0N) of the CRAF RAS binding domain (RBD, cyan and magenta) in complex with the G-domain of HRAS (orange; nucleotide (gray) and magnesium (black)). The regions of the CRAF RBD that mediate the interaction with HRAS are colored magenta. b, Superposition of the N-terminal lobe of HK1 (green and magenta; PDB 4F9O) alongside HRAS (orange). The putative region of HK1 that interacts with RAS, corresponding to that of CRAF RBD, are colored magenta. c, A section of the helix-loop-sheet structure common to RBDs are superimposed on the region of HK1 highlighted in (b). The RBD of CRAF is shown in cyan, BRAF (PDB 3NY5) in yellow and the putative RBD of HK1 in green. d, Sequence alignments of validated RBDs and the HK1 putative RBD shown with structural motifs of BRAF (yellow) and HK1 (green). Despite the highly conserved structural features shown in (c), RBDs have little sequence homology.
Extended Data Figure 5. |
Extended Data Figure 5. |. Hexokinase enzyme kinetics with and without recombinant KRAS4A and with and without 2-deoxyglucose (2-DG).
a, Activity of recombinant full-length hexokinase 1 is unaffected by recombinant KRAS4A. Reaction velocity is plotted (mean±SE) as a function of glucose concentration. Velocities are plotted ±addition of recombinant, GTP-loaded KRAS4A or RAC2. Plots combine independent assays, n=4. b, Hexokinase enzyme kinetics. Full-length hexokinase 1 and 2 and the catalytic C-terminal domain of HK1 were expressed in E. coli as GST fusion proteins and affinity purified with glutathione-agarose beads. Hexokinase activities on the beads was measured with a linked assay kit (BioVision, Milpitas, CA, USA) in which the glucose-6-phophate produced is oxidized by glucose-6-phosphate dehydrogenase to form NADH, which reduces a colorless probe to a colored product with strong absorbance at 450 nm. VMAX and KM were calculated by nonlinear regression using GraphPad Prism software (v 8.1.1) and goodness of fit is given as R2.
Extended Data Figure 6. |
Extended Data Figure 6. |. Dissociation between MAPK signaling and differential stimulation of glucose consumption and basal extracellular acidification rate (ECAR) by KRAS4A versus palmitoylation-deficient KRAS4A and KRAS4B.
a-c, Flp-In™ T-REx™ 293 cells were generated that express the indicated KRAS proteins upon doxycycline induction. a,b, Glucose consumption, mean±SE, n=5 (a), and basal ECAR, mean±SE, n=10 (b), were measured in doxycycline induced cells revealing the order of potency as KRAS4A12V,180S> KRAS4A12V> KRAS4B12V. Significance was determined by student’s t-test, paired (a) and unpaired (b). c, Immunoblot reveals equivalent expression of the three KRAS proteins in the cells used in a and b. Whereas KRAS4A12V and KRAS4B12V induced equivalent levels of phospho-ERK and phospho-MEK, KRAS4A12V,180S (palmitoylation deficient) was less potent. These cells have constitutively high levels of AKT phosphorylation that were not altered by expression of any form of KRAS. Note also that, despite MAPK stimulation, protein levels of HK1 and HK2 were not altered. Immunoblots shown are representative of two independent experiments (n=2). d, Parental HEK293 cells with lower basal pAKT were transfected with the indicated constructs, transferred to 0.1% serum 18 hrs after transfection and lysed 24 hrs later. Lysates were analyzed for the indicated proteins by immunoblot. n=2.
Extended Data Figure 7 |
Extended Data Figure 7 |. Glucose utilization and 2DG sensitivity in KRAS mutant human tumor cells with or without exon 4A.
a, Rate of glucose consumption (mean±SE, n=3) in parental (4A+/+), exon 4A targeted (4A−/−) A549 and 4A−/− cells transfected with FLAG-GFP or FLAG-KRAS4A12V. Representative expression is shown by immunoblot. b, Lactate secretion flux (mean±SE, n=3) measured over 24 hrs in A549 cells with the indicated genotype. c, Incorporation of 13C from glucose into lactate (mean±SE, n=3) in A549 cells with the indicated genotype. a-c, Mean±SE is plotted, n=3, significance determined by paired student’s t-test. d-e, Growth inhibition by 2DG of SUIT2 (d, 48 hrs) and A549 (e, 24 hrs) cells with or without KRAS4A (mean±SE, n=3, significance by two-way ANOVA). f-g, SUIT2 (f) or A549 (g) cells were used to establish xenograft tumors on the contralateral flanks (4A+/+ versus 4A−/−) of NCG mice. Six weeks later, when the tumors were established and of equivalent size, glucose uptake was measured by 18FDG PET-CT scan. f, Representative coronal scan or mouse with SUIT2 xenografts (left). Glucose uptake represented by a color look up table. Standardize uptake values (SUVs) of the entire tumor are plotted (mean±SD, n=5 mice, significance by two-way ANOVA) as a function of time after 18FDG injection (right). g, Coronal scan (left) of representative mouse (n=5) with A549 xenografts. SUV versus time after injection plotted for that mouse (right).
Extended Data Figure 8. |
Extended Data Figure 8. |. Diminished basal extracellular acidification rate (ECAR) in KRAS mutant tumor cells null for KRAS4A.
a-b, ECAR measured by Seahorse XFe96 of (a) A549 and (b) SUIT2 cells with or without disruption of KRAS exon 4A by CRISPR/Cas9. Oligomycin inhibits oxidative phosphorylation and allows measurement of glycolytic reserve. 2-DG inhibits glycolysis. Data plotted are mean±SE, n=10 technical replicates.
Extended Data Figure 9. |
Extended Data Figure 9. |. Quantification of HK1 and total KRAS in tumor cell lines.
a, (top) A standard curve for the quantification of HK1 by immunoblot was generated by titrating recombinant HK1 and probing with a rabbit monoclonal Ab (Cell Signaling C3534). (bottom) Immunoblots of the indicated amounts of lysate (5000 cells per μl). Calculations based on these results and MW=100 kDa indicate 200,000 and 150,000 molecules per cell for A549 and HCT-15 cells, respectively. b, (top) A standard curve for the quantification of total KRAS by immunoblot was generated by titrating recombinant KRAS4B truncated at aa171 and probing with a mouse monoclonal Ab (Sigma WH0003845M1). (bottom) Immunoblots of the indicated amounts of lysate (5000 cells per μl). Calculations based on these results and MW=21 kDa indicate 700,000 and 200,000 molecules per cell for A549 and HCT-15 cells, respectively. a,b, Standard curves were plotted by linear regression using GraphPad Prism software v. 8.1.1, with goodness of fit given as R.
Extended Data Figure 10. |
Extended Data Figure 10. |. Model of KRAS4A regulation of hexokinase 1 (HK1).
Like all palmitoylated GTPases, KRAS4A cycles between a palmitoylated and depalmitoylated state. When palmitoylated, the protein has relatively high affinity for the plasma membrane by virtue of farnesylation of the C-terminal CAAX sequence and an adjacent polybasic region that operate in conjunction with palmitoylation. Upon depalmitoylation, KRAS4A loses affinity for the plasma membrane and gains affinity for endomembranes, including the outer mitochondrial membrane (OMM). Tethering of KRAS4A to the OMM allows it to interact with HK1, resident on this compartment by virtue of an N-terminal OMM targeting sequence and protein-protein interaction with VDAC. Interaction of KRAS4A with HK1 on the OMM decreases allosteric inhibition by glucose-6-phosphate and thereby enhances HK1 activity and glycolytic flux.
Fig. 1. |
Fig. 1. |. KRAS4A binds HK1 and HK2 in a GTP- and prenylation-dependent fashion.
a, The indicated FLAG-tagged RAS constructs (±G12V mutations) were expressed in HeLa cells and immunoprecipitated with anti-FLAG beads. Blots were probed for endogenous HK1. FLAG-RAC61L served as the negative control. Data shown are representative of 4 independent experiments (n=4). b, GFP-tagged HK1 or HK2 were co-expressed with the indicated FLAG-tagged RAS constructs, immunoprecipitated with anti-GFP beads, and blots probed with anti-FLAG antibody. KRAS4AG12V,C186S is not prenylated and therefore cannot associate with membranes. n=3. c, Co-immunoprecipitation of endogenous HK1 with endogenous KRAS4A (captured by MAb Y13–259) in colorectal tumor cells harboring oncogenic (GP5d) but not wild-type (HT55) KRAS. n=5.
Fig. 2. |
Fig. 2. |. Depalmitoylated KRAS4A interacts with HK1 on the outer mitochondrial membrane (OMM).
a, HA-tagged HK1 or HK2 were co-expressed in HEK293 cells with the indicated FLAG-tagged KRAS4A constructs. KRAS was immunoprecipitated with anti-FLAG beads and analyzed by immunoblot probed with anti-HA and anti-FLAG antibodies. n=3. b, GFP-tagged HK1 was expressed in HCT-116 cells treated with vehicle (Veh), 25 μM 2-bromopalmitate (2-BP) or 20 μM farnesyl transferase inhibitor (FTI). HK1-GFP was immunoprecipitated and blots were probed with an anti-pan-RAS antibody. n=2. c, U2OS cells expressing FLAG-KRAS4A12V,180S and HK1-GFP were treated with MitoTracker, fixed, stained for FLAG and GFP, and imaged by STORM super-resolution microscopy. Asterisk indicates an untransfected cell. Arrow indicates colocalization of KRAS4A and HK1 on OMM. Representative image of n=5.
Fig. 3. |
Fig. 3. |. The interaction between KRAS4A and HK1 is direct, GTP-dependent, mediated by an RBD-like region of HK1, and requires OMM localization.
a, Recombinant KRAS4A was loaded with GDP or GTPɣS, and then incubated with GST alone, GST-RAF1-RBD, or GST-HK1. Affinity capture was assessed by immunoblot for RAS. GST loading is shown by a Coomassie-stained gel. n=3. b, Recombinant KRAS4A, KRAS4B and RAC2 were loaded with GTPɣS, and then incubated with GST-PAK1-RBD, GST-RAF1-RBD, or GST-HK1. Affinity capture was assessed by immunoblots for RAS or RAC2. n=2. c, HA-tagged N-terminal domain of HK1 or the isolated, putative RBD (aa 76–206) were expressed with FLAG-tagged KRAS4A12V or RAC161L and FLAG immunoprecipitates were blotted as indicated. n=3. d, HA-tagged HK1 was co-expressed in HEK293 cells with FLAG-tagged KRAS4A12V or KRAS4B12V, HRAS12V, or RAC161L with or without N-terminal extension with the mitochondrial targeting sequence of HK1 (Mito; aa 1–16). The FLAG-tagged GTPases were immunoprecipitated and binding to HK1 was assessed with anti-HA antibody. n=4.
Fig. 4. |
Fig. 4. |. KRAS4A increases HK1 activity in vitro and in vivo.
a-c, Activity of recombinant full-length HK1 (a), C-terminal kinase domain of HK1 (b) or full-length HK2 (c). Reaction velocity is plotted (mean±SE) as a function of glucose concentration. Velocities ±2-DG (20 mM) are shown ±addition of recombinant, GTP-loaded RAC2 or KRAS4A. Plots combine independent assays, n=4 (a) or n=3 (b,c). d, WT (n=6) or HK1- or HK2-deficient (n=4) HEK293 cells were transfected with FLAG-tagged GFP, KRAS4B12V, or KRAS4A12V, and 24-h glucose consumption (mean±SE) was determined. Immunoblot shows relative expression. e, Glucose consumption (mean±SE) of parental and KRAS4A-targeted A549 (n=5) and SUIT2 (n=3) human cancer cells. f, Incorporation of 13C from glucose into lactate (mean±SE) over 15 min in SUIT2 cells ±KRAS exon 4A (n=3). Immunoblot shows absence of KRAS4A. d-f, Significance determined by two-sided student’s t-test (d-e paired; f unpaired). Growth rates of the two genotypes were equal over 24 hr assessment.

References

    1. Tsai FD et al. K-Ras4A splice variant is widely expressed in cancer and uses a hybrid membrane-targeting motif. Proc Natl Acad Sci U S A 112, 779–784, (2015). - PMC - PubMed
    1. Voice JK, Klemke RL, Le A & Jackson JH Four human ras homologs differ in their abilities to activate Raf-1, induce transformation, and stimulate cell motility. J Biol Chem 274, 17164–17170. (1999). - PubMed
    1. Kimmelman AC Metabolic Dependencies in RAS-Driven Cancers. Clin Cancer Res 21, 1828–1834, (2015). - PMC - PubMed
    1. Ying H et al. Oncogenic Kras maintains pancreatic tumors through regulation of anabolic glucose metabolism. Cell 149, 656–670, (2012). - PMC - PubMed
    1. Kerr EM, Gaude E, Turrell FK, Frezza C & Martins CP Mutant Kras copy number defines metabolic reprogramming and therapeutic susceptibilities. Nature 531, 110–113, (2016). - PMC - PubMed

Publication types

MeSH terms