. 2020 Jan;577(7788):103-108.
doi: 10.1038/s41586-019-1828-5. Epub 2019 Dec 11.

Mutations that prevent caspase cleavage of RIPK1 cause autoinflammatory disease

Affiliations

Mutations that prevent caspase cleavage of RIPK1 cause autoinflammatory disease

Najoua Lalaoui et al. Nature. 2020 Jan.

Abstract

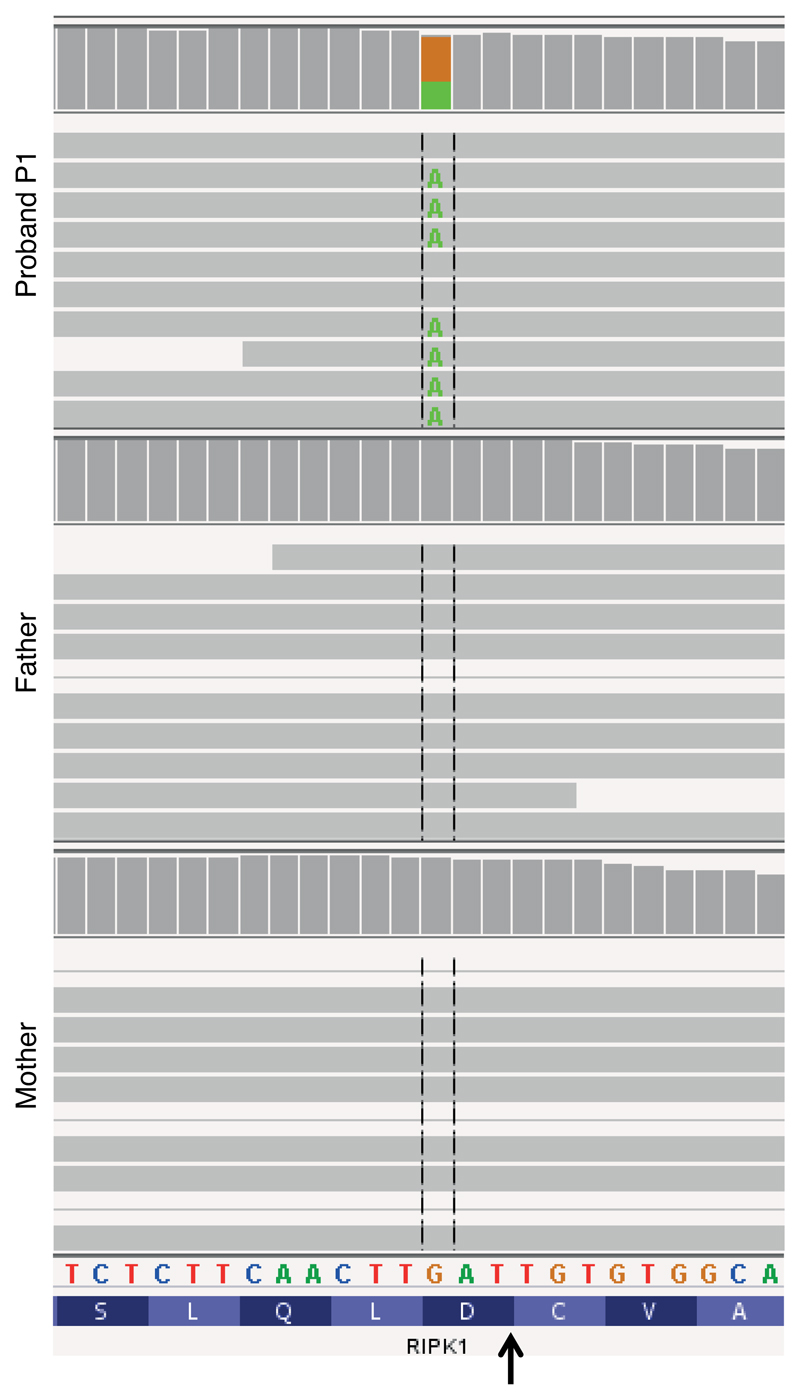
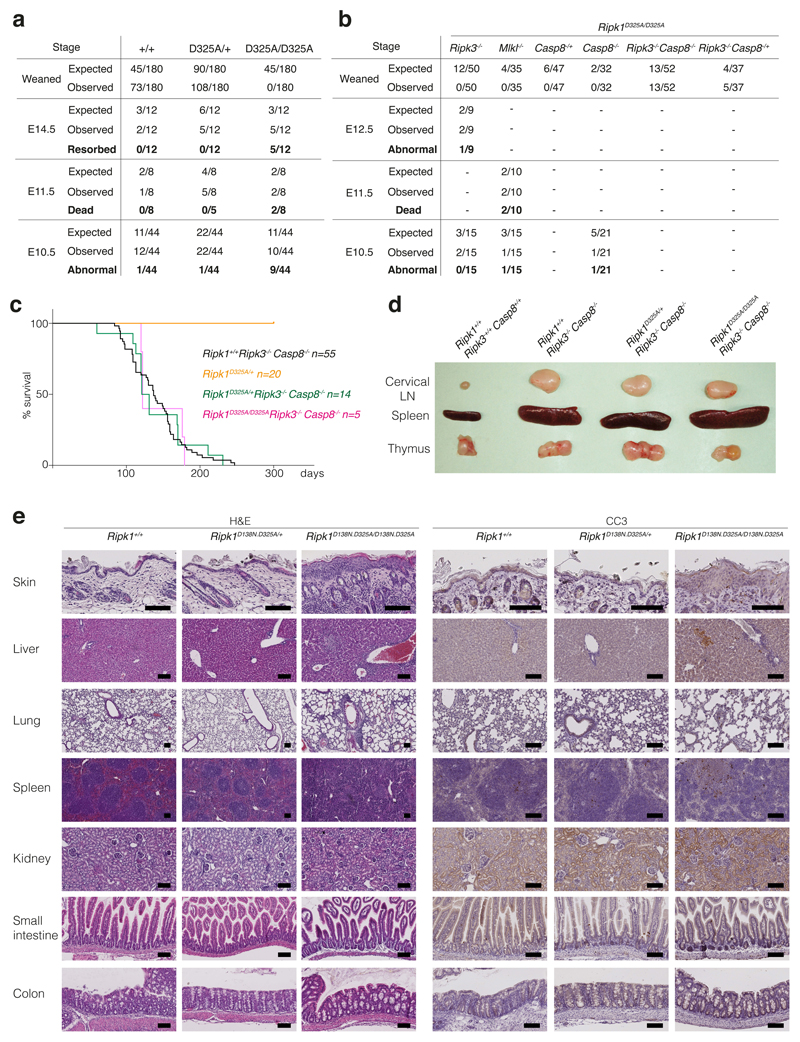
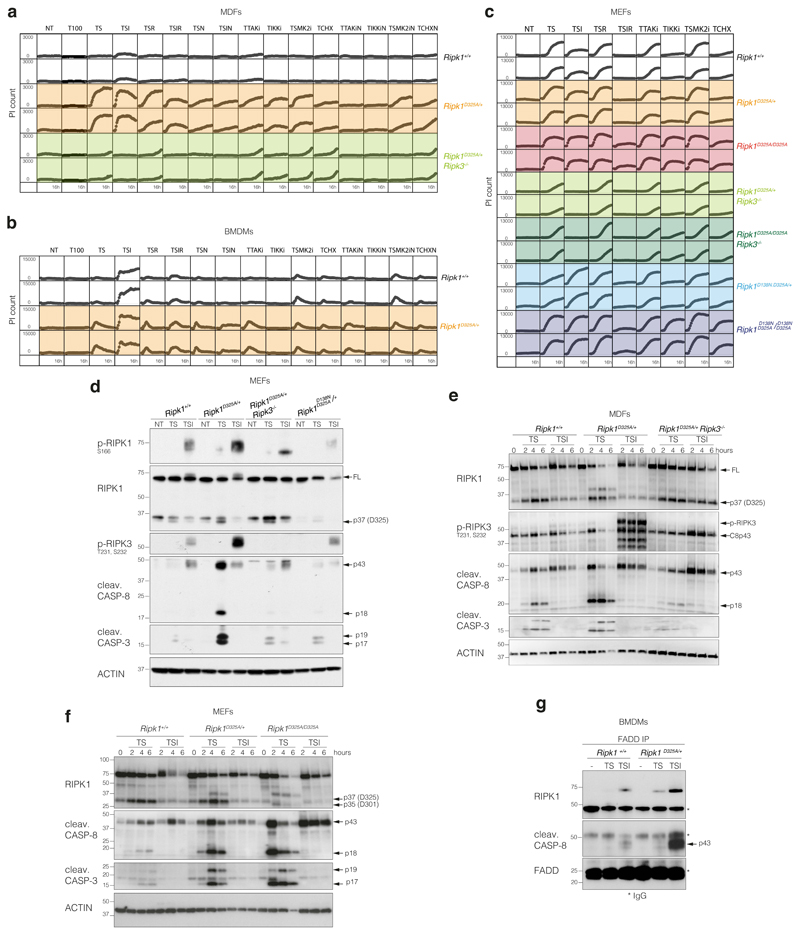
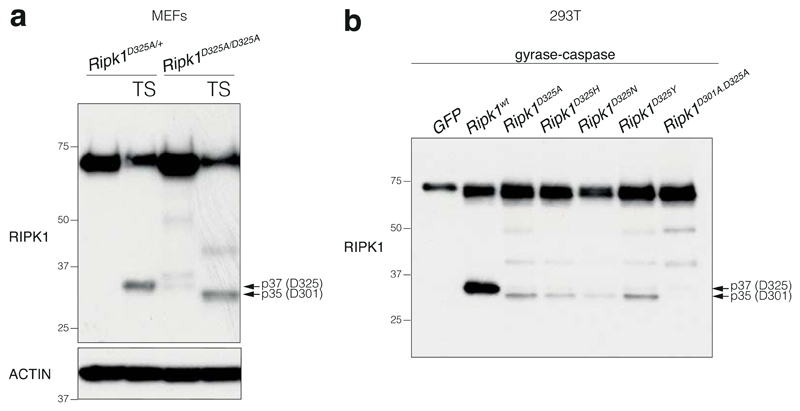
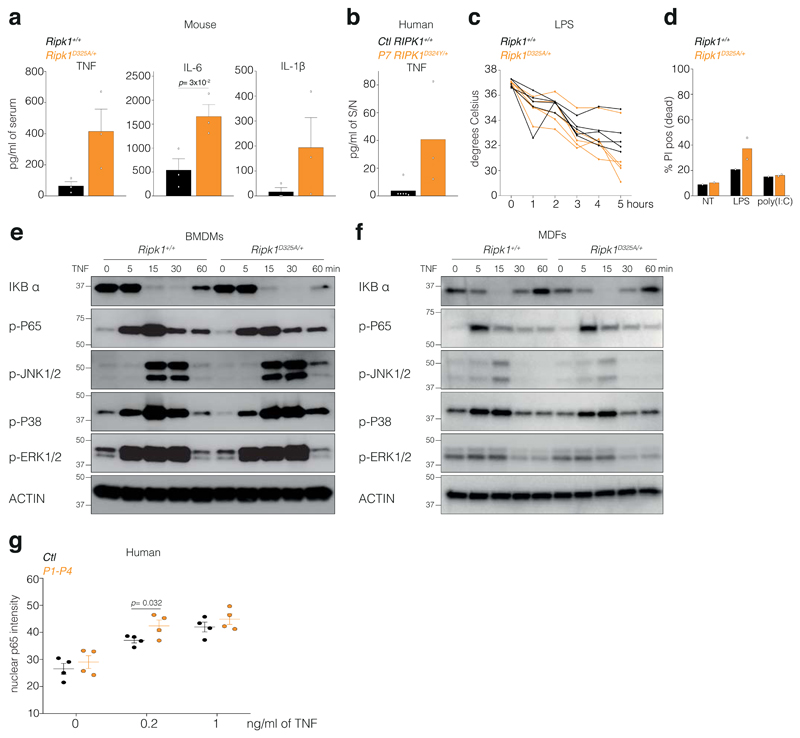
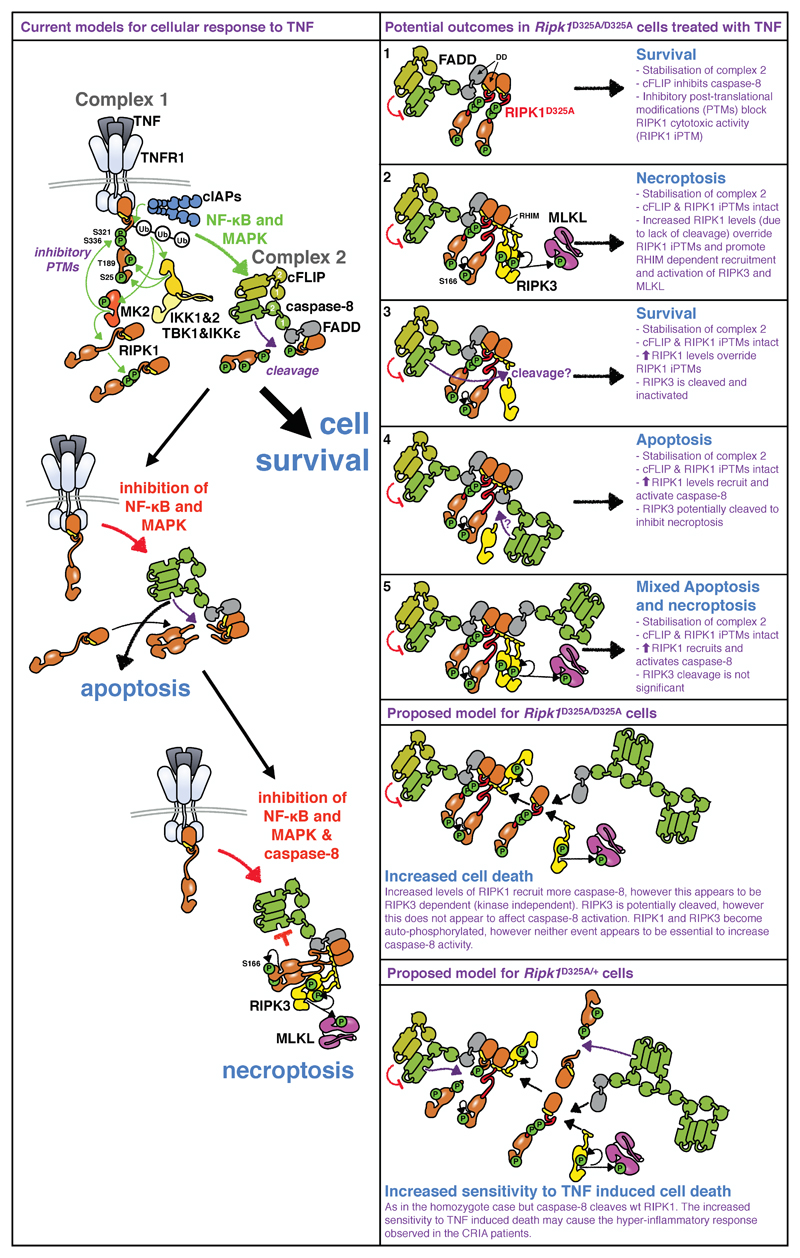
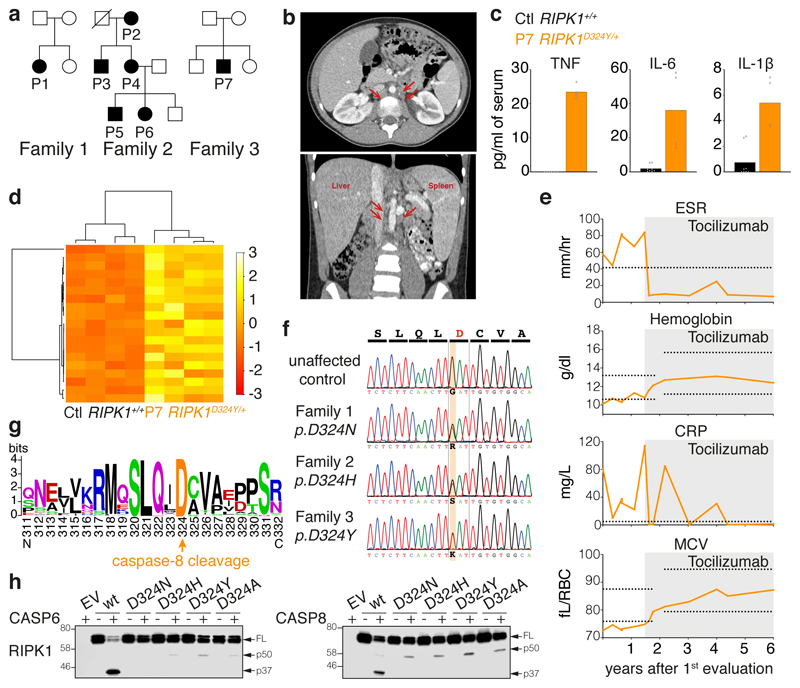
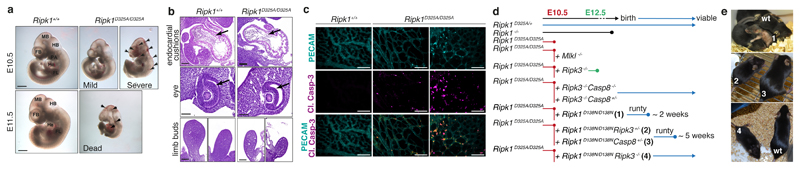
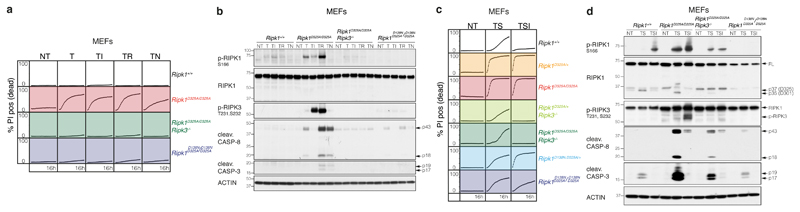
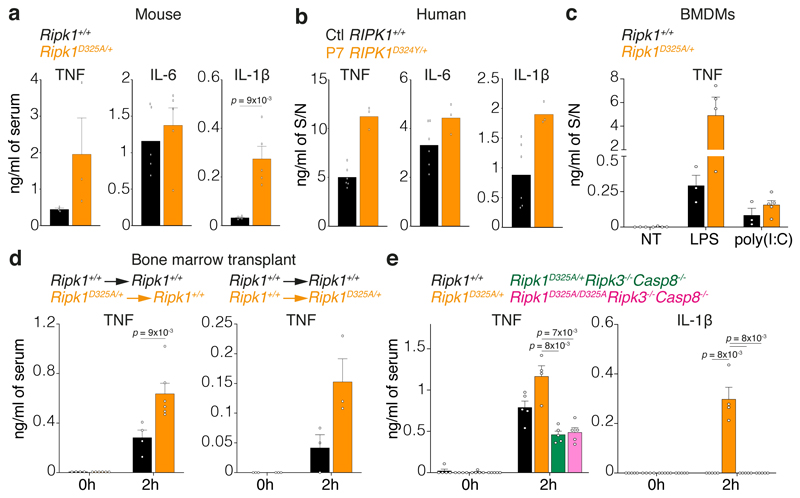
RIPK1 is a key regulator of innate immune signalling pathways. To ensure an optimal inflammatory response, RIPK1 is regulated post-translationally by well-characterized ubiquitylation and phosphorylation events, as well as by caspase-8-mediated cleavage1-7. The physiological relevance of this cleavage event remains unclear, although it is thought to inhibit activation of RIPK3 and necroptosis8. Here we show that the heterozygous missense mutations D324N, D324H and D324Y prevent caspase cleavage of RIPK1 in humans and result in an early-onset periodic fever syndrome and severe intermittent lymphadenopathy-a condition we term 'cleavage-resistant RIPK1-induced autoinflammatory syndrome'. To define the mechanism for this disease, we generated a cleavage-resistant Ripk1D325A mutant mouse strain. Whereas Ripk1-/- mice died postnatally from systemic inflammation, Ripk1D325A/D325A mice died during embryogenesis. Embryonic lethality was completely prevented by the combined loss of Casp8 and Ripk3, but not by loss of Ripk3 or Mlkl alone. Loss of RIPK1 kinase activity also prevented Ripk1D325A/D325A embryonic lethality, although the mice died before weaning from multi-organ inflammation in a RIPK3-dependent manner. Consistently, Ripk1D325A/D325A and Ripk1D325A/+ cells were hypersensitive to RIPK3-dependent TNF-induced apoptosis and necroptosis. Heterozygous Ripk1D325A/+ mice were viable and grossly normal, but were hyper-responsive to inflammatory stimuli in vivo. Our results demonstrate the importance of caspase-mediated RIPK1 cleavage during embryonic development and show that caspase cleavage of RIPK1 not only inhibits necroptosis but also maintains inflammatory homeostasis throughout life.


Conflict of interest statement

Competing Interests. All authors declare no competing interests

Figures

Extended Data Figure 1
Extended Data Figure 1. Inflammatory gene signature in P7 whole blood RNA.
a, MA-plot between two P7 samples and two unrelated adolescent healthy controls, both sequenced with technical duplicates. TCC-edgeR package of R followed by adjustment for multiple comparisons detected 1394 differentially expressed genes (false discovery rate <0.05), with 903 genes upregulated in P7, and 491 genes downregulated in P7. b, Representative gene ontology terms associated with immune signalling.
Extended Data Figure 2
Extended Data Figure 2. Exome reads in family 1.
Excerpts of coverage histograms and aligned exome sequence reads for the proband and her parents in family 1, displayed using the Integrative Genomics Viewer, demonstrate de novo occurrence of the c.970G>A (p.D324N) missense mutation in the LXXD caspase-6/8 cleavage motif preceding the cleavage site (arrow). Paternity and maternity were confirmed using Mendelian inheritance error rates from the same exome data.
Extended Data Figure 3
Extended Data Figure 3. ‘Kinase-dead’ RIPK1 or combined loss of Ripk3 and Casp8 rescue Ripk1D325A/D325A lethality.
a, b, Observed numbers of offspring from Ripk1D325A/+ intercrosses and numbers expected from Mendelian ratios at the indicated stage of development. Ripk1D325A/D325A mice are E10.5. All observed E11.5 Ripk1D325A/D325A embryos were dead and most of the E10.5 Ripk1D325A/D325A embryos were abnormal as described in Fig. 2a-b. Loss of Ripk3 rescued to E12.5, however 50% of the embryos were abnormal. None of the Ripk1D325A/D325ARipk3-/- mice were born. All observed E11.5 Ripk1D325A/D325AMlkl-/- embryos were dead showing that loss of Mlkl did not provide any protection. All Ripk1D325A/D325ARipk3-/-Casp8-/- mice were born and developed ALPS due to loss of Casp8. c, Kaplan-Meyer survival curves of the indicated genotypes. d, Cervical lymph nodes (LN), spleen and thymus of 17-week-old mice of the indicated genotypes. Picture are representative of 5 mice per genotype. e, Tissue sections of 18 day old Ripk1D138N.D325A/+, Ripk1D138N.D325A/D138N.D325A and control mice stained with H&E (left panel) and anti-CC3 (brown, right panel). Picture are representative of 2 mice per genotype.
Extended Data Figure 4
Extended Data Figure 4. Ripk1D325A/+ cells are hypersensitive to TNF-induced death.
a, MDFs b, BMDMs and c, MEFs of the indicated genotypes were treated with either high dose of TNF (T100; 100 ng/ml) or low dose of TNF (T; 10 ng/ml) combined with Smac-mimetic (S; 100 nM), caspase inhibitor (I; 5 μM), RIPK3 inhibitor (R; 1 μM), Necrostatin (N; 10 μM), TAK1 inhibitor (TAKi; 100 nM), IKK inhibitor (IKKi; 100 nM), MK2 inhibitor (MK2i; 2 μM) or cycloheximide (1 μg/ml) for 16 hours. Cell death was quantified by PI uptake and time-lapse imaging every 30-45 minutes by time-lapse imaging using the IncuCyte®. Graphs show PI staining over time and for each genotype duplicates are shown. Graphs are representative of three (MEFs and MDFs) and two (BMDMs) biologically independent cell lines per genotype repeated independently. d, MEFs were treated as in Fig. 3d for 2 hours. e, MDFs and f, MEFs were treated Fig. 3d for the indicated times. d-f, results are representative of 2 independent experiments. β-Actin loading control performed after cleaved caspase-8. g, BMDMs were treated with TNF (T; 100 ng/ml) combined with Smac-mimetic (S; 500 nM) with or without caspase inhibitor (I; 5 μM), for 90 minutes, lysates were immunoprecipitated with anti-FADD. Results are representative of 2 independent experiments. d-g, For gel source data, see Supplementary Figure 2.
Extended Data Figure 5
Extended Data Figure 5. Alternative cleavage of RIPK1.
a, MEFs were treated with TNF (T; 10 ng/ml) combined with Smac-mimetic (S; 500 nM) for 2 hours. b, Inducible doxycycline caspase-8-gyrase, mouse RIPK1 wild type and mutants constructs or GFP were co-expressed in 293T. Cells were treated for 2 hours with 1 μg/ml doxycycline to induce caspase-8-gyrase expression and then for 2 hours with 700 nM coumermycin to dimerize caspase-8-gyrase. Antibody recognising the N-terminal end of RIPK1 was used. Results are representative of 2 a, b, Results are representative of 4 (a) and 2 (b) independent experiments. For gel source data, see Supplementary Figure 2.
Extended Data Figure 6
Extended Data Figure 6. RIPK1 cleavage limits inflammation in an NF-κB independent manner.
a, Serum cytokine levels in wild type and Ripk1D325A/+ mice treated for 3 hours with 50 μg of poly(I:C). Each dot represents a mouse. Graph shows mean ± SEM, n = 3 mice. Unpaired, two-tailed t-test. b, TNF levels in the supernatant (S/N) of 2 unrelated adolescent controls (Ctl RIPK1+/+) and P7 RIPK1D324Y/+ PBMCs treated for 3 hours with 5 μg/ml of poly(I:C). Graph shows mean of triplicates. c, Body temperature of mice of the indicated genotypes after injection of 2 mg/kg of LPS. Each line represent a mouse, n = 5 mice genotype. d, BMDMs of the indicated genotypes were treated for 24 hours with 25 ng/ml of LPS or with 2.5 μg/ml of poly(I:C). Cell death was quantified with PI staining and flow cytometry. Each dot represents a biological repeat. Graph shows mean, n = 1 for Ripk1+/+ and n = 2 for Ripk1D325A/+. e, BMDMs and f, MDFs were treated with 100 ng/ml of TNF for the indicated times. Results are representative of 2 independent experiments. β-Actin loading control performed after p-ERK1/2. For gel source data, see Supplementary Figure 2. g, NF-κB activation in patient skin biopsy-derived fibroblasts was assessed by measuring nuclear translocation of subunit p65. Each dot represents the median of > 1000 single cell measurements of nuclear mean p65 fluorescent intensities for one individual subject. Graph shows mean ± SD n = 4 patients and 4 controls. Unpaired, one-tailed, t-test.
Extended Data Figure 7
Extended Data Figure 7. Proposed model for RIPK1 D325A-induced cell death
TNF binding to TNFR1 triggers complex I formation, in which RIPK1 is ubiquitylated and phosphorylated. These post-translational modifications (PTMs) inhibit RIPK1's cytotoxic activity. Complex I formation activates NF-κB and MAPK-dependent survival genes including cFlar encoding cFLIP. Subsequently, a cytosolic Complex II containing FADD, caspase-8, RIPK1, and cFLIP is formed. In this complex cFLIP, inhibits caspase-8 activity so that a restricted number of substrates, such as RIPK1, are cleaved, but others, such as pro-caspase-3 are not. Cleavage of RIPK1 dismantles Complex II. Activation of NF-κB and MAPK signalling pathways and PTM of RIPK1 combined prevent TNF inducing cell death (left panel top part). Inhibition of NF-κB or MAPK signalling pathways reduces cFLIP levels and accelerates formation of Complex II, and cells die through apoptosis (left panel middle part). When NF-κB/MAPK signalling is disrupted in caspase-8 deficient conditions, RIPK1 is not cleaved and auto-phosphorylates triggering the recruitment of RIPK3 and its auto-phosphorylation. RIPK3 phosphorylates MLKL and necroptosis occurs (left panel bottom part). According to this model, lack of RIPK1 cleavage could result in several distinct outcomes. 1. it stabilises Complex II, however, the presence of cFLIP and RIPK1’s inhibitory PTMs prevent caspase-8 from killing. 2. The accumulation of ‘uncleavable’ RIPK1 recruited to Complex II overrides the inhibitory RIPK1 PTMs. RIPK1 auto-phosphorylates and recruits RIPK3 leading to necroptosis. 3. Alternatively, RIPK1 accumulation results in activated caspase-8 that cleaves RIPK3 and cells survive. 4. Or, stabilisation of Complex II results in recruitment and activation of caspase-8 that induces apoptosis and possibly prevents necroptosis by cleaving RIPK3. 5. Finally, the accumulation of RIPK1 results in activation of both RIPK3 and caspase-8 and therefore induces both an apoptotic and necroptotic cell death. How do these potential outcomes match with our data? In homozygote Ripk1D325A cells, both caspase-8 and RIPK3 are activated upon TNF suggesting that apoptosis and necroptosis occur at the same time (Fig. 2d and Fig. 3a, b). However, surprisingly, according to these models, loss of RIPK3 limits caspase-8 activation (Fig. 3a, b). This suggests that recruitment of RIPK3 into complex II increases the recruitment and activation of caspase-8. A precedent for this observation comes from experiments utilising RIPK3 inhibitors, that were shown to promote RIPK1 dependent caspase-8 activation,, in a mode that we would term "reverse activation". In our experiments however RIPK3 activation occurs downstream of TNF signalling, suggesting that reverse activation might represent a physiological amplification loop that increases caspase-8 activation. Yet, this requirement for RIPK3 is not present in all cells as embryonic lethality of the RIPK1 cleavage mutant is only partially rescued by loss of Ripk3. In the heterozygote Ripk1D325A cells, caspase-8 cleaves wild type RIPK1 limiting TNF induced cell death when compared to homozygote cells. However, reduction of cFLIP and/or RIPK1’s PTM by treatment with IAP, TAK1, IKK or translational inhibitors decreases the threshold of TNF sensitivity (Extended Data Fig. 4). This may cause the hyper-inflammatory response observed in the CRIA patients (Fig. 1).
Figure 1
Figure 1. Heterozygous mutations of the RIPK1 caspase-8 cleavage site cause autoinflammatory disease.
a, Affected individuals (filled symbols) in three families carried mutations in RIPK1 D324. Crossed symbol indicates a deceased individual. b, Axial (left) and coronal (right) planes of abdominal computerized tomography scans of P1 at age 11, after 2 months on tocilizumab but prior to substantial resolution of symptoms, revealing periaortic lymphadenopathy (arrows), splenomegaly (14 cm craniocaudal length), and liver at upper limit of normal (16 cm craniocaudal length). c, Serum cytokine levels of two P7 samples taken within 1 week, both during infliximab and prior to tocilizumab treatment, and 4 unrelated adolescent controls. Dots are from technical duplicates for each time point. Graphs show mean. d, RNA sequencing of whole blood RNA from P7 (two time points, as in Fig. 1c) and 2 unrelated adolescent healthy controls, both with technical duplicates. Heatmap shows differentially expressed inflammatory response genes (GO:0006954). For gene names, see Supplementary Figure 1. e, Response to tocilizumab infusion in P1. Erythrocyte Sedimentation Rate (ESR), C-Reactive Protein (CRP), hemoglobin, and Mean Corpuscular Volume (MCV) were measured serially before and after initiation of tocilizumab treatment (grey shading). X-axis denotes time following the initial evaluation of this subject at age 10 years. Horizontal lines indicate high values (ESR and CRP) or high and low values (hemoglobin and MCV) for the subject age-specific laboratory reference ranges for these markers. f, RIPK1 DNA sequence chromatograms show heterozygous single-base substitutions. g, Weblogo demonstrating conservation of the caspase-8 cleavage tetrapeptide motif in RIPK1 (human numbering) in 184 vertebrate species. h, In vitro caspase assays on wild type and RIPK1 mutants. Western blots are representative of 2 independent experiments. For gel source data, see Supplementary Figure 2.
Figure 2
Figure 2. Homozygous mutation of the RIPK1 caspase-8 cleavage site in mice causes early embryonic lethality.
a, E10.5 embryos representative of 4 embryos per genotype. FB, forebrain; MB, midbrain; HB, hindbrain; He, heart; FL, forelimb; PA, pharyngeal arches. Arrows show sites of hemorrhage. Scale bar is 900 μm for E10.5 and 1400 μm for E11.5. b, Hematoxylin and Eosin stained section of E10.5 embryos representative of 3 embryos per genotype. Arrows show endocardial cushions (top panel) and neural retina (middle panel). Scale bar is 200 μm. c, E10.5 yolk sacs stained with anti-PECAM-1 (cyan) and anti-cleaved caspase-3 (Cl. Casp-3; magenta) antibodies. Images with severely and less severely disrupted vasculature are shown. Scale bar is 50 μm. Images are representative of 4 embryos per genotype. d, Diagram depicting the extent of viability of different strains of Ripk1D325A mice. e, Representative pictures of 3 mice per genotype numbered in d.
Figure 3
Figure 3. Ripk1D325A/D325A and Ripk1D325A/+ cells are hypersensitive to TNF-induced death.
a, c, Cell death of MEFs monitored by time-lapse imaging over 16 hours. a, T; 100 ng/ml of TNF. c, T; 10 ng/ml of TNF, S; 100 nM of Smac-mimetic. a, c, NT; untreated, I; 5 μM of caspase-8 inhibitor, R; 1 μM of RIPK3 inhibitor, N; 10 μM of Necrostatin. Graphs are representative of 4 independent experiments performed with 2 biological repeats per genotype. b, d, Western blot of MEFs b, treated as in (a) for 2 hours, and d, as in (c) for 2 hours. Results are representative of 2 independent experiments. β-Actin loading control performed after cleaved caspase-8. For gel source data, see Supplementary Figure 2.
Figure 4
Figure 4. RIPK1 cleavage limits inflammation in vivo.
a, Serum cytokine levels after 2 hours treatment with 2 mg/kg of LPS. Graph show mean ± SEM, n = 3 mice for TNF and n = 5 mice for IL-6 and IL-1β. b, Cytokine levels in the supernatant (S/N) of 2 unrelated adolescent controls (Ctl RIPK1+/+) and P7 RIPK1D324Y/+ PBMCs treated for 3 hours with 10 ng/ml of LPS. Graph shows mean of triplicates. c, TNF levels in the supernatant (S/N) of BMDMs treated for 24 hours with 25 ng/ml of LPS or with 2.5 μg/ml of poly(I:C). Graph shows mean ± SEM, n = 3 for Ripk1+/+ and n = 3-4 for Ripk1D325A/+. d, Serum TNF levels in wild type mice reconstituted with Ripk1D325A/+ hematopoietic cells (left panel) or Ripk1D325A/+ mice reconstituted with wild type hematopoietic cells mice treated 2 hours with 2 mg/kg of LPS. Graph shows mean ± SEM, n = 3 and 4 Ripk1+/+Ripk1+/+, n = 6 Ripk1D325A/+Ripk1+/+, n = 3 for Ripk1+/+Ripk1D325A/+ mice/genotype. e, Serum cytokines levels after 2 hours treatment with 2 mg/kg of LPS. Graph shows mean ± SEM, n = 4 for Ripk1D325A/+, n = 5 for the other genotypes a, c, and e, Results are representative of 2 independent experiments. a, c, d and e, Each dot represents a mouse. a, d and e, Unpaired, two-tailed t-test.

References

    1. Bertrand MJM, et al. cIAP1 and cIAP2 facilitate cancer cell survival by functioning as E3 ligases that promote RIP1 ubiquitination. Mol Cell. 2008;30:689–700. - PubMed
    1. Dondelinger Y, et al. MK2 phosphorylation of RIPK1 regulates TNF-mediated cell death. Nat Cell Biol. 2017;19:1237–1247. - PubMed
    1. Dondelinger Y, et al. NF-kappaB-Independent Role of IKKalpha/IKKbeta in Preventing RIPK1 Kinase-Dependent Apoptotic and Necroptotic Cell Death during TNF Signaling. Mol Cell. 2015;60:63–76. - PubMed
    1. Jaco I, et al. MK2 Phosphorylates RIPK1 to Prevent TNF-Induced Cell Death. Mol Cell. 2017;66:698–710. - PMC - PubMed
    1. Feltham R, et al. Mind Bomb Regulates Cell Death during TNF Signaling by Suppressing RIPK1's Cytotoxic Potential. Cell Rep. 2018;23:470–484. - PMC - PubMed

Publication types

MeSH terms