. 2019 Dec;576(7787):487-491.
doi: 10.1038/s41586-019-1825-8. Epub 2019 Dec 11.

Multi-omics profiling of mouse gastrulation at single-cell resolution

Affiliations

Multi-omics profiling of mouse gastrulation at single-cell resolution

Ricard Argelaguet et al. Nature. 2019 Dec.

Abstract

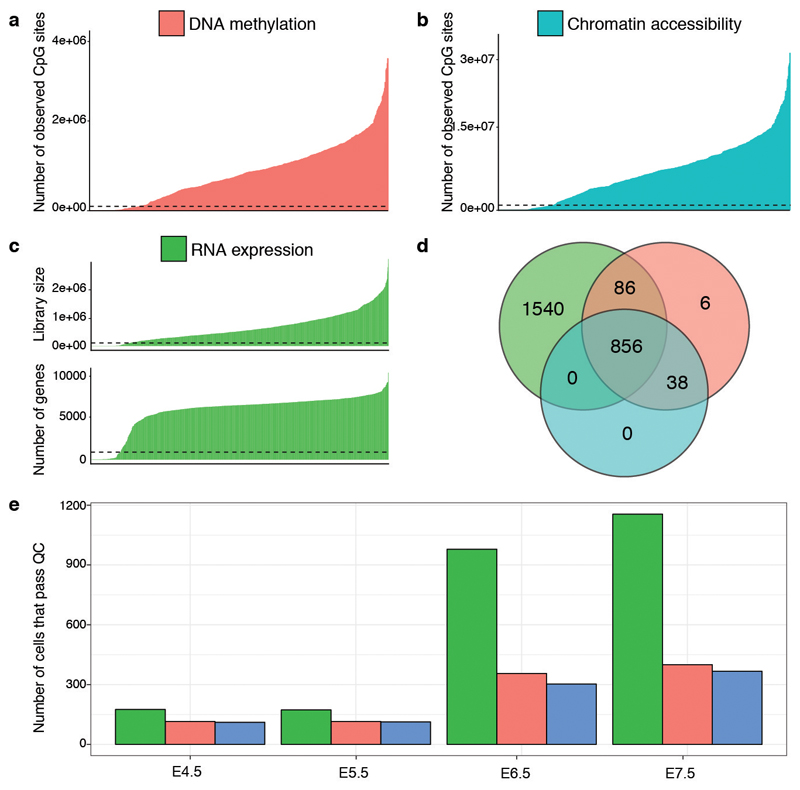
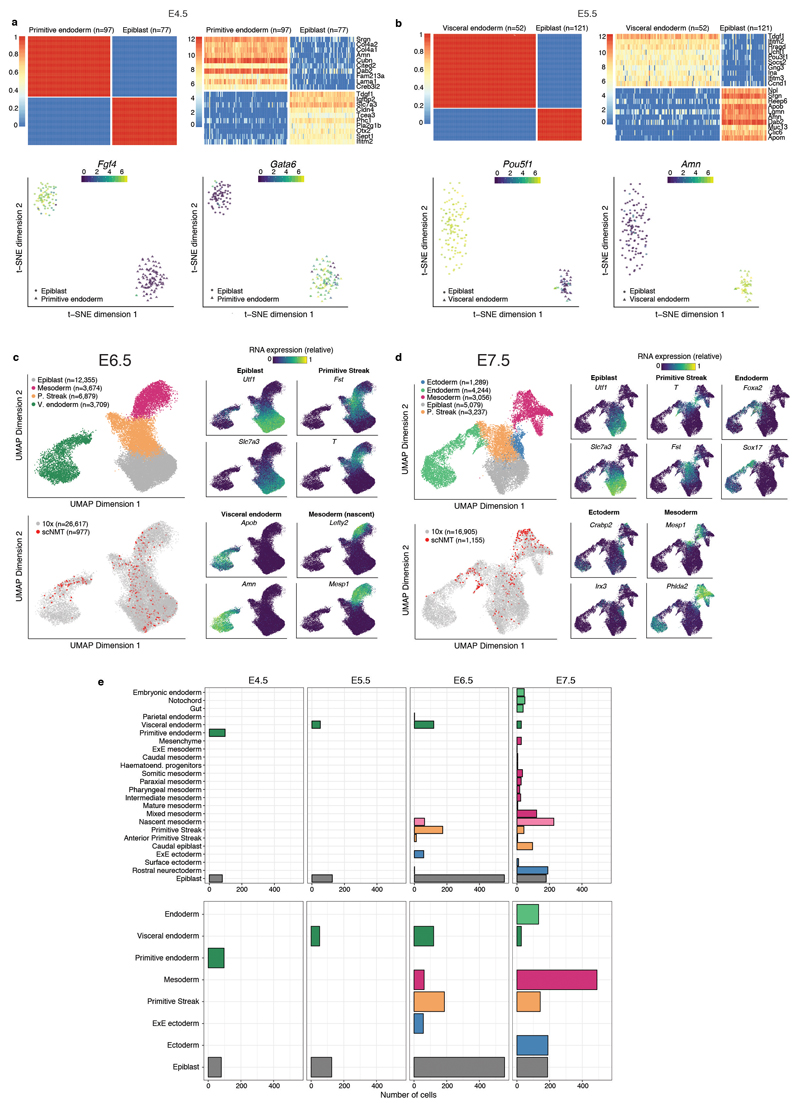
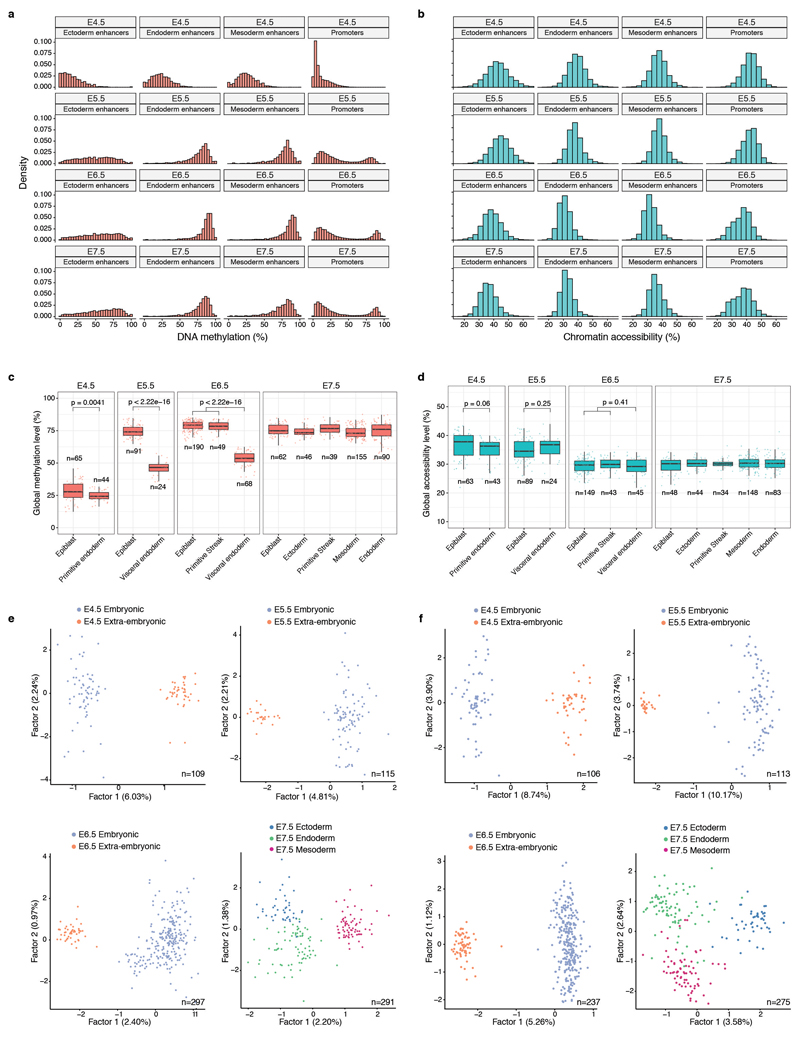
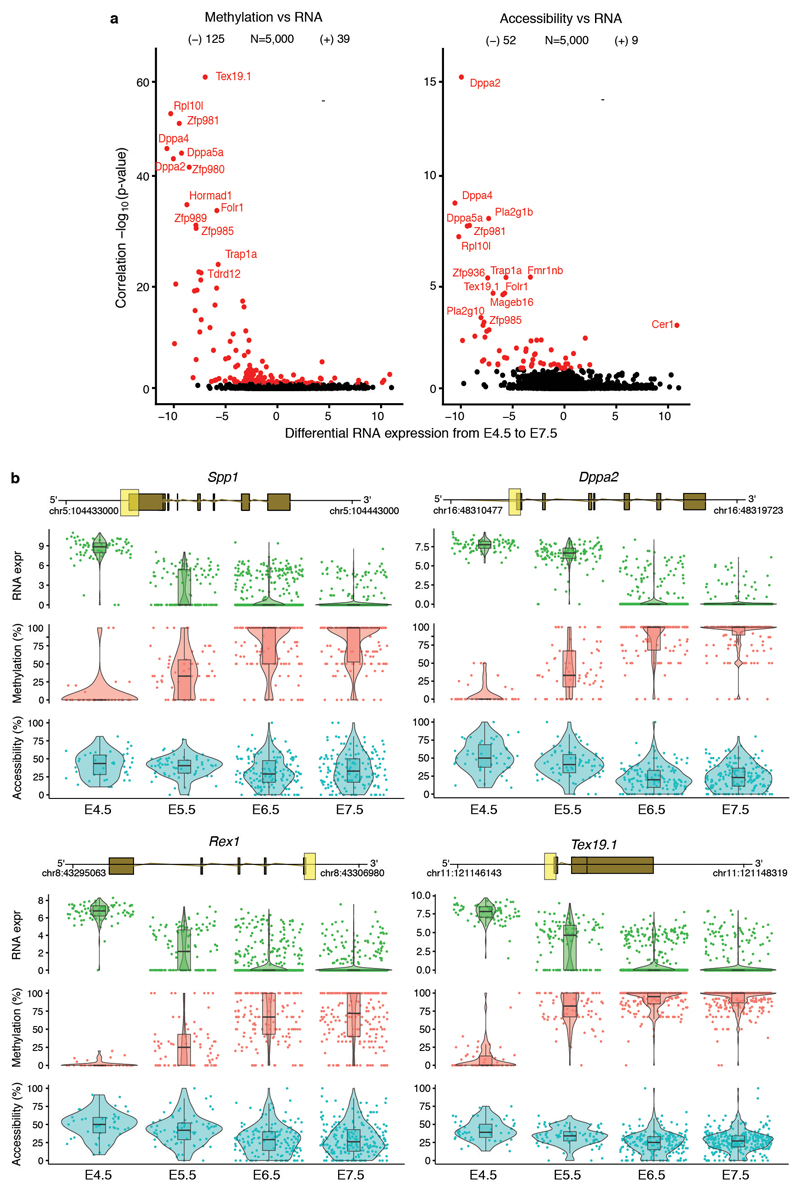
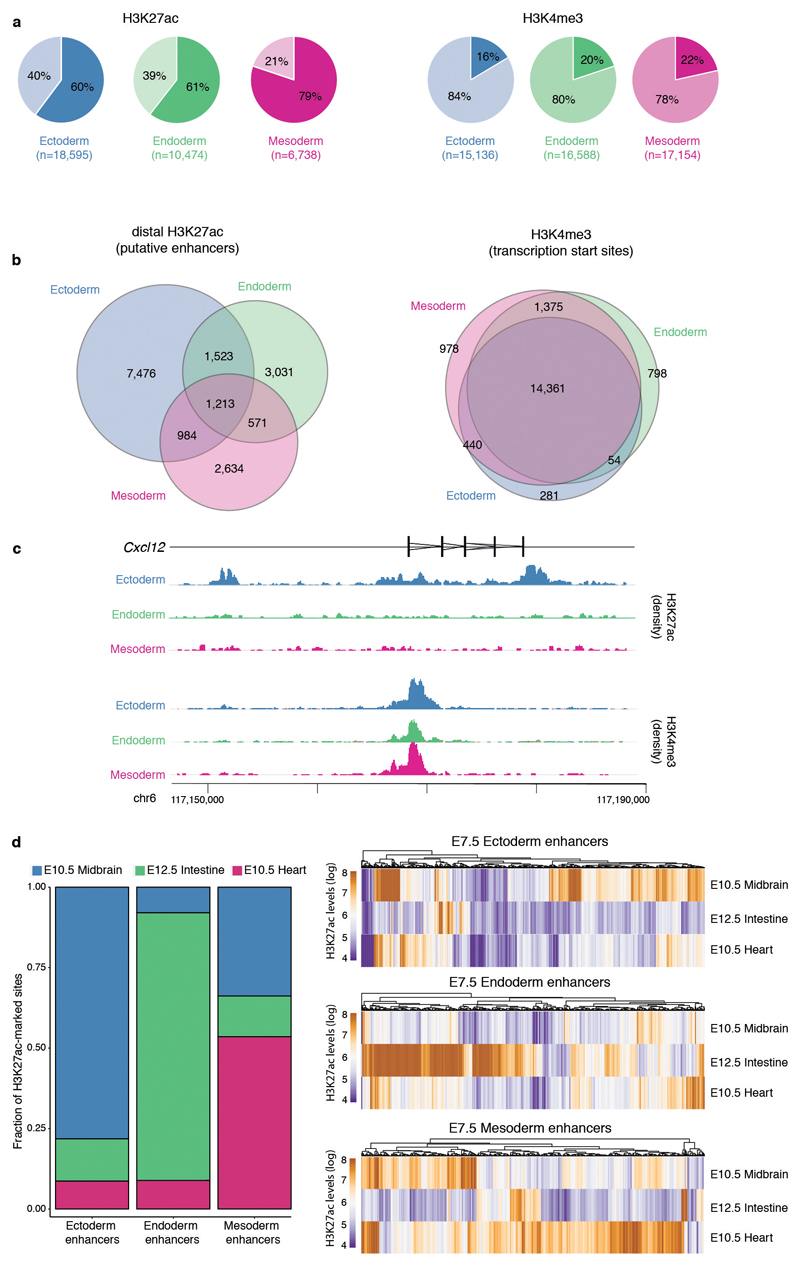
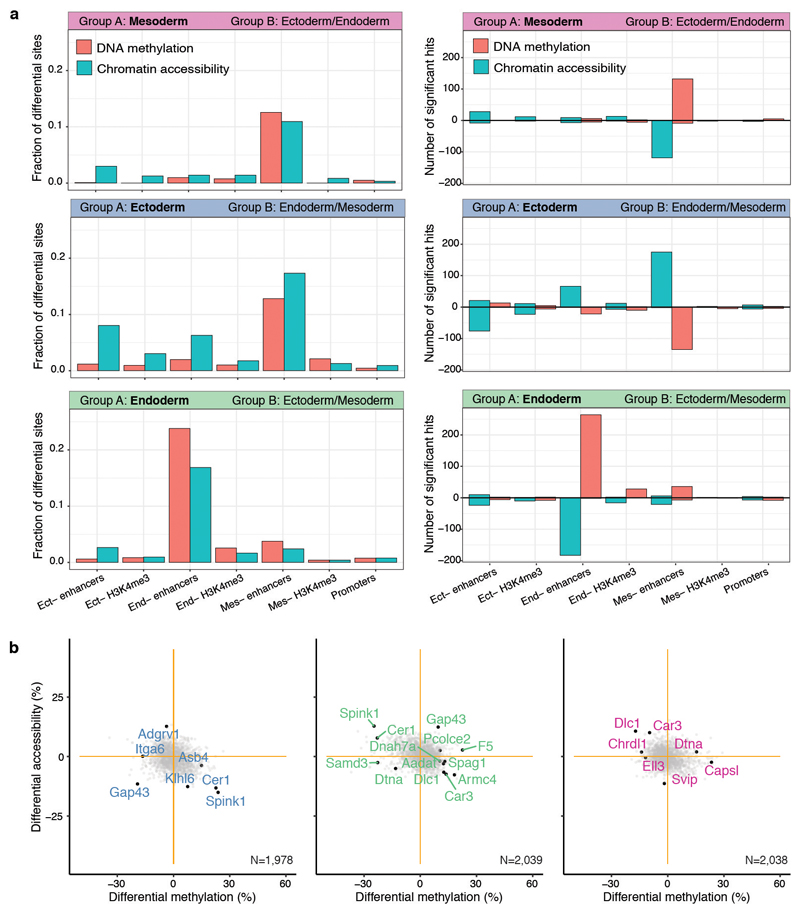
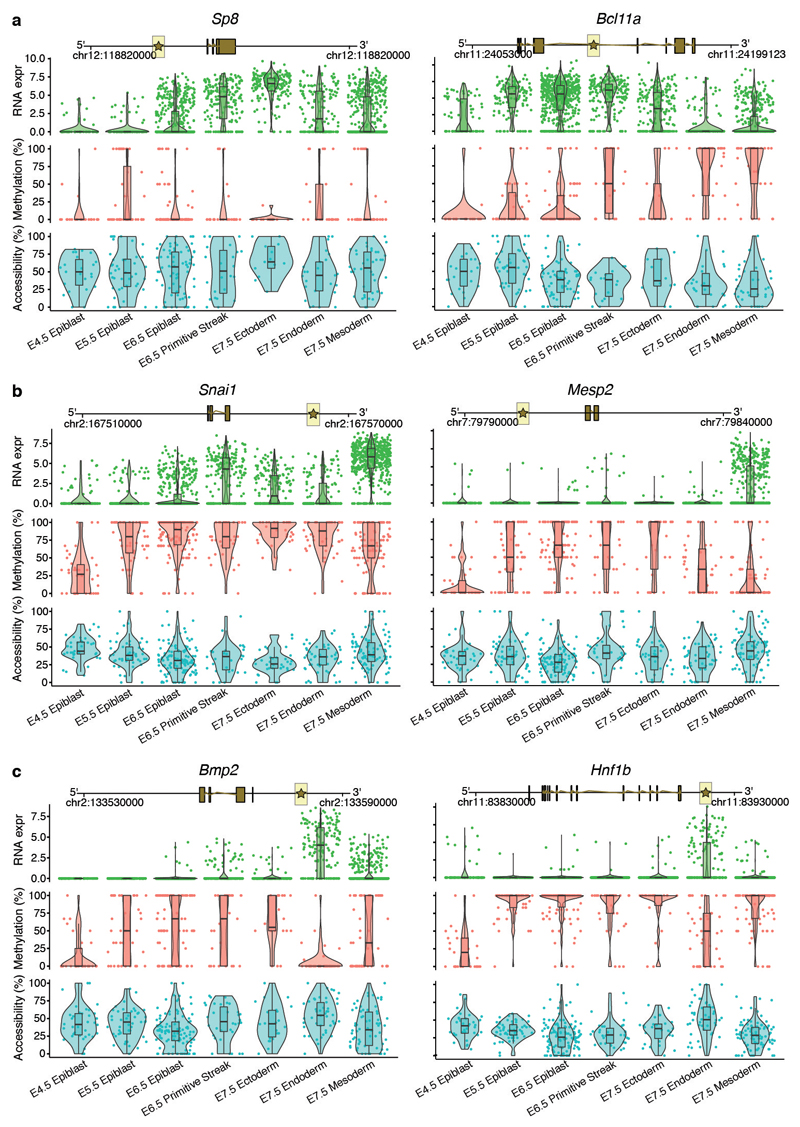
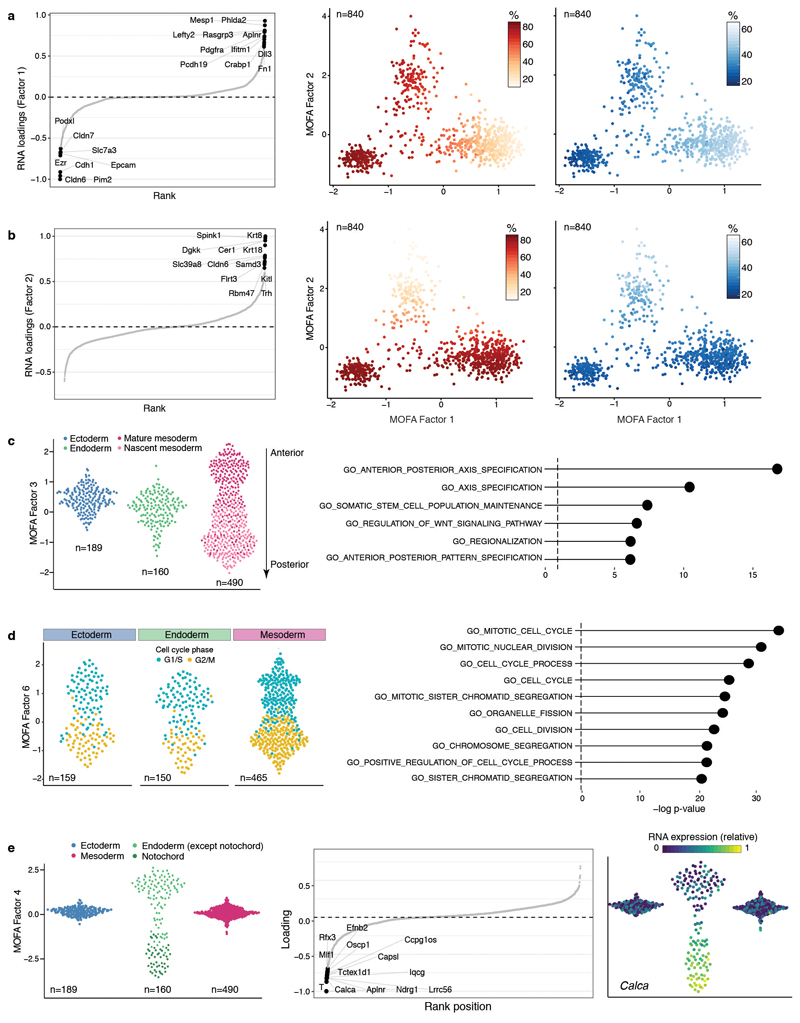
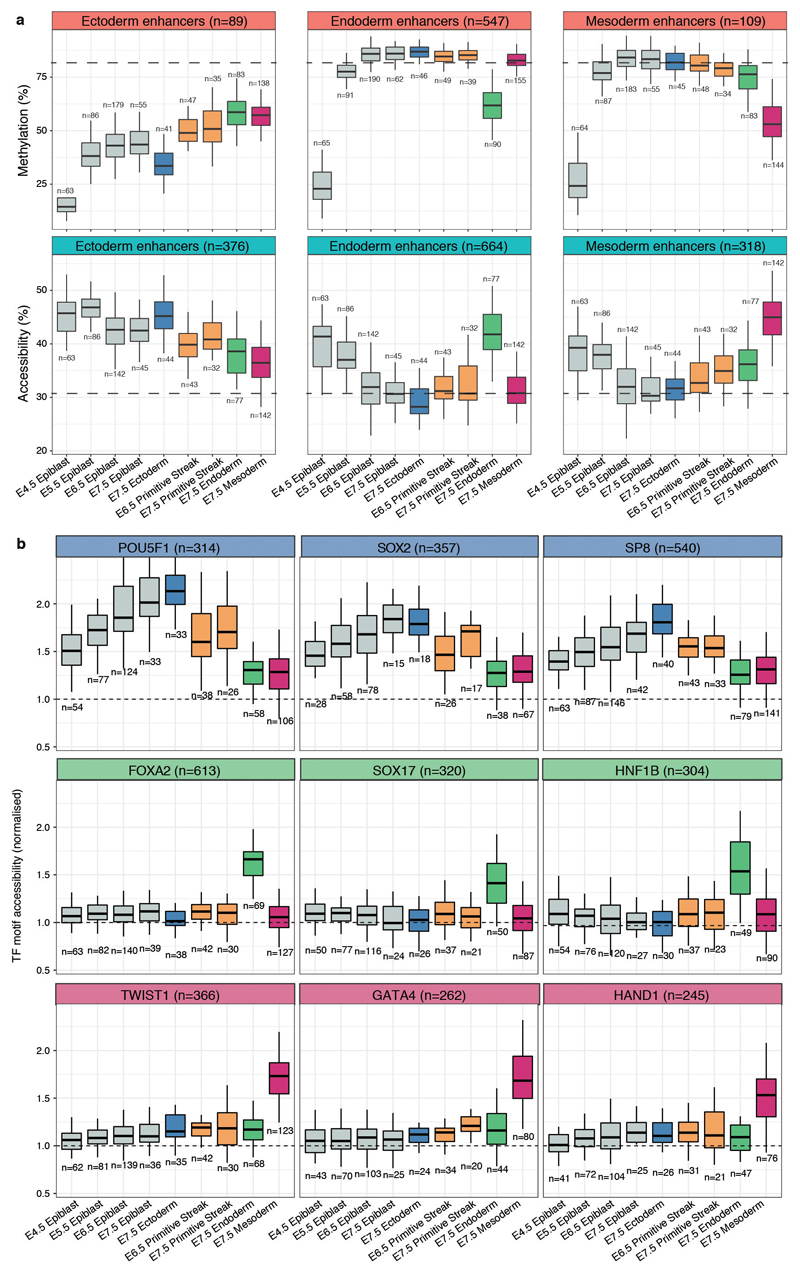
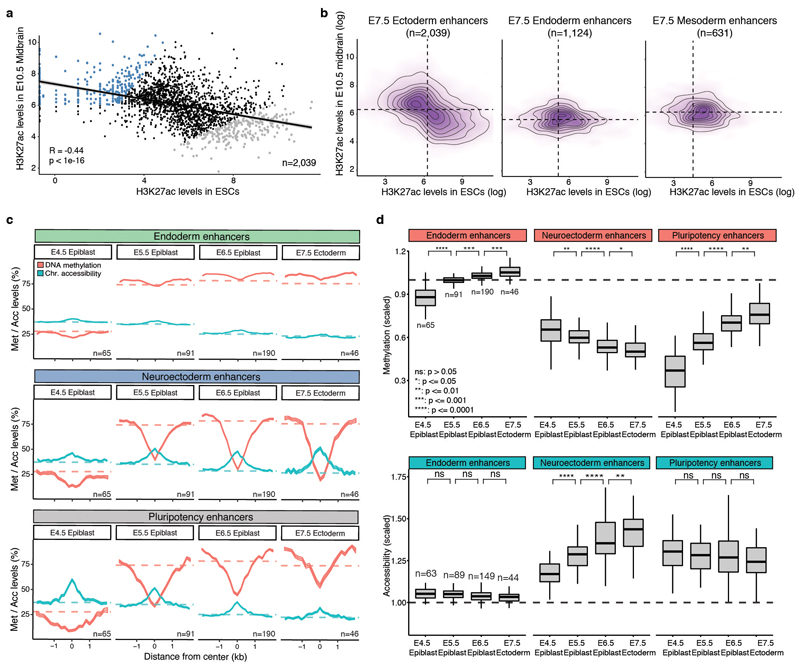
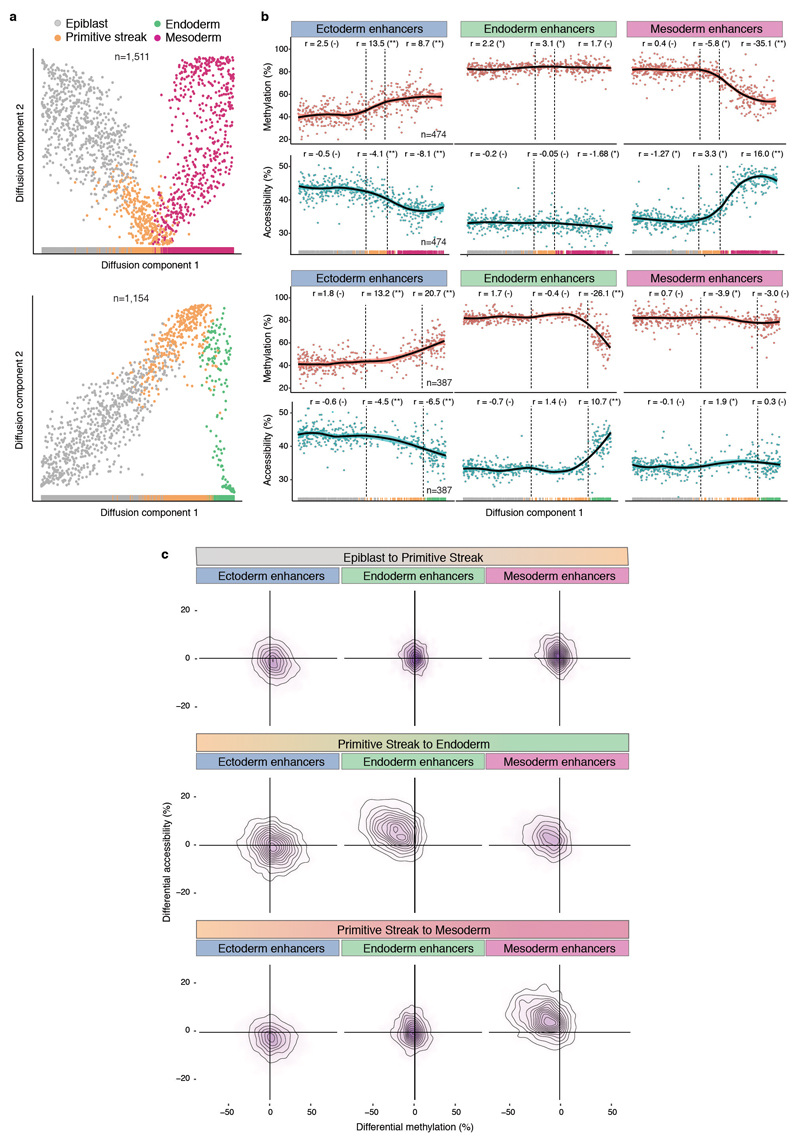
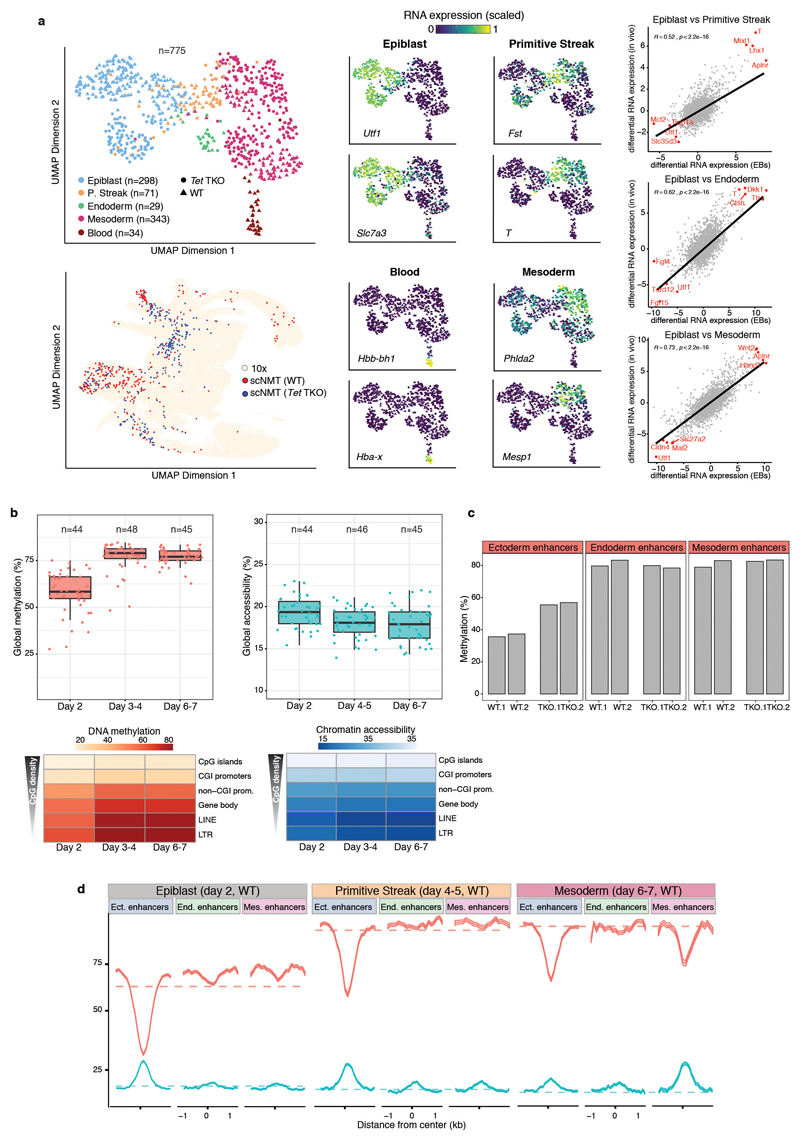
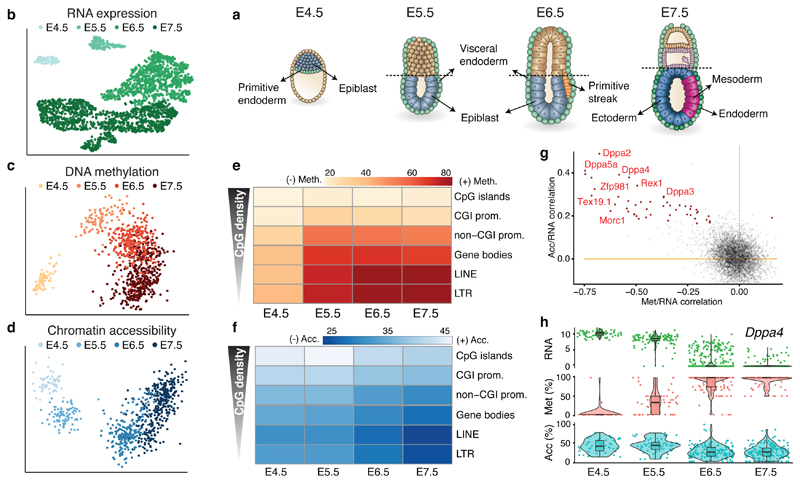
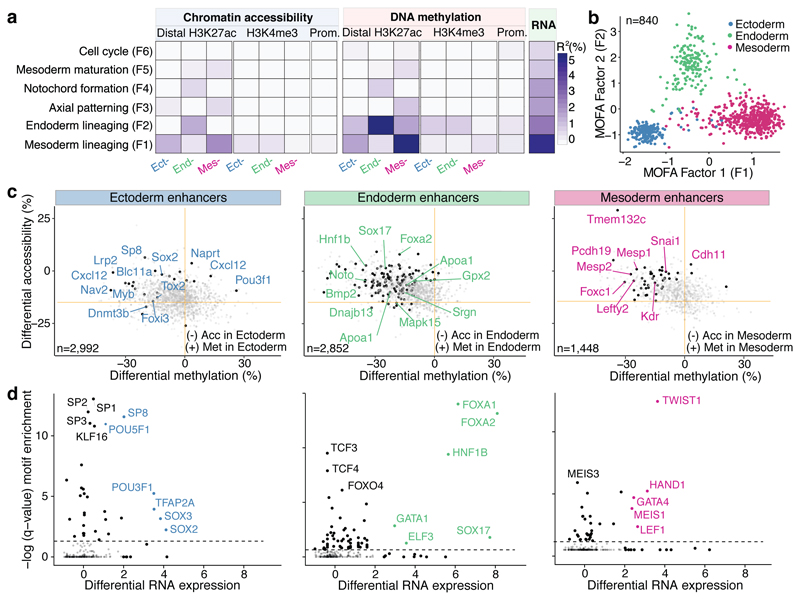
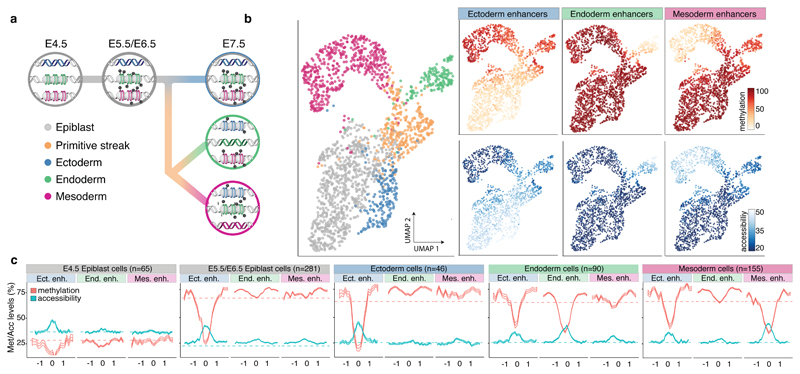
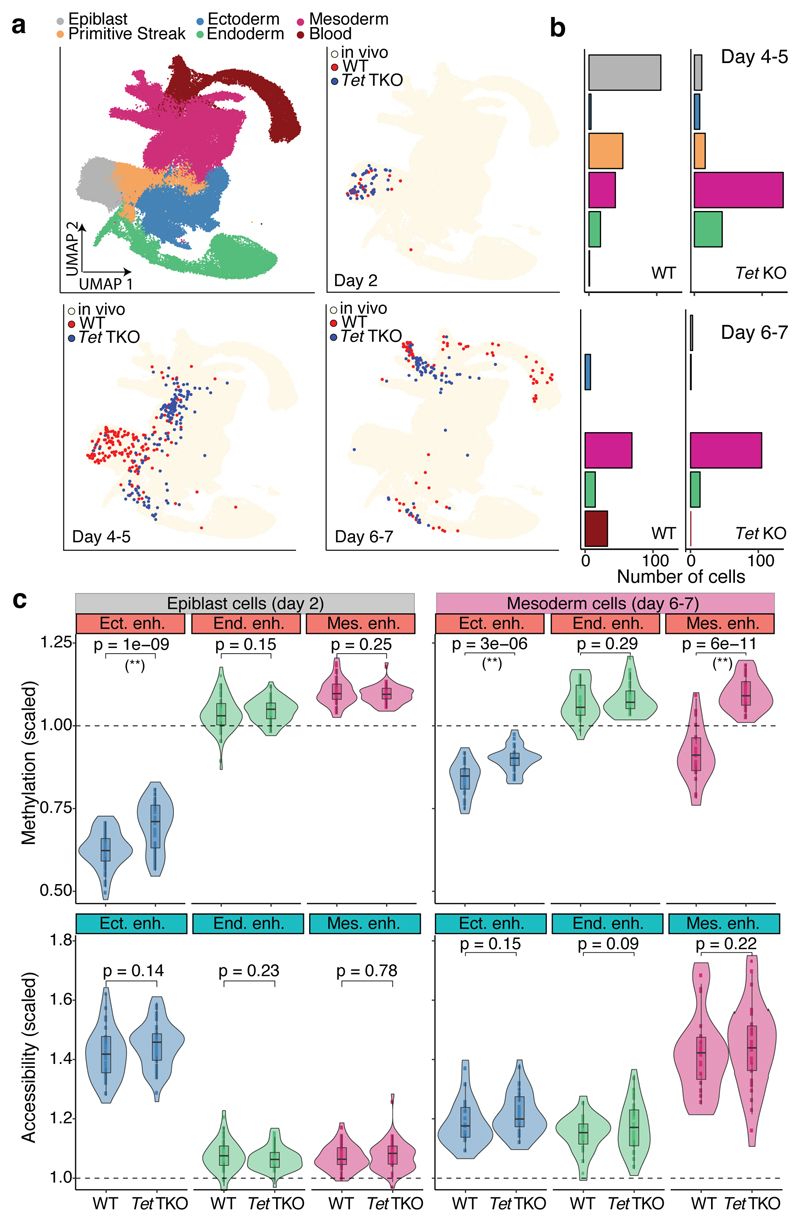
Formation of the three primary germ layers during gastrulation is an essential step in the establishment of the vertebrate body plan and is associated with major transcriptional changes1-5. Global epigenetic reprogramming accompanies these changes6-8, but the role of the epigenome in regulating early cell-fate choice remains unresolved, and the coordination between different molecular layers is unclear. Here we describe a single-cell multi-omics map of chromatin accessibility, DNA methylation and RNA expression during the onset of gastrulation in mouse embryos. The initial exit from pluripotency coincides with the establishment of a global repressive epigenetic landscape, followed by the emergence of lineage-specific epigenetic patterns during gastrulation. Notably, cells committed to mesoderm and endoderm undergo widespread coordinated epigenetic rearrangements at enhancer marks, driven by ten-eleven translocation (TET)-mediated demethylation and a concomitant increase of accessibility. By contrast, the methylation and accessibility landscape of ectodermal cells is already established in the early epiblast. Hence, regulatory elements associated with each germ layer are either epigenetically primed or remodelled before cell-fate decisions, providing the molecular framework for a hierarchical emergence of the primary germ layers.


Conflict of interest statement

Competing interests

W.R. is a consultant and shareholder of Cambridge Epigenetix. The remaining authors declare no competing financial interests

Figures

Extended Data Fig. 1
Extended Data Fig. 1. scNMT-seq quality controls.
a-b, Number of observed cytosines in (a) CpG (red) or (b) GpC (blue) contexts respectively. Each bar corresponds to one cell. Cells are sorted by total number of CpG or GpC sites, respectively. Cells below the dashed line were discarded on the basis of poor coverage. c, RNA library size per cell. Top, total number of reads and bottom, number of expressed genes (read counts>0). Cells below the dashed line were discarded on the basis of poor coverage. d, Venn Diagram displaying the number of cells that pass quality control for RNA expression (green), DNA methylation (red), chromatin accessibility (blue). e, Number of cells that pass quality control for each molecular layer, grouped by stage. Note that for 1,419 out of 2,524 total cells only the RNA expression was sequenced.
Extended Data Fig. 2
Extended Data Fig. 2. Cell type assignments based on RNA expression.
a-b, Lineage assignment of a, E4.5 cells (N=175) and b, E5.5 cells (N=173). Shown are (top left) SC3 consensus plots representing the similarity between cells based on the averaging of clustering results from multiple combinations of clustering parameters. (Top right) Heatmap showing the RNA expression (log normalised counts) of the ten most informative gene markers for each cluster. (Bottom left) t-SNE representation of the RNA expression data coloured by the expression of Fgf4 and Pou5f1, known E4.5 and E5.5 epiblast markers,, respectively. (Bottom right) t-SNE representation of the RNA expression data coloured by the expression of Gata6 and Amn, known E4.5 primitive endoderm and E5.5 visceral endoderm markers. c-d, Lineage assignment of c, E6.5 cells (N=977) and d, E7.5 cells (N=1,155). Left: UMAP projection of the atlas data set (stages E6.5 to E7.0 to assign E6.5 cells and E7.0 to E8.0 to assign E7.5 cells). In the top-left panel the cells are coloured by lineage assignment. In the bottom-left panel, the cells coloured in red are the nearest neighbors that were used to transfer labels to the scNMT-seq data set. In the right panels cells are coloured by the relative RNA expression of lineage marker genes. e, Left: Number of cells per lineage, using the maximally resolved cell types reported in. Right: Number of cells per lineage after aggregation of cell types belonging to the same germ layer or extraembryonic tissue type, as used in this study.
Extended Data Fig. 3
Extended Data Fig. 3. Global methylation and chromatin accessibility dynamics.
a-b, Distribution of a, DNA methylation and b, chromatin accessibility levels per stage and genomic context. When aggregating over genomic features, CpG methylation and GpC accessibility levels (%) are computed assuming a binomial model, with the number of trials being the total number of observed CpG (or GpC) sites and the number of successes being the number of methylated CpG (or GpC) sites (Methods). Importantly, this implies that DNA methylation and chromatin accessibility are quantified as a percentage and are not binarised into ”low” or ”high” states. As this Extended Data Fig. shows, the distribution of DNA methylation and chromatin accessibility across loci (after aggregating measurements across all cells) is largely continuous and does not show bimodality. Hence, a binarisation approach that is sometimes used for differentiated cell types would not be a good representation of the data. c-d, Box plots showing the distribution of genome-wide c, CpG methylation levels or d, GpC accessibility levels per stage and lineage. Each dot represents a single cell. At a significance threshold of 0.01 (t-test, two-sided), the global DNA methylation levels differ between embryonic and extraembryonic lineages, but the global chromatin accessibility levels do not. e-f, Dimensionality reduction of e, DNA methylation and f, chromatin accessibility data. To perform dimensionality reduction while handling the large amount of missing values we used a Bayesian Factor Analysis model (Methods). Shown are scatter plots of the first two latent factors (sorted by variance explained) for models trained with cells from the indicated stages. From E4.5 to E6.5, cells are coloured by embryonic and extraembryonic origin. At E7.5 cells are coloured by the primary germ layer. All lineage assignments were made using the cells’ corresponding RNA expression level (Extended Data Fig. 2). The fraction of variance explained by each factor is displayed in parentheses. The input data was M-values quantified over DNase I hypersensitive sites profiled in Embryonic Stem Cells.
Extended Data Fig. 4
Extended Data Fig. 4. DNA methylation and chromatin accessibility changes in promoters are associated with repression of early pluripotency and germ cell markers.
a, Volcano plots display differential RNA expression levels between E4.5 and E7.5 cells (in log2 counts, x-axis) versus adjusted correlation p-values (FDR < 10% in red, Benjamini-Hochberg correction). Left plot shows DNA methylation versus RNA expression correlations and the right plot shows chromatin accessibility versus RNA expression. Negative values for differential RNA expression indicates higher expression in E4.5, whereas positive values indicate higher expression in E7.5. b, Illustrative examples of epigenetic repression of early pluripotency and germ cell markers. Box and violin plots show the distribution of RNA expression (log2 counts, green), DNA methylation (%, red) and chromatin accessibility (%, blue) levels per stage. Box plots show median coverage and the first and third quartile, whiskers show 1.5x the interquartile range. Each dot corresponds to one cell. For each gene a genomic track is shown on top, where the promoter region that is used to quantify DNA methylation and chromatin accessibility levels is highlighted in yellow.
Extended Data Fig. 5
Extended Data Fig. 5. Characterisation of lineage-specific H3K27ac and H3K4me3 ChIP-seq data.
a, Percentage of peaks overlapping promoters (+/- 500 bp of transcription start sites of annotated mRNAs (Ensembl v87); lighter colour) and not overlapping promoters (distal peaks, darker colour). H3K27ac peaks tend to be distal from the promoters, marking putative enhancer elements. H3K4me3 peaks tend to overlap promoter regions, marking transcription start sites b, Venn diagrams showing overlap of peaks for each lineage, for distal H3K27ac (left) and H3K4me3 (right). This plot shows that H3K27ac peaks tend to be lineage-specific, while H3K4me3 peaks tend to be shared between lineages. c, Illustrative example of the ChIP-seq profile for the ectoderm marker Cxcl12. The top tracks show wiggle plots of ChIP-seq read density (normalised by total read count) for lineage-specific H3K27ac and H3K4me3. The coding sequence is shown in black. The bottom tracks show the lineage-specific peak calls (Methods). H3K27ac peaks are split into distal (putative enhancers) and proximal to the promoter. d, Left: Bar plot of the fraction of E7.5 lineage-specific enhancers that are uniquely marked by H3K27ac in either E10.5 midbrain, E12.5 gut or E10.5 heart. Right: Heatmap displaying H3K27ac levels at individual lineage-specific enhancers in more differentiated tissues. E7.5 enhancers are predominantly marked in their differentiated-tissue counterparts (midbrain for ectoderm, gut for endoderm and heart for mesoderm).
Extended Data Fig. 6
Extended Data Fig. 6. Differential DNA methylation and chromatin accessibility analysis at E7.5 for different genomic contexts.
a, Bar plots showing the fraction (left) or the total number (right) of differentially methylated (red) or accessible (blue) loci (FDR<10%, y-axis) per genomic context (x-axis). Each subplot corresponds to the comparison of one cell type (group A) against cells comprising the other cell types present at E7.5 (Group B). For the right panel, positive values indicate an increase in DNA methylation or chromatin accessibility in group A, whereas negative values indicate a decrease in DNA methylation or chromatin accessibility. Differential analysis of DNA methylation and chromatin accessibility was performed independently for each genomic element using a two-sided Fisher exact test of equal proportions (Methods). b, Scatter plots showing differential DNA methylation (x-axis) versus chromatin accessibility (y-axis) analysis at promoters. Shown are ectoderm vs non-ectoderm cells (left), endoderm vs non-endoderm cells (middle) and mesoderm vs non-mesoderm cells (right). Each dot corresponds to a gene. Labeled black dots highlight genes with lineage-specific RNA expression that show significant differential methylation or accessibility in their promoter (FDR<10%).
Extended Data Fig. 7
Extended Data Fig. 7. Illustrative examples of putative epigenetic regulation in enhancer elements during germ layer commitment.
Box and violin plots showing the distribution of RNA expression (log2 counts, green), and enhancer DNA methylation (%, red) and chromatin accessibility (%, blue) levels for key germ layer markers per stage and cell type. Shown are marker genes for a, ectoderm, b, mesoderm, and c, endoderm. Box plots show median levels and the first and third quartile, whiskers show 1.5x the interquartile range. Each dot corresponds to a single cell. For each gene a genomic track is shown on the top. The enhancer region that is used to quantify DNA methylation and chromatin accessibility levels is represented with a star and highlighted in yellow. Genes were linked to putative enhancers by overlapping genomic coordinates with a maximum distance of 50kb.
Extended Data Fig. 8
Extended Data Fig. 8. Characterisation of MOFA Factors.
a, Factor 1 as mesoderm commitment factor. Left: RNA expression loadings for Factor 1. Genes with large positive loadings increase expression in the positive factor values (mesoderm cells). Middle: Scatter plot of Factor 1 (x-axis) and Factor 2 (y-axis) values. Each dot corresponds to a single cell, coloured by the average methylation levels (%) of the top 100 enhancers with highest loading. Right: as the middle panel but cells are coloured by the average accessibility levels (%). b, Factor 2 as the endoderm commitment factor. Left: RNA expression loadings for Factor 2. Genes with large positive loadings increase expression in the positive factor values (endoderm cells). Middle: Scatter plot of Factor 1 (x-axis) and Factor 2 (y-axis) values. Each dot corresponds to a single cell, coloured by the average methylation levels (%) of the top 100 enhancers with highest loading. Right: as the middle panel but cells are coloured by the average accessibility levels (%). c, Characterisation of MOFA Factor 3 as antero-posterior axial patterning and mesoderm maturation. Left: Beeswarm plot of Factor 3 values, grouped and coloured by cell type. The mesoderm cells are subclassified into nascent and mature mesoderm (see Extended Data Fig. 2). Right: Gene set enrichment analysis of the gene loadings of Factor 3. Shown are the top most significant pathways from MSigDB C2 (Methods). d, Characterisation of MOFA Factor 6 as cell cycle. Left: Beeswarm plot of Factor 6 values, grouped by cell type and coloured by inferred cell cycle state using cyclone (G1/2, cyan or G2/M, yellow). Right: Gene set enrichment analysis of the gene loadings of Factor 6. Shown are the top most significant pathways from MSigDB C2. e, Characterisation of MOFA Factor 4 as notochord formation. Left: Beeswarm plot of Factor 4 values, grouped and coloured by cell type. The endoderm cells are subclassified into notochord (dark green) and not notochord (green) (see Extended Data Fig. 2). Middle: RNA expression loadings for Factor 4. Genes with large negative loadings increase expression in the negative factor values (notochord cells). Right: Same beeswarm plots as in left but coloured by the relative RNA expression of Calca (gene with the highest loading).
Extended Data Fig. 9
Extended Data Fig. 9. DNA methylation and chromatin accessibility dynamics of E7.5 lineage-specific enhancers and transcription factor motifs across development.
a, Box plots showing the distribution of DNA methylation (top) or chromatin accessibility (bottom) levels of E7.5 lineage-defining enhancers, across stages and cell types. Box plots show median levels and the first and third quartile, whiskers show 1.5x the interquartile range. The dashed lines represent the global background levels of DNA methylation at E7.5 (see Extended Data Fig. 3). b, Box plots showing the distribution of chromatin accessibility levels (scaled to the genome-wide background) for 200bp windows around transcription factor motifs associated with commitment to ectoderm (top), endoderm (middle) and mesoderm (bottom). Box plots show median levels and the first and third quartile, whiskers show 1.5x the interquartile range.
Extended Data Fig. 10
Extended Data Fig. 10. E7.5 ectoderm enhancers contain a mixture of pluripotency and neural signatures with different epigenetic dynamics.
a, Scatter plot showing H3K27ac levels for individual ectoderm enhancers (n=2039) quantified in serum ESCs (pluripotency enhancers, x-axis) versus E10.5 midbrain (neuroectoderm enhancers, y-axis). H3K27ac levels in the two lineages are negatively correlated (Pearson’s R = −0.44), indicating that most enhancers are either marked in ESCs or in the brain. Highlighted are the top 250 enhancers that show the strongest differential H3K27ac levels between midbrain and ESCs (blue for midbrain-specific enhancers and grey for ESC-specific enhancers). b, Density plots of H3K27ac levels in ESCs versus E10.5 midbrain. H3K27ac levels are negatively correlated at E7.5 ectoderm enhancers, but not in E7.5 endoderm (n=1124) or mesoderm enhancers (n=631). c, Profiles of DNA methylation (red) and chromatin accessibility (blue) along the epiblast-ectoderm trajectory. Panels show different genomic contexts: E7.5 ectoderm enhancers that are specifically marked by H3K27ac in the midbrain (middle) or ESCs (bottom) (highlighted populations in a). Shown are running averages of 50bp windows around the center of the ChIP-seq peaks (2kb upstream and downstream). Solid lines display the mean across cells (within a given lineage) and shading displays the standard deviation. Dashed horizontal lines represent genome-wide background levels for DNA methylation (red) and chromatin accessibility (blue). For comparison, we have also incorporated E7.5 endoderm enhancers (top), which follow the genome-wide repressive dynamics. d, Box plots of the distribution of DNA methylation (top) and chromatin accessibility (bottom) levels along the epiblast-ectoderm trajectory. Panels show different genomic contexts: E7.5 ectoderm enhancers that are specifically marked by H3K27ac in the midbrain (middle) or ESCs (right) (highlighted populations a). Box plots show median levels and the first and third quartile, whiskers show 1.5x the interquartile range. Dashed lines denote background DNA methylation and chromatin accessibility levels at the corresponding stage and lineage. For comparison, we have also incorporated E7.5 endoderm enhancers (left), which follow the genome-wide repressive dynamics.
Extended Data Fig. 11
Extended Data Fig. 11. Silencing of ectoderm enhancers precedes activation of mesoderm and endoderm enhancers.
a, Reconstructed mesoderm (top) and endoderm (bottom) commitment trajectories using a diffusion pseudotime method applied to the RNA expression data (Methods). Shown are scatter plots of the first two diffusion components, with cells coloured according to their lineage assignment (n=1,154 for endoderm and n=1,511 for mesoderm). For both cases, ranks along the first diffusion component are selected to order cells according to their differentiation state. b, DNA methylation (red) and chromatin accessibility (blue) dynamics of lineage-defining enhancers along the mesoderm (top) and endoderm (bottom) trajectories. Each dot denotes a single cell (n=387 for endoderm and n=474 for mesoderm) and black curves represent non-parametric loess regression estimates. In addition, for each scenario we fit a piece-wise linear regression model for epiblast, primitive streak and mesoderm or endoderm cells (vertical lines indicate the discretised lineage transitions). For each model fit, the slope (r) and its significance level is displayed in the top (- for non-significant, * for 0.01<p<0.1 and ** for p<0.01). c, Density plots showing differential DNA methylation (%, x-axis) and chromatin accessibility (%, y-axis) at lineage-defining enhancers calculated for each of the lineage transitions.
Extended Data Fig. 12
Extended Data Fig. 12. Embryoid bodies (EBs) recapitulate the transcriptional, methylation and accessibility dynamics of the embryo.
a, Embryoid bodies show high transcriptional similarity to gastrulation-stage embryos. (Top left) UMAP projection of the RNA expression for the EB data set (n=775). Cells are coloured by lineage assignment and shaped by genotype (WT or Tet TKO). (Bottom left) UMAP projection of stages E6.5 to E8.5 of the atlas data set (no extraembryonic cells) with the nearest neighbours that were used to assign cell type labels to the scNMT-seq EB data set coloured in red (WT) or blue (Tet TKO). (Middle) UMAP projection of EB cells coloured by the relative RNA expression of marker genes. (Right) Scatter plot of the differential gene expression (log2 normalised counts) between different assigned lineages for EBs (x-axis) versus embryos (y-axis). Each dot represents one gene. Pearson correlation coefficient with corresponding p-value (two-sided) are displayed. Lines show the linear regression fit. The top four genes with the largest differential expression are highlighted in red. b, Global DNA methylation and chromatin accessibility levels during EB differentiation. (Top) Box plots showing the distribution of genome-wide CpG methylation (left) or GpC accessibility levels (right) per time point and lineage (compare to Extended Data Fig. 3). Each dot represents a single cell (only WT cells are used). Box plots show median levels and the first and third quartile, whiskers show 1.5x the interquartile range. (Bottom) Heatmap of DNA methylation (left) or chromatin accessibility (right) levels per time point and genomic context (compare to Figure 1e,f). c, Ectoderm enhancers are more methylated in Tet TKO compared to WT epiblast cells in vivo. Bar plots show the mean (bulk) DNA methylation levels (%) for ectoderm (left), endoderm (middle) and mesoderm (right) enhancers in E6.5 epiblast cells. For each genotype, two replicates are shown. d, Profiles of DNA methylation (red) and chromatin accessibility (blue) at lineage-defining enhancers quantified over different lineages across EB differentiation (only WT cells). Shown are running averages in 50bp windows around the center of the ChIP-seq peaks (2kb upstream and downstream). Solid lines display the mean across cells and shading displays the corresponding standard deviation. Dashed horizontal lines represent genome-wide background levels for methylation (red) and accessibility (blue).
Fig. 1
Fig. 1. Single cell triple-omics profiling of mouse gastrulation.
a, Schematic of the developing mouse embryo, with stages and lineages considered in this study labeled. b, Dimensionality reduction of RNA expression data using UMAP. Cells are coloured by stage. Included are 1,061 cells from 28 embryos sequenced using scNMT-seq and 1,419 cells from 26 embryos sequenced using scRNA-seq. (c,d) Dimensionality reduction of c, DNA methylation data and d, chromatin accessibility data from scNMT-seq using Factor analysis (Methods). Cells are coloured by stage. Included are 986 cells for DNA methylation data and 864 cells for chromatin accessibility data. e-f, Heatmap of e, DNA methylation levels (%) and f, chromatin accessibility levels (%) per stage and genomic context. g, Scatter plot of Pearson correlation coefficients of promoter methylation versus RNA expression (x-axis), and promoter accessibility versus RNA expression (y-axis). Each dot corresponds to one gene (n=4927). Black dots depict significant associations for both correlation types (n=39, FDR<10%). Examples of early pluripotency and germ cell markers among the significant hits are labeled. h, Illustrative example of epigenetic repression of Dppa4. Box and violin plots show the distribution of RNA expression (log normalised counts, green), promoter methylation (%, red) and accessibility (%, blue) per stage. Box plots show median levels and the first and third quartile, whiskers show 1.5x the interquartile range. Each dot corresponds to one cell.
Fig. 2
Fig. 2. Multi-omics Factor Analysis reveals coordinated epigenetic and transcriptomic variation at enhancer elements during germ layer commitment.
a, Percentage of variance explained (R2) by each MOFA factor (rows) across data modalities (columns). b, Scatter plot of MOFA Factor 1 (x-axis) and MOFA Factor 2 (y-axis). Cells are coloured according to their lineage assignment (n=840). c, Scatter plots showing differential DNA methylation (%, x-axis) and chromatin accessibility (%, y-axis) at lineage-specific enhancers at E7.5. Comparisons are ectoderm vs non-ectoderm cells (left), endoderm vs non-endoderm cells (middle) and mesoderm vs non-mesoderm cells (right). Black dots depict gene-enhancer pairs with significant changes in RNA expression and methylation or accessibility (Pearson’s chi-squared test, FDR<10%). d, Transcription Factor (TF) motif enrichment at lineage-defining enhancers. Shown is motif enrichment (Fisher’s exact test, -log10 q-value, y-axis) versus differential RNA expression (log fold change, x-axis) of the corresponding TF. The analysis is performed separately for ectoderm- (left), endoderm- (middle) and mesoderm- (right) defining enhancers. TFs with significant motif enrichment (FDR<1%) and differential RNA expression (edgeR quasi-likelihood test, FDR<1%) are labelled.
Fig. 3
Fig. 3. DNA methylation and chromatin accessibility dynamics at lineage-defining enhancers across development.
a, Illustration of the hierarchical model of enhancer epigenetic dynamics associated with germ layer commitment. b, UMAP projection based on the MOFA factors inferred using all embryonic cells (n=1,928). In the left plot the cells are coloured by lineage. In the right plots cells are coloured by average methylation (%, top) or accessibility (%, bottom) at lineage-defining enhancers. For cells with only RNA expression data, the MOFA factors were used to impute the methylation and accessibility levels. c, Profiles of methylation (red) and accessibility (blue) at lineage-defining enhancers across development. Shown are running averages in 50bp windows around the center of the ChIP-seq peaks (2kb upstream and downstream). Solid lines display the mean across cells and shading displays the standard deviation. E5.5 and E6.5 epiblast cells show similar profiles and are combined. Dashed horizontal lines represent genome-wide background levels for methylation (red) and accessibility (blue).
Fig. 4
Fig. 4. TET enzymes are required for efficient demethylation of mesoderm-defining enhancers and subsequent blood differentiation in embryoid bodies.
a, UMAP projection of stages E6.5 to E8.5 of the atlas data set (no extraembryonic cells). In the top left plot cells are coloured by lineage assignment. The remaining plots show, for different days of EB differentiation, the nearest neighbours that were used to assign cell type labels to the EB data set. WT cells are red (n=438),Tet TKO cells are blue (n=436). We grouped days 4-5 and 6-7 together due to similarity in the cell types recovered. b, Bar plots showing the cell type numbers for each day of EB differentiation, grouped by genotype. c, Overlaid box and violin plots display the distribution of DNA methylation (top) or chromatin accessibility values (bottom) for lineage-defining enhancers in epiblast-like cells at day 2 (n=46 for WT and n=44 TKO) and mesoderm-like cells at days 6-7 (n=22 for WT and n=32 TKO). The y-axis shows the methylation or accessibility (%) scaled to the genome-wide levels. P-values resulting from comparisons of group means (t-test) are displayed. Asterisks denote significant differences (FDR<10%).

Comment in

  • Multi-omics shows the (default) way.
    Willson J. Willson J. Nat Rev Genet. 2020 Mar;21(3):134-135. doi: 10.1038/s41576-020-0211-6. Nat Rev Genet. 2020. PMID: 31925408 No abstract available.

References

    1. Peng G, et al. Spatial Transcriptome for the Molecular Annotation of Lineage Fates and Cell Identity in Mid-gastrula Mouse Embryo. Dev Cell. 2016;36:681–697. - PubMed
    1. Mohammed H, et al. Single-Cell Landscape of Transcriptional Heterogeneity and Cell Fate Decisions during Mouse Early Gastrulation. Cell Rep. 2017;20:1215–1228. - PMC - PubMed
    1. Wen J, et al. Single-cell analysis reveals lineage segregation in early post-implantation mouse embryos. J Biol Chem. 2017;292:9840–9854. - PMC - PubMed
    1. Pijuan-Sala B, et al. A single-cell molecular map of mouse gastrulation and early organogenesis. Nature. 2019;566:490–495. - PMC - PubMed
    1. Chan MM, et al. Molecular recording of mammalian embryogenesis. Nature. 2019;570:77–82. - PMC - PubMed

Publication types

MeSH terms