. 2019 Dec 6:14:9677-9692.
doi: 10.2147/IJN.S223142. eCollection 2019.

Biodistribution, Clearance And Morphological Alterations Of Intravenously Administered Iron Oxide Nanoparticles In Male Wistar Rats

Affiliations

Biodistribution, Clearance And Morphological Alterations Of Intravenously Administered Iron Oxide Nanoparticles In Male Wistar Rats

Usha Singh Gaharwar et al. Int J Nanomedicine. .

Abstract

Introduction: Nanoparticles are used worldwide because of their unique properties, with large-scale application in various fields, such as medicine, cosmetics and industries. In view of their widespread use, the potential adverse effects of nanoparticles have become a significant cause for concern, in terms of not only human health and safety but also the environment. The present investigation focused on establishing the bioaccumulation patterns and ultrastructural changes induced by retained iron oxide nanoparticles (IONPs) in various target organs of rats.

Methods: Twenty-four male Wistar rats were randomly divided into four groups. Experimental animals were intravenously administered different doses of IONPs (7.5 mg/kg, 15 mg/kg and 30 mg/kg) once in a week for 4 weeks. Urine and feces samples were collected on a daily basis to assess nanoparticle clearance and analyzed via atomic absorption spectroscopy (AAS). At the end of the experiment, rats were euthanized and different organs, including spleen, liver, kidney, lung, heart, testis and brain, were dissected. Bioaccumulation of iron in organs and ultrastructural changes induced by IONPs were determined.

Results: The maximal concentration of iron was detected in spleen and minimal concentration in the brain. The level of iron accumulation in organs was as follows: spleen>blood>liver>kidney>lung>heart>testis>brain. The excretion profile in urine revealed maximum excretion on the day following administration that was maintained until day 28, whereas the iron content in feces remained high during the first three days after injection. A similar pattern was observed throughout the duration of the experiment. Ultrastructural alterations were detected in spleen, kidney, lung, heart, testis, brain and liver, indicative of cellular damage induced by accumulating nanoparticles in these organs.

Conclusion: Intravenous administration of IONPs results in ultrastructural changes and dose-dependent bioaccumulation in different organs of rats.

Keywords: bioaccumulation; metabolic cages; metal oxide nanoparticles; toxicity; ultrastructural changes.


Conflict of interest statement

The authors report no conflicts of interest in this work.

Figures

Figure 1
Figure 1
Characterization of iron oxide nanoparticles. (A) Transmission electron microscope (TEM) images of IONPs depicting the shape and size of nanoparticles. Scale bar size, 20 nm. (B) Crystal lattice image of IONPs; bar size of 1 nm. Analysis was performed at 200 kV.
Figure 2
Figure 2
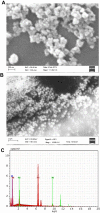
(A) Scanning electron microscopy (SEM) image of iron oxide nanoparticles. (B) Field emission scanning electron microscopy (FE SEM) image of IONPs confirming a spherical shape. (C) Energy-dispersive X-ray profile confirming the elemental composition of IONPs, depicting peaks of iron and oxygen (IONPs in a gold grid). Analysis was conducted at 15 kV.
Figure 3
Figure 3
Hydrodynamic diameters measured via dynamic light scattering (DLS) of iron oxide nanoparticles in PBS recorded daily for 7 days. Data in graphs are presented as mean ± standard deviation for nanoparticle samples (n=3). Error bars represent standard deviation.
Figure 4
Figure 4
Biocompatibility assessment of IONPs in HeLa cells via MTT assay. Cells were treated with 10, 20, 40, 80 and 100 µg/mL IONPs for 24 hrs. Data in graphs are presented as mean ± standard deviation (n=3). Error bars represent standard deviation. Statistical significance was determined using one-way analysis of variance (ANOVA) and multiple comparisons conducted using Tukey’s test. Inter-group significant differences (p<0.05) are marked by letters: a (vs control), b (vs 10 µg/mL IONPs), c (vs 20 µg/mL IONPs), d (vs 40 µg/mL IONPs), and e (vs 80 µg/mL IONPs).
Figure 5
Figure 5
Body weights of Wistar rats following injection of different doses of IONPs or control recorded daily for 28 days. Results are expressed as mean ± SD (n=3). No significant differences were observed among the control and treated groups over the 28-day period.
Figure 6
Figure 6
Coefficient of organs (liver, kidney, spleen, heart, lung, testis and brain) of Wistar rats injected with different doses of IONPs relative to control. Coefficient of organs represents the ratio of organ weight (g) to animal body weight (g). Differences between nanoparticle-injected and control groups were not significant.
Figure 7
Figure 7
Water intake (mL) of control and experimental Wistar rats administered different doses of IONPs. Differences in intake were significant in the 30 mg/kg nanoparticle-administered group, compared to control, during the initial period after treatment but not in the later stages. Statistical significance was determined using one-way analysis of variance (ANOVA) and multiple comparisons conducted using Tukey’s test. * Statistically significant (p<0.05).
Figure 8
Figure 8
Feed intake (g) of control and experimental Wistar rats administered iron oxide nanoparticles. Significant differences in feed intake were observed only at high doses of nanoparticles (30 mg/kg), compared to the control group. Differences in feed intake in the remaining groups treated with lower doses of IONPs were not statistically significant. Statistical significance was determined using one-way analysis of variance (ANOVA) and multiple comparisons conducted using Tukey’s test. * Statistically significant (p<0.05).
Figure 9
Figure 9
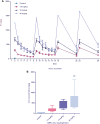
Graph showing iron content excreted through urine of animals injected with different IONPs doses. Daily iron concentration excreted in urine (ng/mL) during the study period (28 days) (A). Box plot depicts the mean iron concentration excreted through urine over 28 days (B). Data are presented as mean ± standard deviation (n=3). Error bars represent standard deviation. Statistical significance was determined using one-way analysis of variance (ANOVA) and multiple comparisons conducted using Tukey’s test. Significant inter-group differences (p<0.05) are marked by letters: a (vs control), b (vs 7.5 mg/kg IONPs), and c (vs 15 mg/kg IONPs).
Figure 10
Figure 10
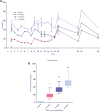
Iron content excreted through feces of animals injected with different doses of IONPs. Iron concentrations in feces (ng/g dry weight) excreted daily during the exposure period (28 days) (A). Box plot depicts mean iron concentrations excreted through feces over 28 days (B). Data represent mean ± standard deviation of nanoparticle concentrations in feces (n=3). Error bars denote standard deviation. Statistical significance was determined using one-way analysis of variance (ANOVA) and multiple comparisons conducted using Tukey’s test. Significant inter-group differences (p<0.05) are marked by letters: a (vs control), b (vs 7.5 mg/kg IONPs), and c (vs 15 mg/kg IONPs).
Figure 11
Figure 11
Bioaccumulation patterns of IONPs in different organs of Wistar rat, specifically, spleen (A), blood (B), liver (C), kidney (D), lungs (E), heart (F) brain (G) and testis (H) treated with varying doses of IONPs. Statistically significant (p<0.05) accumulation of IONPs was observed in a dose-dependent manner in the organs examined, except testis and brain, where significant distribution was evident only in the high-dose (30 mg/kg) group. Results are presented as mean ± standard deviation (n=6). Error bars represent standard deviation. Statistical significance was determined using one-way analysis of variance (ANOVA) and multiple comparisons conducted using Tukey’s test. Significant inter-group differences (p<0.05) are marked by letters: a (vs control), b (vs 7.5 mg/kg IONPs), and c (vs 15 mg/kg IONPs).
Figure 12
Figure 12
Transmission electron microscopy (TEM) images of different organs (A and B of liver, C and D of Kidney) of Wistar rats injected with different doses of IONPs and control. Liver ultrastructure shows nanoparticles (red arrows), fat globules (F), nucleus (N), mitochondria (M), rough endoplasmic reticulum (RER), glycogen granules (G), vesicles (V). (A) Control and (B) 30 mg/kg-treated group's liver image. (C) Control and (D) 30 mg/kg-treated group's kidney, vacuolization in cytoplasm (white arrows), damaged mitochondria (black circle), lysosomes (red arrows), mitochondria (M), and nucleus (N).
Figure 13
Figure 13
Transmission electron microscopy (TEM) images of different organs (E and F of spleen, and C and D of testis) of Wistar rats treated with IONPs and control. (A) Control and (B) 30 mg/kg-treated group's Spleen ultrastructure shows, vacuolization in cytoplasm (white arrows), nanoparticles (black circles). (C) Control and (D) 30 mg/kg-treated group's ultrastructure of testis-treated group shows degenerated and highly vacuolated cytoplasm (red arrows).
Figure 14
Figure 14
Transmission electron microscopy (TEM) images of different organs (A and B of Heart and C and D of lung) of Wistar rats treated with IONPs and control. (A) Control and (B) 30 mg/kg-treated group's ultrastructure of heart nucleus (N), mitochondria (M), nanoparticle deposition (white arrow), mitochondrial Cristae vacuolization (red arrow). (C) Control and (D) 30 mg/kg-treated group's ultrastructure of lung nucleus (N), mitochondria (M), nanoparticle deposition (white arrows), mitochondrial Cristae vacuolization (red arrows).
Figure 15
Figure 15
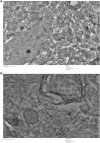
Transmission electron microscopy (TEM) images of brain tissue of Wistar rats injected with a high dose of IONPs (30 mg/kg) and control. Control group shows intact cellular organelles (A), 30 mg/kg treated group’s image showing disintegrated cellular organelles (B).

References

    1. Oberdorster G, Maynard A, Donaldson K, et al. Principles for characterizing the potential human health effects from exposure to nanomaterials: elements of a screening strategy. Part Fibre Toxicol. 2005;2:8. doi:10.1186/1743-8977-2-8 - DOI - PMC - PubMed
    1. Akerman ME, Chan WC, Laakkonen P, Bhatia SN, Ruoslahti E. Nanocrystal targeting in vivo. Proc Natl Acad Sci. 2002;99:12617–12621. doi:10.1073/pnas.152463399 - DOI - PMC - PubMed
    1. Ballou B, Lagerholm BC, Ernst LA, Bruchez MP, Waggoner AS. Noninvasive imaging of quantum dots in mice. Bioconjugate Chem. 2004;15:79–86. doi:10.1021/bc034153y - DOI - PubMed
    1. Cagle DW, Kennel SJ, Mirzadeh S, Alford JM, Wilson LJ. In vivo studies of fullerene-based materials using endohedral metallofullerene radiotracers. Proc Natl Acad Sci. 1999;96:5182–5187. doi:10.1073/pnas.96.9.5182 - DOI - PMC - PubMed
    1. De Jong WH, Hagens WI, Krystek P, Burger MC, Sips AJ, Geertsma RE. Particle size-dependent organ distribution of gold nanoparticles after intravenous administration. Biomaterials. 2008;29:1912–1919. doi:10.1016/j.biomaterials.2007.12.037 - DOI - PubMed

MeSH terms