. 2019 Dec 6:14:24.
doi: 10.1186/s13015-019-0159-2. eCollection 2019.

NANUQ: a method for inferring species networks from gene trees under the coalescent model

Affiliations

NANUQ: a method for inferring species networks from gene trees under the coalescent model

Elizabeth S Allman et al. Algorithms Mol Biol. .

Abstract

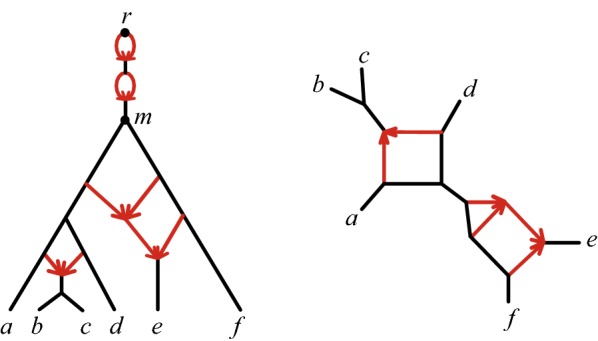
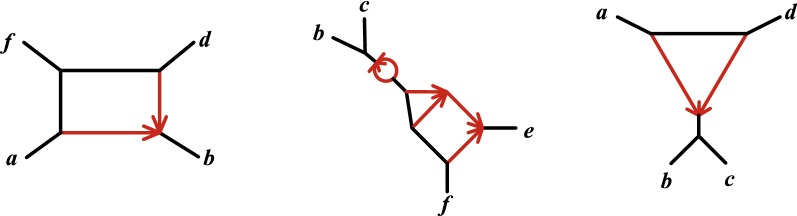
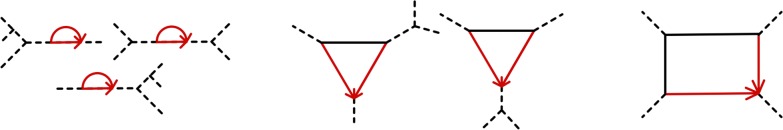
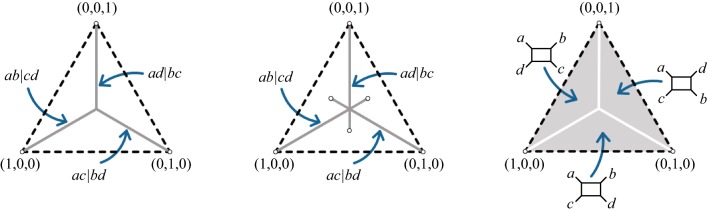
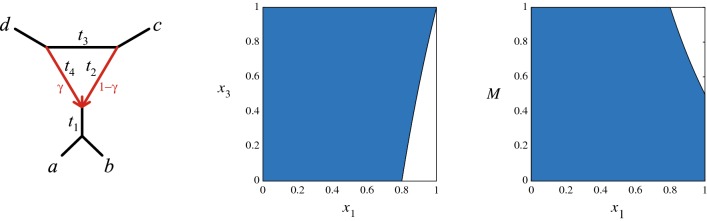
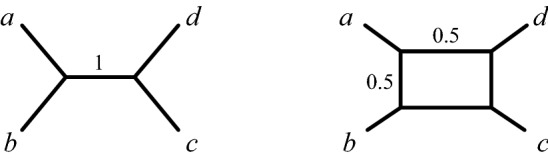
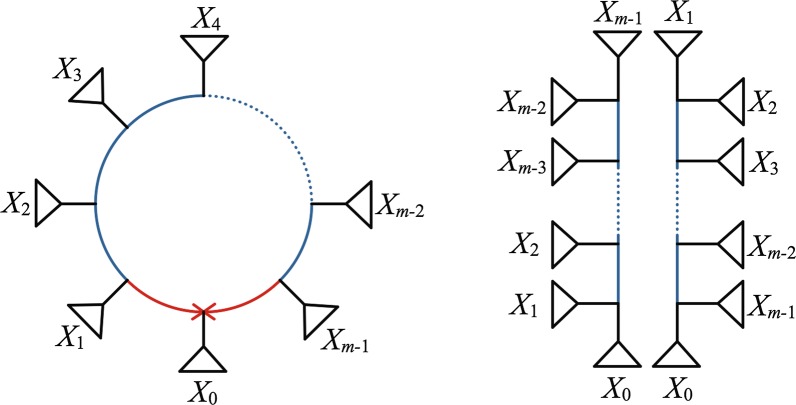
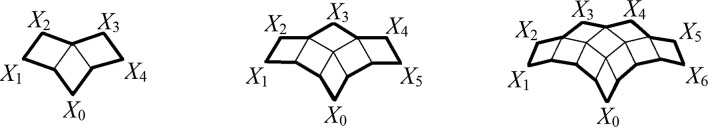
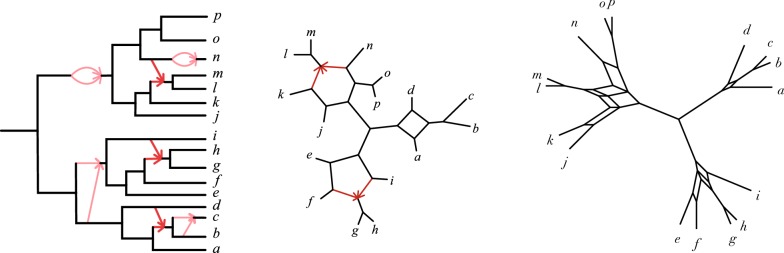
Species networks generalize the notion of species trees to allow for hybridization or other lateral gene transfer. Under the network multispecies coalescent model, individual gene trees arising from a network can have any topology, but arise with frequencies dependent on the network structure and numerical parameters. We propose a new algorithm for statistical inference of a level-1 species network under this model, from data consisting of gene tree topologies, and provide the theoretical justification for it. The algorithm is based on an analysis of quartets displayed on gene trees, combining several statistical hypothesis tests with combinatorial ideas such as a quartet-based intertaxon distance appropriate to networks, the NeighborNet algorithm for circular split systems, and the Circular Network algorithm for constructing a splits graph.

Keywords: Gene tree; Hybridization; Level-1 network; NANUQ; Network multispecies coalescent; Quartets; Species network inference.


Conflict of interest statement

Competing interestsThe authors declare that they have no competing interests.

Figures

Fig. 1
Fig. 1
(L) A rooted phylogenetic network N+ with root r and lowest stable ancestor m, and (R) the unrooted network N- induced from N+
Fig. 2
Fig. 2
Three quartet networks, Qabdf, Qbcef, and Qabcd, induced from the unrooted network N- of Fig. 1(R)
Fig. 3
Fig. 3
Cycles in a level-1 quartet network are classified as type mk if they have m edges and k descendants of the hybrid node. The only cycles possible in a level-1 quartet network are of (L) type 21, 22, and 23; (C) type 31 and 32; and (R) type 41. The dashed lines represent subgraphs that may contain other mk cycles for m=2,3
Fig. 4
Fig. 4
Planar projections of the simplex Δ2 showing types of concordance factors for networks Nc- of Proposition 9. (L) Gray line segments represent tree-like CFs that arise from quartet networks with no 32-cycle and with no 4-cycle. (C) Gray line segments represent CFs that arise from quartet networks with a 32-cycle. (R) Gray shaded areas represent CFs that arise from quartet networks containing a 4-cycle. In all three figures, the topology of Nc- is marked for the appropriate line segments or regions of CFs
Fig. 5
Fig. 5
(L) NMSC parameters for an induced unrooted quartet N- with a 32-cycle. (C) A region of tree-like parameters (x1,x3) on N- for arbitrary t2, t4, γ. (R) A region of tree-like parameters (x1,M), where M=max{x2,x4} for arbitrary t3, γ. Transformed parameters are defined by xi=e-ti
Fig. 6
Fig. 6
For the tree Qabcd on the left, ρab(Qabcd)=0 and ρac(Qabcd)=1, since a and c are separated by ab|cd, but a and b are not. For the quartet network Qabcd on the right, ρab(Qabcd)=1/2 and ρac(Qabcd)=1, since the trees displayed by Qabcd are ab|cd and ad|bc
Fig. 7
Fig. 7
(L) A cycle in a level-1 network N-, and (R) the two simpler networks produced from it by deleting one hybrid edge. The cycle edges in these networks that arise from the original cycle are shown in blue. If N- has a single cycle, then the networks on the right are the two trees in G(N-)
Fig. 8
Fig. 8
An m-dart, for m=5,6,7 respectively. The frontier edges, shown in bold outline, are characterized in the text. The outer vertices labelled by the Xi are the corners. The point of the dart is the unique corner which is m-3 frontier edges away from the closest corners
Fig. 9
Fig. 9
(L) A rooted level-1 network N+ with 2- and 3-cycles shown in light red, (C) the unrooted topological network N- obtained from N+ by contracting 2- and 3-cycles and undirecting 4-cycles, and (R) a frontier-minimal splits graph that corresponds to N- by Theorem 34. Note that the splits graph has a 4-cycle, a 5-dart, and a 6-dart, arising from the 4-, 5-, and 6-cycles of N-. The metric structure of the splits graph, which is not described by Theorem 34, reflects the split weights as defined by Definition 18. See also Example 37
Fig. 10
Fig. 10
Representative simplex plots for empirical CFs, with hypothesis testing results, computed from a simulated data set of 1000 gene trees from the species network given in Table 1
Fig. 11
Fig. 11
Simplex plots for hypothesis test results on the yeast data set, with two choices of significance levels α=10-4 and 10-2 with β=0.1. The choice of β here is largely irrelevant, as no plotted empirical CFs are near the center. Larger α results in more empirical CFs being determined as supporting 4-cycles, as several blue circles on the left change to red triangles on the right
Fig. 12
Fig. 12
Networks inferred by NANUQ for yeast data of Example 38 with β=0.1 and α=10-4 (L) or 10-2 (R)
Fig. 13
Fig. 13
Simplex plot showing hypothesis test results for the Heliconius data set of Example 39
Fig. 14
Fig. 14
(L) Splits graph for Heliconius data set of Example 39, for α=10-40, β=10-30, and (R) NANUQ inferred network structure

References

    1. Solís-Lemus C, Ané C. Inferring phylogenetic networks with maximum pseudolikelihood under incomplete lineage sorting. PLoS Genet. 2016;12(3):e1005896. doi: 10.1371/journal.pgen.1005896. - DOI - PMC - PubMed
    1. Yu Y, Nakhleh L. A maximum pseudo-likelihood approach for phylogenetic networks. BMC Genomics. 2015;16(10):S10. doi: 10.1186/1471-2164-16-S10-S10. - DOI - PMC - PubMed
    1. Baños H. Identifying species network features from gene tree quartets. Bull Math Biol. 2019;81:494–534. doi: 10.1007/s11538-018-0485-4. - DOI - PMC - PubMed
    1. Allman ES, Mitchell JD, Rhodes JA. Hypothesis testing near singularities and boundaries. Electron J Statist. 2019;13(1):2150–2193. doi: 10.1214/19-EJS1576. - DOI - PMC - PubMed
    1. Rhodes JA. Topological metrizations of trees, and new quartet methods of tree inference. IEEE/ACM Trans Comput Biol Bioinform. 2019 doi: 10.1109/TCBB.2019.2917204. - DOI - PMC - PubMed

LinkOut - more resources