Review
. 2019 Dec 9:8:37.
doi: 10.1186/s40035-019-0178-4. eCollection 2019.

Detecting neurodegenerative pathology in multiple sclerosis before irreversible brain tissue loss sets in

Affiliations
Review

Detecting neurodegenerative pathology in multiple sclerosis before irreversible brain tissue loss sets in

Jeroen Van Schependom et al. Transl Neurodegener. .

Erratum in

Abstract

Background: Multiple sclerosis (MS) is a complex chronic inflammatory and degenerative disorder of the central nervous system. Accelerated brain volume loss, or also termed atrophy, is currently emerging as a popular imaging marker of neurodegeneration in affected patients, but, unfortunately, can only be reliably interpreted at the time when irreversible tissue damage likely has already occurred. Timing of treatment decisions based on brain atrophy may therefore be viewed as suboptimal.

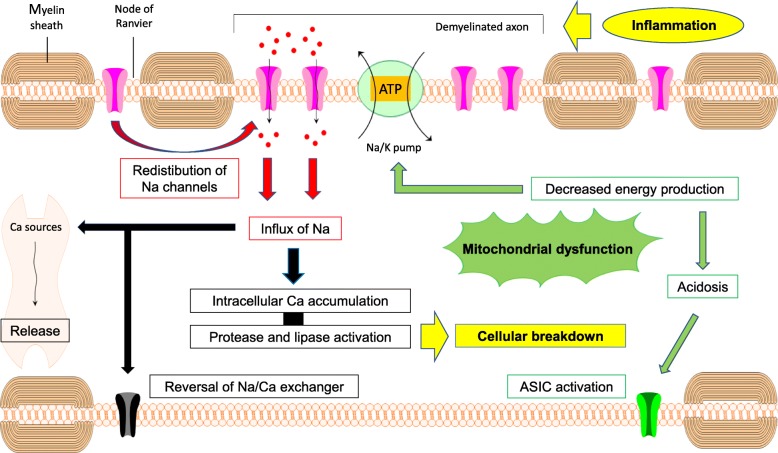
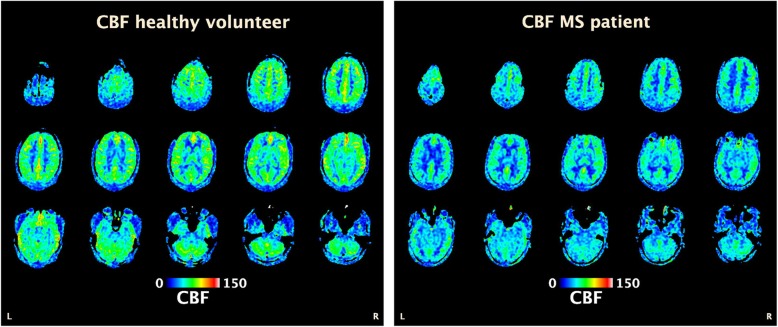
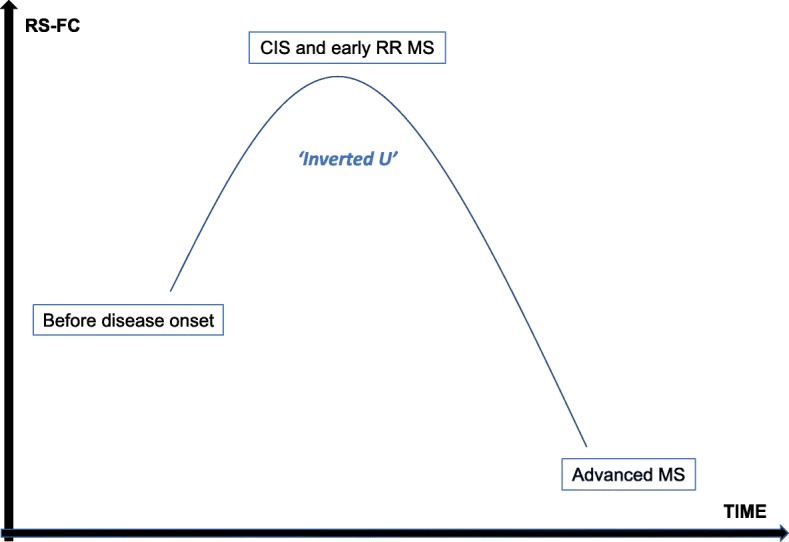
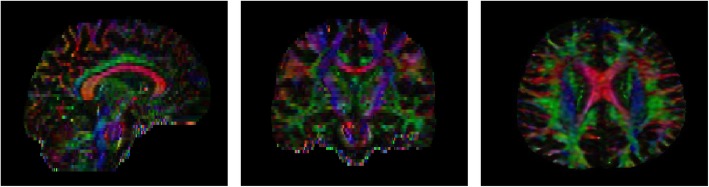
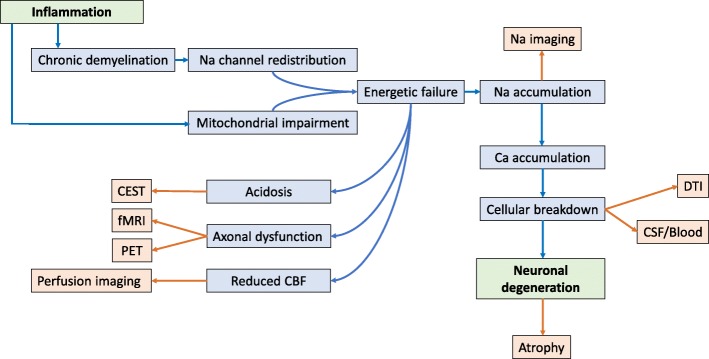
Main body: This Narrative Review focuses on alternative techniques with the potential of detecting neurodegenerative events in the brain of subjects with MS prior to the atrophic stage. First, metabolic and molecular imaging provide the opportunity to identify early subcellular changes associated with energy dysfunction, which is an assumed core mechanism of axonal degeneration in MS. Second, cerebral hypoperfusion has been observed throughout the entire clinical spectrum of the disorder but it remains an open question whether this serves as an alternative marker of reduced metabolic activity, or exists as an independent contributing process, mediated by endothelin-1 hyperexpression. Third, both metabolic and perfusion alterations may lead to repercussions at the level of network performance and structural connectivity, respectively assessable by functional and diffusion tensor imaging. Fourth and finally, elevated body fluid levels of neurofilaments are gaining interest as a biochemical mirror of axonal damage in a wide range of neurological conditions, with early rises in patients with MS appearing to be predictive of future brain atrophy.

Conclusions: Recent findings from the fields of advanced neuroradiology and neurochemistry provide the promising prospect of demonstrating degenerative brain pathology in patients with MS before atrophy has installed. Although the overall level of evidence on the presented topic is still preliminary, this Review may pave the way for further longitudinal and multimodal studies exploring the relationships between the abovementioned measures, possibly leading to novel insights in early disease mechanisms and therapeutic intervention strategies.

Keywords: Brain atrophy; magnetic resonance imaging; multiple sclerosis; neurodegeneration; neurofilaments.


Conflict of interest statement

Competing interestsGN is a shareholder of icometrix which is a software provider for BV measurements, and currently on secondment from his employer (i.e. Universitair Ziekenhuis) to icometrix for 10% of his time in the role of ‘Medical Director Neurology’. MBD, GN and MD have received consultancy fees from the manufacturers of the disease-modifying treatments mentioned in the paper.

Figures

Fig. 1
Fig. 1
Cascade of events potentially linking inflammatory activity to slowly progressive neurodegeneration in MS. Chronic inflammatory demyelination leads to redistribution of sodium channels along the denudated axolemma, resulting in sodium influx. Elevated intracellular sodium levels increase the work-load of the energy-dependent Na/K pump. Mitochondrial function is impaired in multiple sclerosis (mainly resulting from the oxidative stress associated with inflammatory activity) which causes insufficient energy supply to compensate this imbalance. Intracellular sodium levels rise, leading to accumulation of calcium, e.g. by reversal of the transmembrane Na/Ca exchanger and release from intracellular sources. Acidosis contributes to sodium and calcium influx through opening of acid-sensing ion channels. Calcium stacking induces protease and lipase activity, eventually ending with cellular breakdown. ATP: adenosine triphosphate, ASIC: acid-sensing ion channel, MS: multiple sclerosis
Fig. 2
Fig. 2
Brain perfusion is globally decreased in MS. Perfusion-weighted brain MRI (arterial spin labelling) from a 35-year old healthy male volunteer (left) versus a 34-year old man with relapsing-remitting MS (right), with CBF color-coded map overlay. Brain perfusion is globally reduced in the MS patients, as compared to the healthy volunteer. CBF: cerebral blood flow (expressed as mL/100 g/min), MS: multiple sclerosis, MRI: magnetic resonance imaging
Fig. 3
Fig. 3
Longitudinal evolution of the default network’s RS-FC in MS. RS-CF is elevated early in the disease, as compared to healthy age-related controls, but subsequently drops down again, first to normal levels and then to reduced levels in more advanced patients. Impaired cognition seems to be associated with early increases and late decreases, most likely reflecting initial functional compensation followed by exhaustion of these mechanisms. RS-FC: resting-state functional connectivity, CIS: clinically isolated syndrome. RR: relapsing-remitting, MS: multiple sclerosis
Fig. 4
Fig. 4
Examples of white matter tract orientation on processed DTI. Color denotes the direction of the first eigenvector at each voxel, weighted with the FA of that voxel. Red: left-right; blue: superior-inferior; green: anterior-posterior. Left: sagittal plane; middle: coronal plane; right: axial plane. DTI: diffusion tensor imaging, FA: fractional anisotropy
Fig. 5
Fig. 5
Biological background of potential early neurodegenerative markers in MS. Blue: biological processes possibly connecting inflammation with neurodegeneration in MS. Orange: techniques to address the potential corresponding biomarker. DTI: diffusion tensor imaging, CEST: chemical exchange saturation transfer, fMRI: functional magnetic resonance imaging, PET: positron emission tomography, CBF: cerebral blood flow, CSF: cerebrospinal fluid, MS: multiple sclerosis.

References

    1. Compston A, Coles A. Multiple sclerosis. Lancet. 2008;372(9648):1502–1517. doi: 10.1016/S0140-6736(08)61620-7. - DOI - PubMed
    1. Pugliatti M, Sotgiu S, Rosati G. The worldwide prevalence of multiple sclerosis. Clin Neurol Neurosurg. 2002;104(3):182–191. doi: 10.1016/S0303-8467(02)00036-7. - DOI - PubMed
    1. Scalfari A, Neuhaus A, Daumer M, Ebers GC, Muraro PA. Age and disability accumulation in multiple sclerosis. Neurology. 2011;77(13):1246–1252. doi: 10.1212/WNL.0b013e318230a17d. - DOI - PMC - PubMed
    1. Leray E, Yaouanq J, Le Page E, Coustans M, Laplaud D, Oger J, et al. Evidence for a two-stage disability progression in multiple sclerosis. Brain. 2010;133(Pt 7):1900–1913. doi: 10.1093/brain/awq076. - DOI - PMC - PubMed
    1. Marrie RA. Comorbidity in multiple sclerosis: Past, present and future. Clin Invest Med. 2019;42(1):E5–E12. doi: 10.25011/cim.v42i1.32383. - DOI - PubMed

LinkOut - more resources