. 2019 Dec 12;20(1):264.
doi: 10.1186/s13059-019-1862-5.

scPred: accurate supervised method for cell-type classification from single-cell RNA-seq data

Affiliations

scPred: accurate supervised method for cell-type classification from single-cell RNA-seq data

Jose Alquicira-Hernandez et al. Genome Biol. .

Abstract

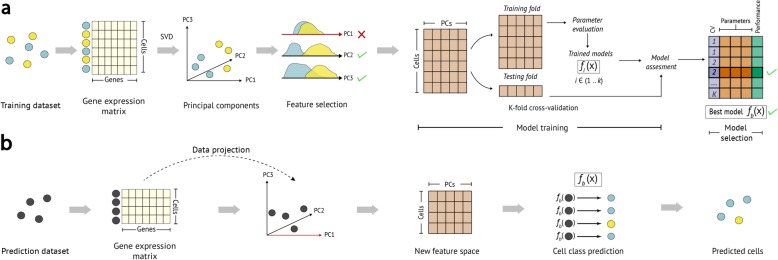
Single-cell RNA sequencing has enabled the characterization of highly specific cell types in many tissues, as well as both primary and stem cell-derived cell lines. An important facet of these studies is the ability to identify the transcriptional signatures that define a cell type or state. In theory, this information can be used to classify an individual cell based on its transcriptional profile. Here, we present scPred, a new generalizable method that is able to provide highly accurate classification of single cells, using a combination of unbiased feature selection from a reduced-dimension space, and machine-learning probability-based prediction method. We apply scPred to scRNA-seq data from pancreatic tissue, mononuclear cells, colorectal tumor biopsies, and circulating dendritic cells and show that scPred is able to classify individual cells with high accuracy. The generalized method is available at https://github.com/powellgenomicslab/scPred/.


Conflict of interest statement

The authors declare that they have no competing interests.

Figures

Fig. 1
Fig. 1
Summary of the scPred method. a Training step. A gene expression matrix is eigendecomposed via singular value decomposition (SVD) to obtain orthonormal linear combinations of the gene expression values. Only PCs explaining greater than 0.01% of the variance of the dataset are considered for the feature selection and model training steps. Informative PCs are selected using a two-tailed Wilcoxon signed-rank test for each cell class distribution (see the “Methods” section). The cells-PCs matrix is randomly split into k groups and the first k group is considered as a testing dataset for cross-validation. The remaining K-1 groups (shown as a single training fold) are used to train a machine learning classification model (a support vector machine). The model parameters are tuned, and each k group is used as a testing dataset to evaluate the prediction performance of a fi(x) model trained with the remaining K-1 groups. The best model in terms of prediction performance is selected. b Prediction step. The gene expression values of the cells from an independent test or validation dataset are projected onto the principal component basis from the training model, and the informative PCs are used to predict the class probabilities of each cell using the trained prediction model(s) fb(x)
Fig. 2
Fig. 2
Classification performance of tumor cells from gastric adenocarcinoma. scPred shows high prediction accuracy to classify tumor cells (0.979 (95% bootstrap CI 0.973–0.984) and non-tumor cells 0.974 (95% bootstrap CI 0.960–0.989). scPred outperforms predictions based on differentially expressed genes and per-cell mean of log2(CPM + 1) (prediction baseline). Ten bootstrap replicates were used to assess the prediction performance of all methods
Fig. 3
Fig. 3
Principal component alignment of pancreatic cells. a Training (Muraro, Segerstolpe, and Xin) datasets [3, 25, 26] were used to generate the training eigenspace. The test dataset (Baron et al. [31]) was projected, and all datasets were aligned using Seurat. No batch effect is observed after the alignment. b α, β, δ, and γ cells are included in the training datasets. The prediction dataset contains also 2326 “other” cell types such as epsilon, acinar, stellate, ductal, endothelial, Schwann, and T cells (bright green cells). After the dataset alignment, cells cluster by cell type. The X-axis shows variance explained (exp.var.), principal components (PC), and aligned principal components (APC)
Fig. 4
Fig. 4
Prediction results of PBMCs. The average number of cells for each cell type across all ten bootstrap replicates is shown. (i) First, every single cell was classified as myeloid, lymphoid, or blood progenitor. (ii) A second layer of prediction is used to classify all lymphoid cells as B cells, T cells, or natural killer. (iii) Finally, all T cells are subclassified as cytotoxic or non-cytotoxic. Confidence intervals for mean estimates are included in Additional file 2: Table S12
Fig. 5
Fig. 5
Prediction of human dendritic cells. a The training dataset (Villani et al.) of dendritic cells and monocytes was eigendecomposed (orange and yellow points and density lines). b Dendritic cells from the test dataset (Breton et al) were projected onto the training eigenspace (purple points). scPred predicted 98% of dendritic cells derived from peripheral blood correctly and 82% from umbilical cord (Breton et al.). Blue points correspond to cells that were misclassified and black points to unassigned cells
Fig. 6
Fig. 6
Prediction results of colorectal cancer epithelial stem/TA-like cells. The performance of the prediction was measured using the receiver operating characteristic area under the curve (ROC AUC) and the precision-recall area under the curve (PR AUC). 95% confidence bands are shown in both cases for 50 bootstrap replicates. a ROC AUC. The area under the curve shows the relationship between the cells incorrectly assigned to that come from tumor samples versus the ones that were correctly assigned by the prediction model as tumor cells using a series of different threshold points. b PR AUC. The area under the curve measures the relationship between the cells correctly classified as tumor cells versus the fraction of cells correctly assigned as tumor cells from the total number of cells classified as tumor cells. An AUC value of 0.992 shows robustness to class imbalance

References

    1. Villani Alexandra-Chloé, Satija Rahul, Reynolds Gary, Sarkizova Siranush, Shekhar Karthik, Fletcher James, Griesbeck Morgane, Butler Andrew, Zheng Shiwei, Lazo Suzan, Jardine Laura, Dixon David, Stephenson Emily, Nilsson Emil, Grundberg Ida, McDonald David, Filby Andrew, Li Weibo, De Jager Philip L., Rozenblatt-Rosen Orit, Lane Andrew A., Haniffa Muzlifah, Regev Aviv, Hacohen Nir. Single-cell RNA-seq reveals new types of human blood dendritic cells, monocytes, and progenitors. Science. 2017;356(6335):eaah4573. doi: 10.1126/science.aah4573. - DOI - PMC - PubMed
    1. Grün Dominic, Lyubimova Anna, Kester Lennart, Wiebrands Kay, Basak Onur, Sasaki Nobuo, Clevers Hans, van Oudenaarden Alexander. Single-cell messenger RNA sequencing reveals rare intestinal cell types. Nature. 2015;525(7568):251–255. doi: 10.1038/nature14966. - DOI - PubMed
    1. Segerstolpe Åsa, Palasantza Athanasia, Eliasson Pernilla, Andersson Eva-Marie, Andréasson Anne-Christine, Sun Xiaoyan, Picelli Simone, Sabirsh Alan, Clausen Maryam, Bjursell Magnus K., Smith David M., Kasper Maria, Ämmälä Carina, Sandberg Rickard. Single-Cell Transcriptome Profiling of Human Pancreatic Islets in Health and Type 2 Diabetes. Cell Metabolism. 2016;24(4):593–607. doi: 10.1016/j.cmet.2016.08.020. - DOI - PMC - PubMed
    1. Treutlein Barbara, Brownfield Doug G., Wu Angela R., Neff Norma F., Mantalas Gary L., Espinoza F. Hernan, Desai Tushar J., Krasnow Mark A., Quake Stephen R. Reconstructing lineage hierarchies of the distal lung epithelium using single-cell RNA-seq. Nature. 2014;509(7500):371–375. doi: 10.1038/nature13173. - DOI - PMC - PubMed
    1. Li L, Dong J, Yan L, Yong J, Liu X, Hu Y, Fan X, Wu X, Guo H, Wang X, Zhu X, Li R, Yan J, Wei Y, Zhao Y, Wang W, Ren Y, Yuan P, Yan Z, Hu B, Guo F, Wen L, Tang F, Qiao J. Single-cell RNA-seq analysis maps development of human germline cells and gonadal niche interactions. Cell Stem Cell. 2017;20:891–892. doi: 10.1016/j.stem.2017.05.009. - DOI - PubMed

Publication types

MeSH terms