

Regulation of microglial TMEM119 and P2RY12 immunoreactivity in multiple sclerosis white and grey matter lesions is dependent on their inflammatory environment
- PMID: 31829283
- PMCID: PMC6907356
- DOI: 10.1186/s40478-019-0850-z
Regulation of microglial TMEM119 and P2RY12 immunoreactivity in multiple sclerosis white and grey matter lesions is dependent on their inflammatory environment
Abstract
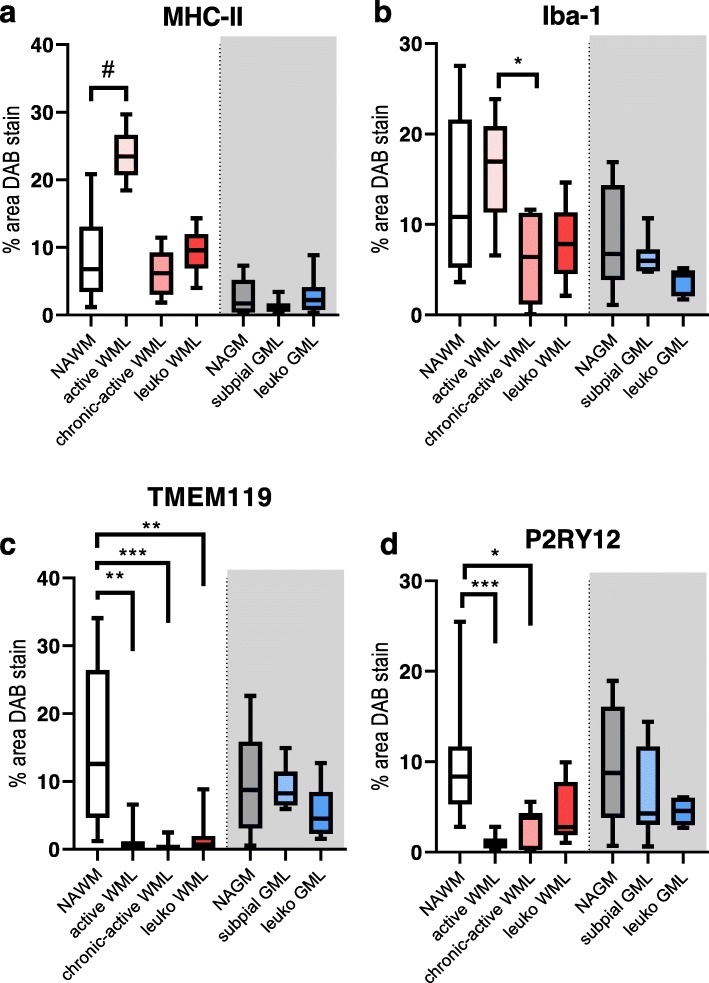
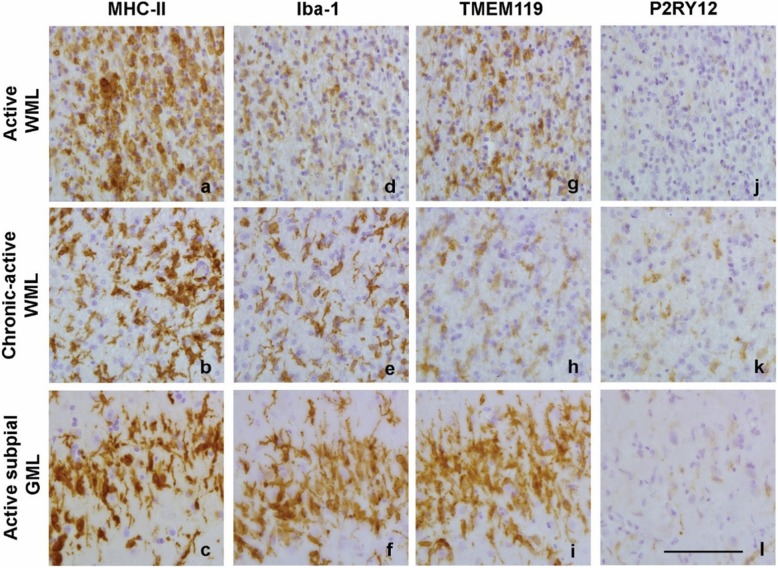
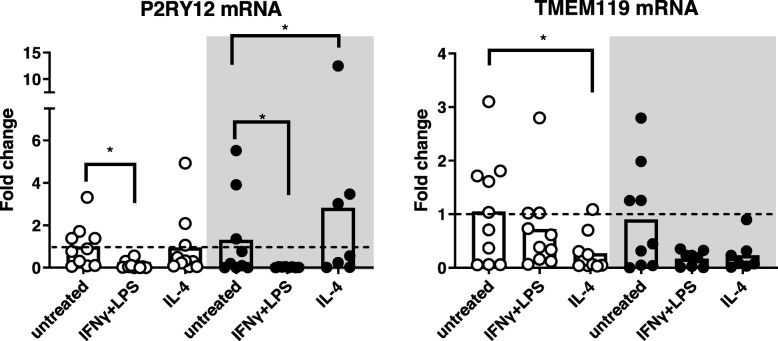
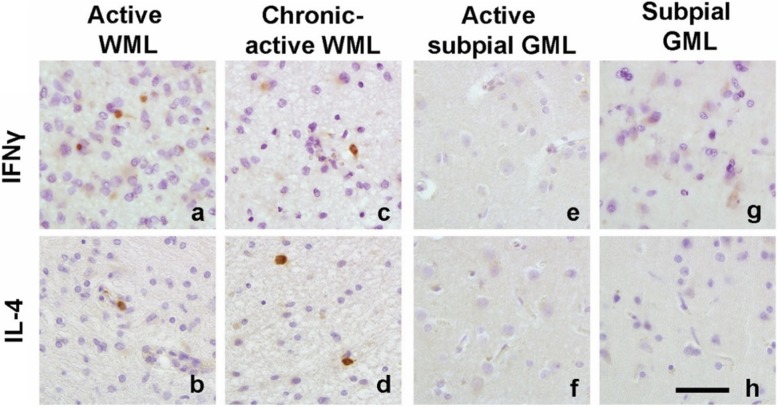
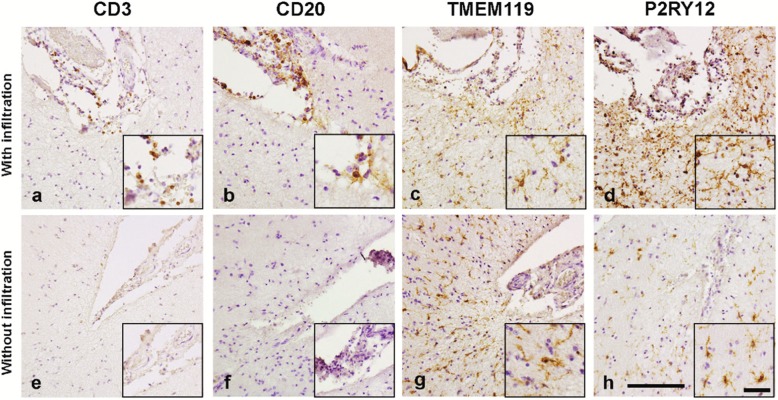
Multiple Sclerosis (MS) is the most common cause of acquired neurological disability in young adults, pathologically characterized by leukocyte infiltration of the central nervous system, demyelination of the white and grey matter, and subsequent axonal loss. Microglia are proposed to play a role in MS lesion formation, however previous literature has not been able to distinguish infiltrated macrophages from microglia. Therefore, in this study we utilize the microglia-specific, homeostatic markers TMEM119 and P2RY12 to characterize their immunoreactivity in MS grey matter lesions in comparison to white matter lesions. Furthermore, we assessed the immunological status of the white and grey matter lesions, as well as the responsivity of human white and grey matter derived microglia to inflammatory mediators. We are the first to show that white and grey matter lesions in post-mortem human material differ in their immunoreactivity for the homeostatic microglia-specific markers TMEM119 and P2RY12. In particular, whereas immunoreactivity for TMEM119 and P2RY12 is decreased in the center of WMLs, immunoreactivity for both markers is not altered in GMLs. Based on data from post-mortem human microglia cultures, treated with IL-4 or IFNγ+LPS and on counts of CD3+ or CD20+ lymphocytes in lesions, we show that downregulation of TMEM119 and P2RY12 immunoreactivity in MS lesions corresponds with the presence of lymphocytes and lymphocyte-derived cytokines within the parenchyma but not in the meninges. Furthermore, the presence of TMEM119+ and partly P2RY12+ microglia in pre-active lesions as well as in the rim of active white and grey matter lesions, in addition to TMEM119+ and P2RY12+ rod-like microglia in subpial grey matter lesions suggest that blocking the entrance of lymphocytes into the CNS of MS patients may not interfere with all possible effects of TMEM119+ and P2RY12+ microglia in both white and grey matter MS lesions.
Keywords: Cortical lesions; Demyelination; Homeostatic microglia; Multiple sclerosis; Subpial lesions.
Conflict of interest statement
The authors declare that they have no competing interest.
Figures
Similar articles
-
Transcriptional profiling of human microglia reveals grey-white matter heterogeneity and multiple sclerosis-associated changes.Nat Commun. 2019 Mar 13;10(1):1139. doi: 10.1038/s41467-019-08976-7. Nat Commun. 2019. PMID: 30867424 Free PMC article.
-
Distinct microglial and macrophage distribution patterns in the concentric and lamellar lesions in Baló's disease and neuromyelitis optica spectrum disorders.Brain Pathol. 2020 Nov;30(6):1144-1157. doi: 10.1111/bpa.12898. Epub 2020 Sep 23. Brain Pathol. 2020. PMID: 32902014 Free PMC article.
-
Dominant role of microglial and macrophage innate immune responses in human ischemic infarcts.Brain Pathol. 2018 Nov;28(6):791-805. doi: 10.1111/bpa.12583. Epub 2017 Dec 28. Brain Pathol. 2018. PMID: 29222823 Free PMC article.
-
Pathological differences between white and grey matter multiple sclerosis lesions.Ann N Y Acad Sci. 2015 Sep;1351:99-113. doi: 10.1111/nyas.12841. Epub 2015 Jul 22. Ann N Y Acad Sci. 2015. PMID: 26200258 Review.
-
Multifaceted involvement of microglia in gray matter pathology in multiple sclerosis.Stem Cells. 2021 Aug;39(8):993-1007. doi: 10.1002/stem.3374. Epub 2021 Mar 25. Stem Cells. 2021. PMID: 33754376 Review.
Cited by
-
Interleukin-4 improves white matter integrity and functional recovery after murine traumatic brain injury via oligodendroglial PPARγ.J Cereb Blood Flow Metab. 2021 Mar;41(3):511-529. doi: 10.1177/0271678X20941393. Epub 2020 Aug 5. J Cereb Blood Flow Metab. 2021. PMID: 32757740 Free PMC article.
-
Dysfunctional Glymphatic System with Disrupted Aquaporin 4 Expression Pattern on Astrocytes Causes Bacterial Product Accumulation in the CSF during Pneumococcal Meningitis.mBio. 2022 Oct 26;13(5):e0188622. doi: 10.1128/mbio.01886-22. Epub 2022 Aug 29. mBio. 2022. PMID: 36036510 Free PMC article.
-
Deciphering the heterogeneity of myeloid cells during neuroinflammation in the single-cell era.Brain Pathol. 2020 Nov;30(6):1192-1207. doi: 10.1111/bpa.12910. Epub 2020 Nov 6. Brain Pathol. 2020. PMID: 33058309 Free PMC article.
-
Leukocytes mediate disease pathogenesis in the Ndufs4(KO) mouse model of Leigh syndrome.JCI Insight. 2022 Mar 8;7(5):e156522. doi: 10.1172/jci.insight.156522. JCI Insight. 2022. PMID: 35050903 Free PMC article.
-
CHIT1 at diagnosis predicts faster disability progression and reflects early microglial activation in multiple sclerosis.Nat Commun. 2024 Jun 12;15(1):5013. doi: 10.1038/s41467-024-49312-y. Nat Commun. 2024. PMID: 38866782 Free PMC article.
References
Publication types
MeSH terms
Substances
Grants and funding
LinkOut - more resources
Full Text Sources
Medical
Molecular Biology Databases
