

doi: 10.1021/acs.jmedchem.9b01546.
Epub 2019 Dec 27.
Utilizing Stimulated Raman Scattering Microscopy To Study Intracellular Distribution of Label-Free Ponatinib in Live Cells
Affiliations
- PMID: 31829628
- PMCID: PMC7073915
- DOI: 10.1021/acs.jmedchem.9b01546
Item in Clipboard
Utilizing Stimulated Raman Scattering Microscopy To Study Intracellular Distribution of Label-Free Ponatinib in Live Cells
J Med Chem.
.
Abstract
Stimulated Raman scattering (SRS) microscopy represents a powerful method for imaging label-free drug distribution with high resolution. SRS was applied to image label-free ponatinib with high sensitivity and specificity in live human chronic myeloid leukemia (CML) cell lines. This was achieved at biologically relevant, nanomolar concentrations, allowing determination of ponatinib uptake and sequestration into lysosomes during the development of acquired drug resistance and an improved understanding of target engagement.
Conflict of interest statement
The authors declare no competing financial interest.
Figures
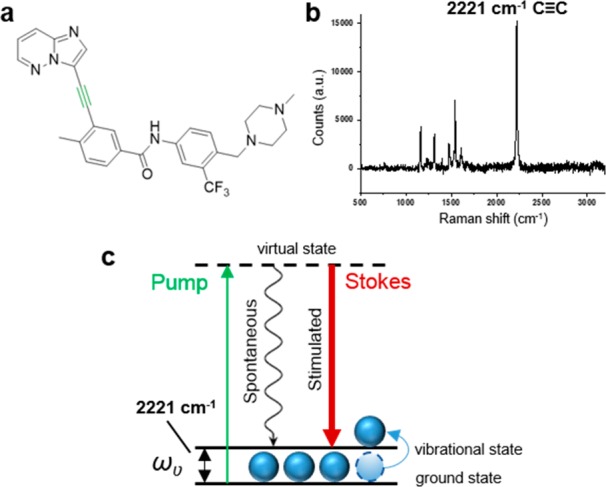
(a) Chemical structure of ponatinib; (b) Raman spectrum of solid
ponatinib. The following peak has been annotated: 2221 cm–1 (C≡C, ponatinib). Raman spectra were acquired at λex = 532 nm for 10 s using a 50× objective. (c) Energy
level diagram showing the working principle of SRS microscopy.
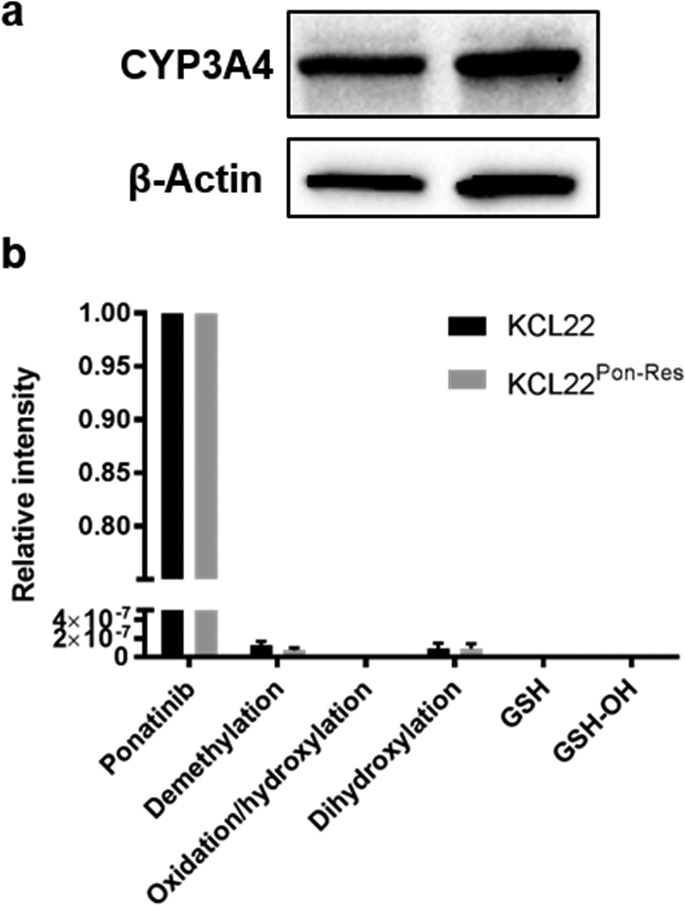
(a) Expression
of CYP3A4 in lysates from KCL22 and KCL22Pon-Res cells. β-actin was used as a loading control. (b) Ponatinib
and ponatinib metabolites identified by LC-MS. Cells were treated
with ponatinib for 1 h prior to analysis. Mean values from five biological
repeats expressed relative to ponatinib.
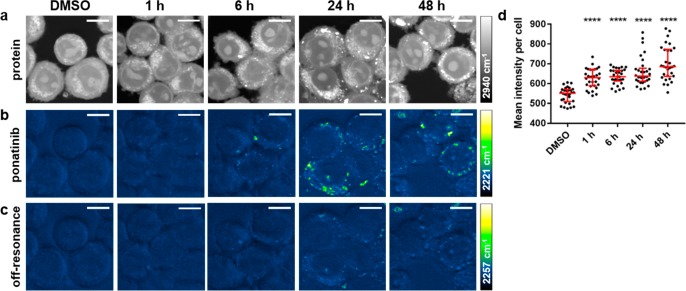
(a–c)
Imaging ponatinib uptake in KCL22Pon-Res cells.
KCL22Pon-Res cells were treated with DMSO (0.0003%,
v/v) or ponatinib (500 nM) for 1, 6, 24, or 48 h (left to right).
SRS images acquired at (a) 2940 cm–1 (CH3, proteins); (b) 2221 cm–1 (C≡C, ponatinib);
(c) 2257 cm–1 (off-resonance). Images acquired at
1024 × 1024 pixels, 20 μs pixel dwell time, laser power
p300, gain 2 with false colors applied to different detection wavenumbers.
Scale bars: 10 μm. (d) Mean ponatinib intensity per cell quantified
from 2221 cm–1 in n = 30 cells,
three biological repeats. The Mann–Whitney test was used to
compare ponatinib Raman intensity values against the DMSO control.
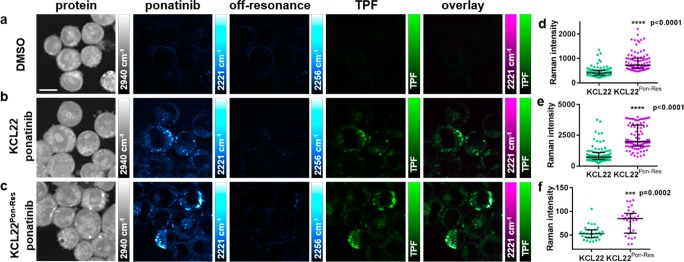
Multimodal imaging and quantitative assessment of ponatinib
uptake in KCL22 and KCL22Pon-Res cell lines. KCL22
cells were treated with (a) DMSO (0.0003%, v/v) or (b) ponatinib (5
μM, 1 h). KCL22 Pon-Res cells were treated
with (c) ponatinib (5 μM ponatinib, 1 h). SRS images acquired
at (from left to right) 2940 cm–1 (CH3, proteins), 2221 cm–1 (C≡C, ponatinib),
2257 cm–1 (off-resonance), TPF image acquired at
861 nm (Lysotracker Green), overlay of ponatinib and TPF. (d) Mean
ponatinib Raman intensity. (e) Maximum ponatinib Raman intensity inside
the vesicles of each individual cell quantified for KCL22 and KCL22Pon-Res cells that were treated with 5 μM ponatinib
for 1 h, n = 30 cells, three biological repeats.
(f) Mean ponatinib Raman intensity quantified outside of the vesicles
of individual cells, n = 10, three biological repeats.
Images acquired at 1024 × 1024 pixels, 20 μs pixel dwell
time, laser power p200 gain 1 with false colors applied to different
detection wavenumbers. Scale bars: 10 μm. The Mann–Whitney
test was used to compare ponatinib Raman intensity values, ***p < 0.0001.
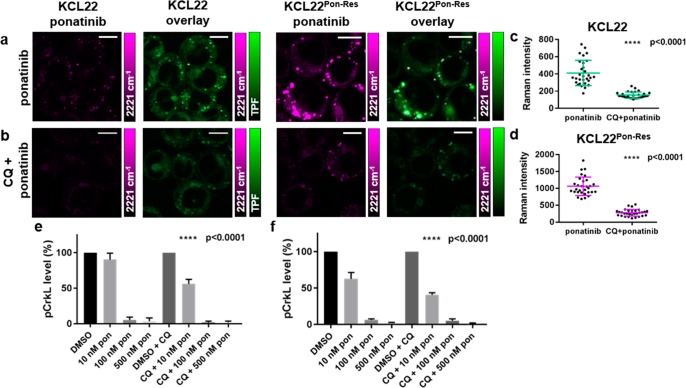
Multimodal imaging and
quantitative assessment of the effect of chloroquine treatment on
the vesicular uptake of ponatinib. KCL22 and KCL22Pon-Res cells were treated with (a) ponatinib (5 μM, 1 h), (b) chloroquine
(20 μM, 2 h) followed by combination treatment of ponatinib
(5 μM, 1 h) and chloroquine (20 μM, 1 h). Images shown
(left to right) 2221 cm–1 (C≡C, ponatinib),
overlay TPF image at 861 nm (Lysotracker Green) merged with 2221 cm–1. (c,d) Mean ponatinib Raman intensity inside the
vesicles of each individual cell quantified in (c) KCL22 and (d) KCL22Pon-Res cell line, n = 10 cells, three
biological repeats. Images acquired at 1024 × 1024 pixels, 20
μs pixel dwell time with false colors applied to different detection
wavenumbers. Scale bars: 10 μm. (e,f) p-CRKL level quantification
from Western blots where KCL22 and KCL22Pon-Res cells
were treated with (left to right) either DMSO (0.0003%, v/v), ponatinib
(10, 100, 500 nM, 1 h), or a combination of chloroquine (20 μM,
2 h) pretreatment and ponatinib (10, 100, or 500 nM, 1 h). p-CRKL
level was quantified against α-tubulin control and normalized
to DMSO using Image Lab Software. One-Way ANOVA (Tukey’s multiple
comparisons test) was used to compare ponatinib (10 nM) alone vs CQ
combination treatment.
References
-
- Waring M. J.; Arrowsmith J.; Leach A. R.; Leeson P. D.; Mandrell S.; Owen R. M.; Pairaudeau G.; Pennie W. D.; Pickett S. D.; Wang J.; Wallace O.; Weir A. An analysis of the attrition of drug candidates from four major pharmaceutical companies. Nat. Rev. Drug Discovery 2015, 14, 475–486. 10.1038/nrd4609. - DOI - PubMed
-
- Horvath P.; Aulner N.; Bickle M.; Davies A. M.; Nery E. D.; Ebner D.; Montoya M. C.; Ostling P.; Pietiainen V.; Price L. S.; Shorte S. L.; Turcatti G.; von Schantz C.; Carragher N. O. Screening out irrelevant cell-based models of disease. Nat. Rev. Drug Discovery 2016, 15, 751–769. 10.1038/nrd.2016.175. - DOI - PubMed
Publication types
MeSH terms
Substances
Grants and funding
LinkOut - more resources
Full Text Sources
