. 2020 Feb;193(2):143-154.
doi: 10.1667/RR15476.1. Epub 2019 Dec 12.

Generation of a Transcriptional Radiation Exposure Signature in Human Blood Using Long-Read Nanopore Sequencing

Affiliations

Generation of a Transcriptional Radiation Exposure Signature in Human Blood Using Long-Read Nanopore Sequencing

Lourdes Cruz-Garcia et al. Radiat Res. 2020 Feb.

Abstract

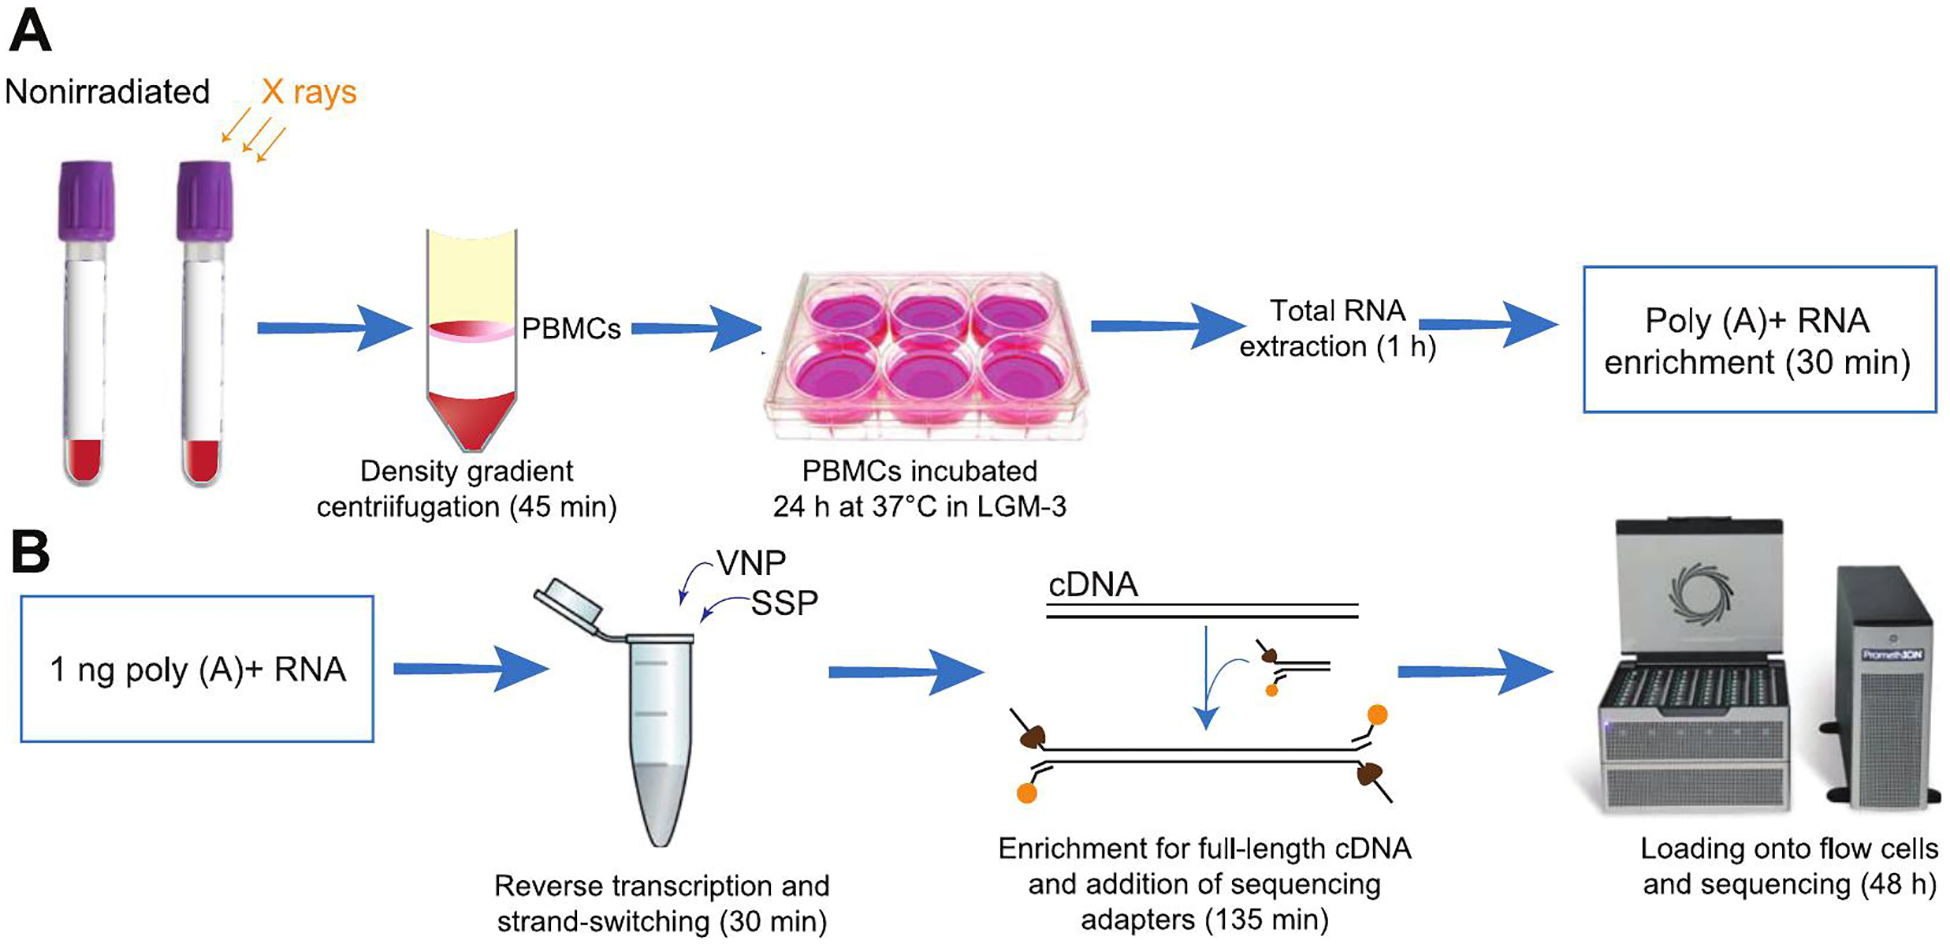
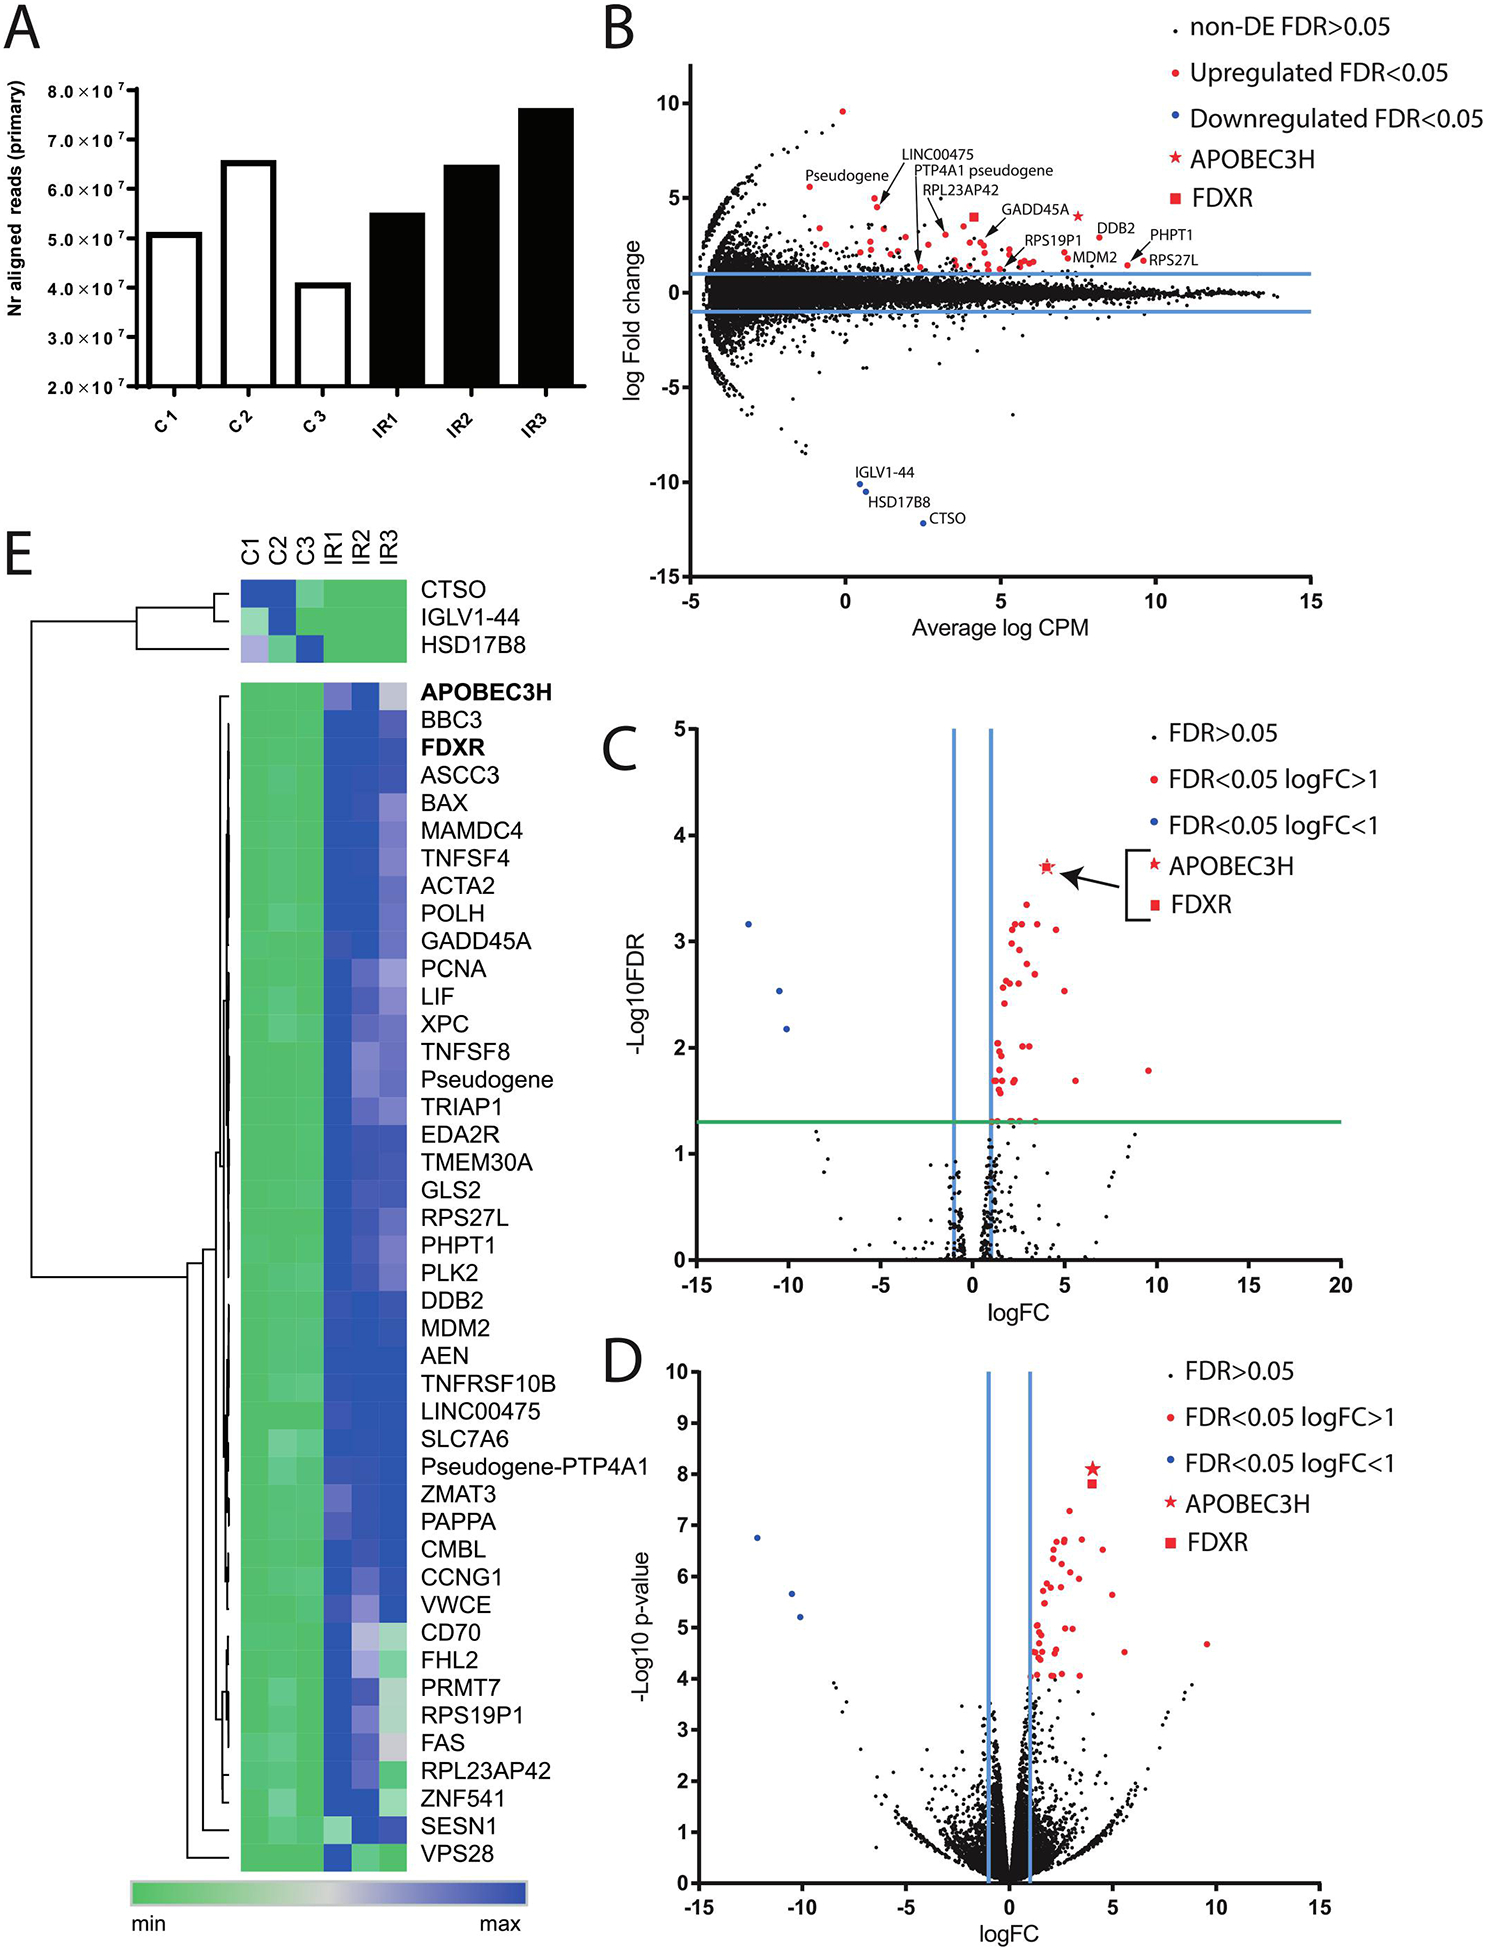
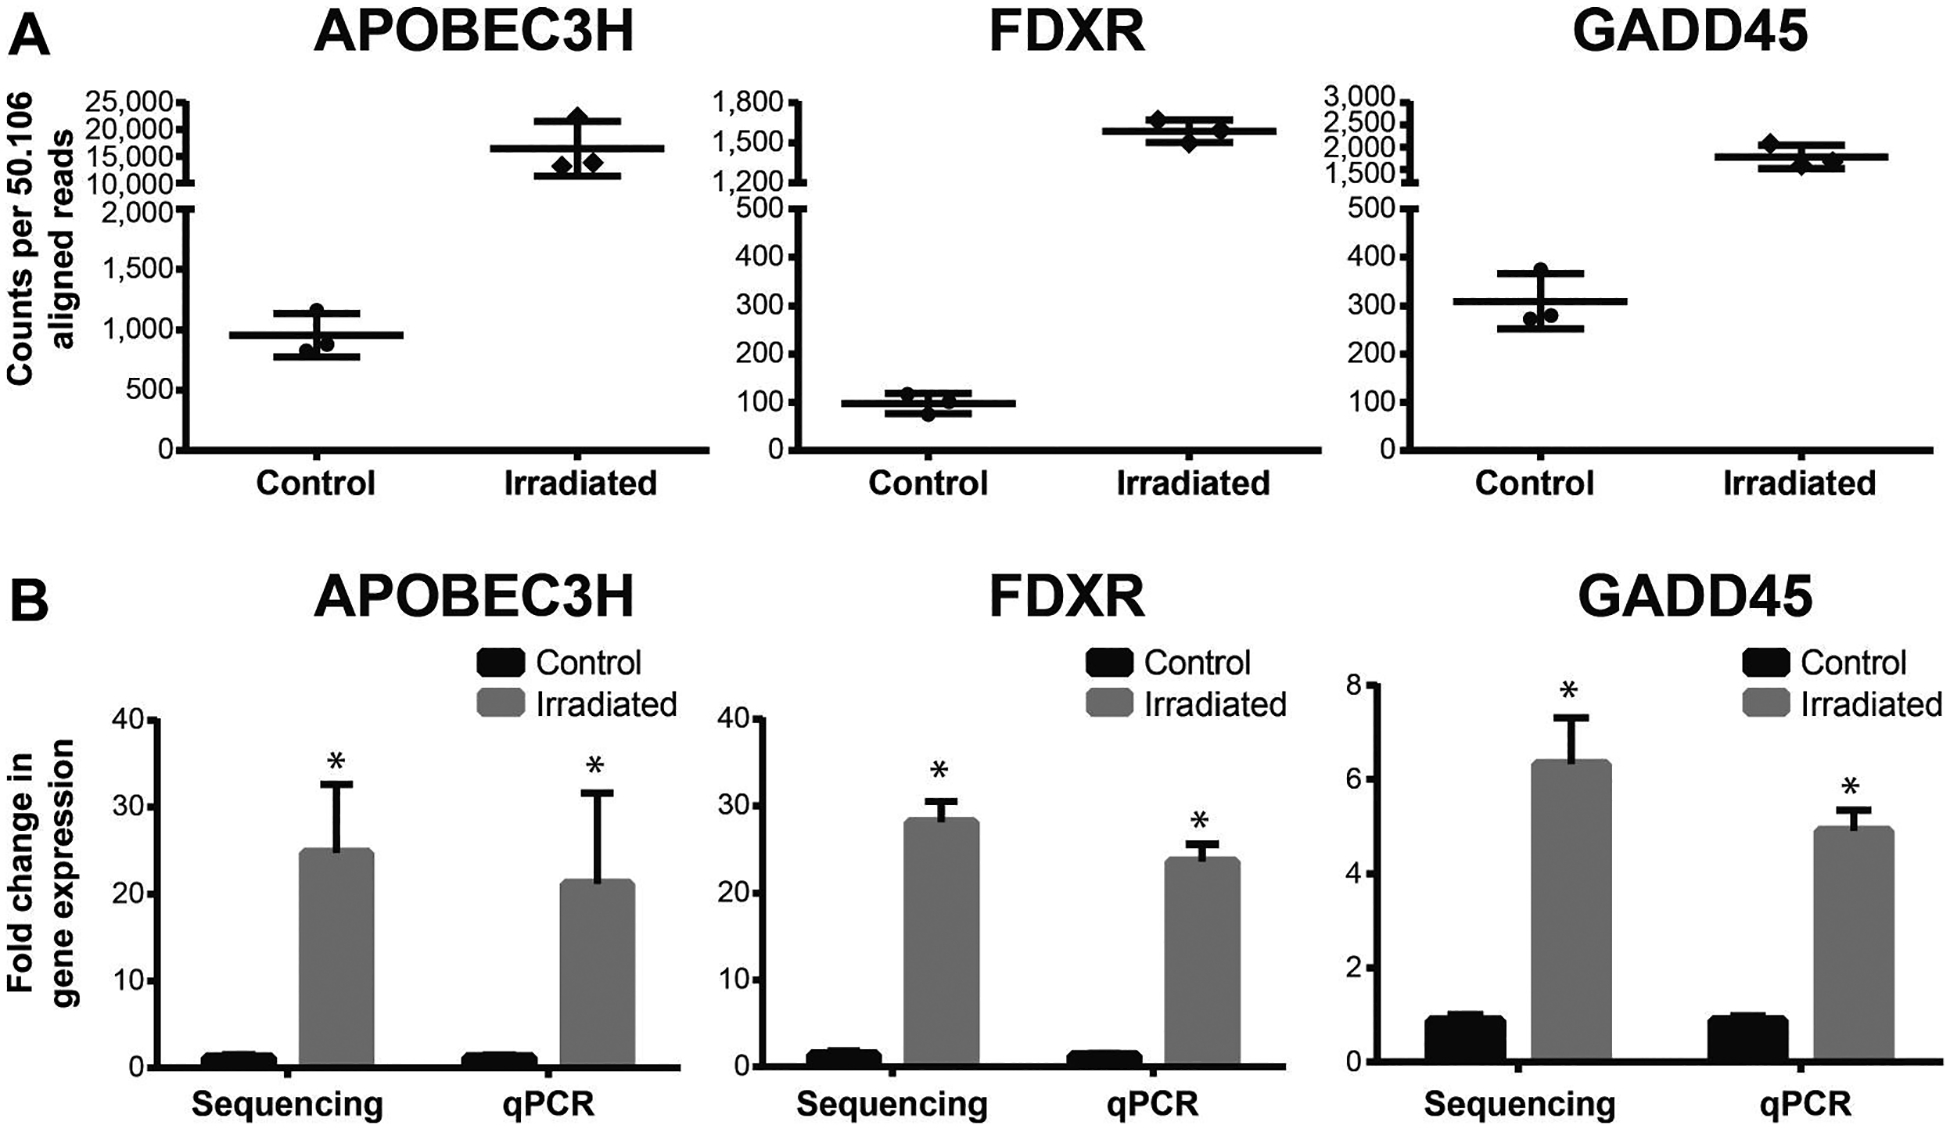
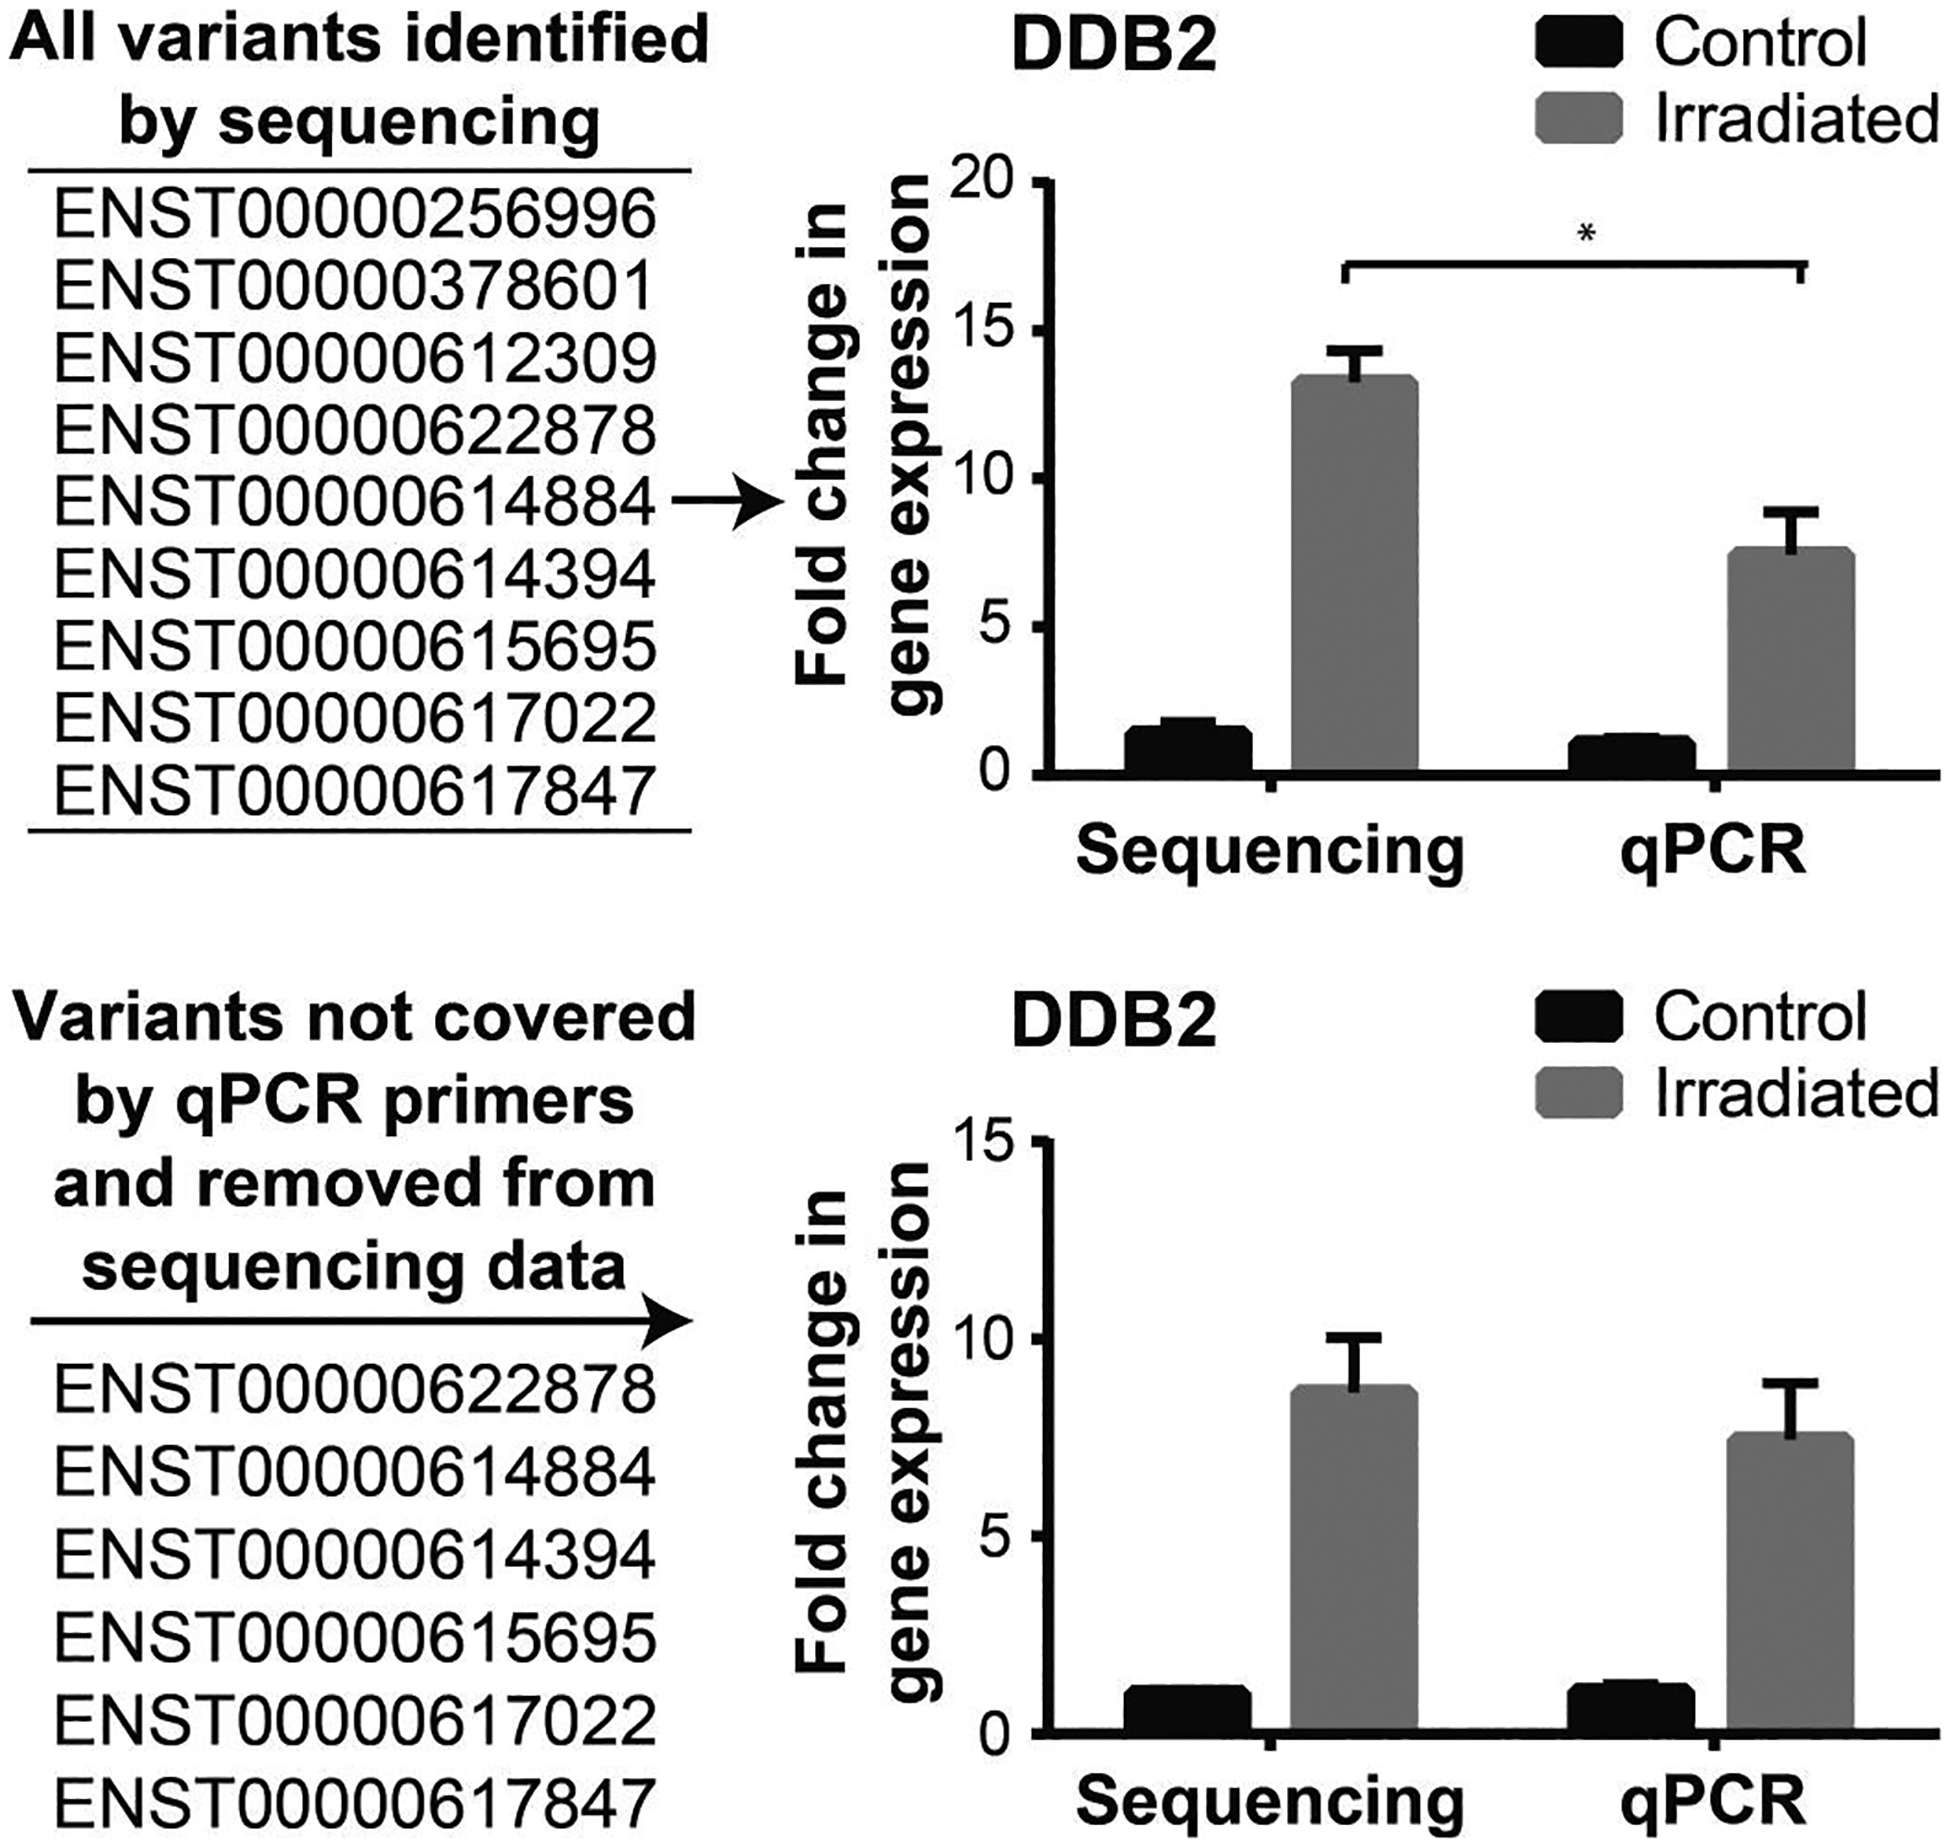
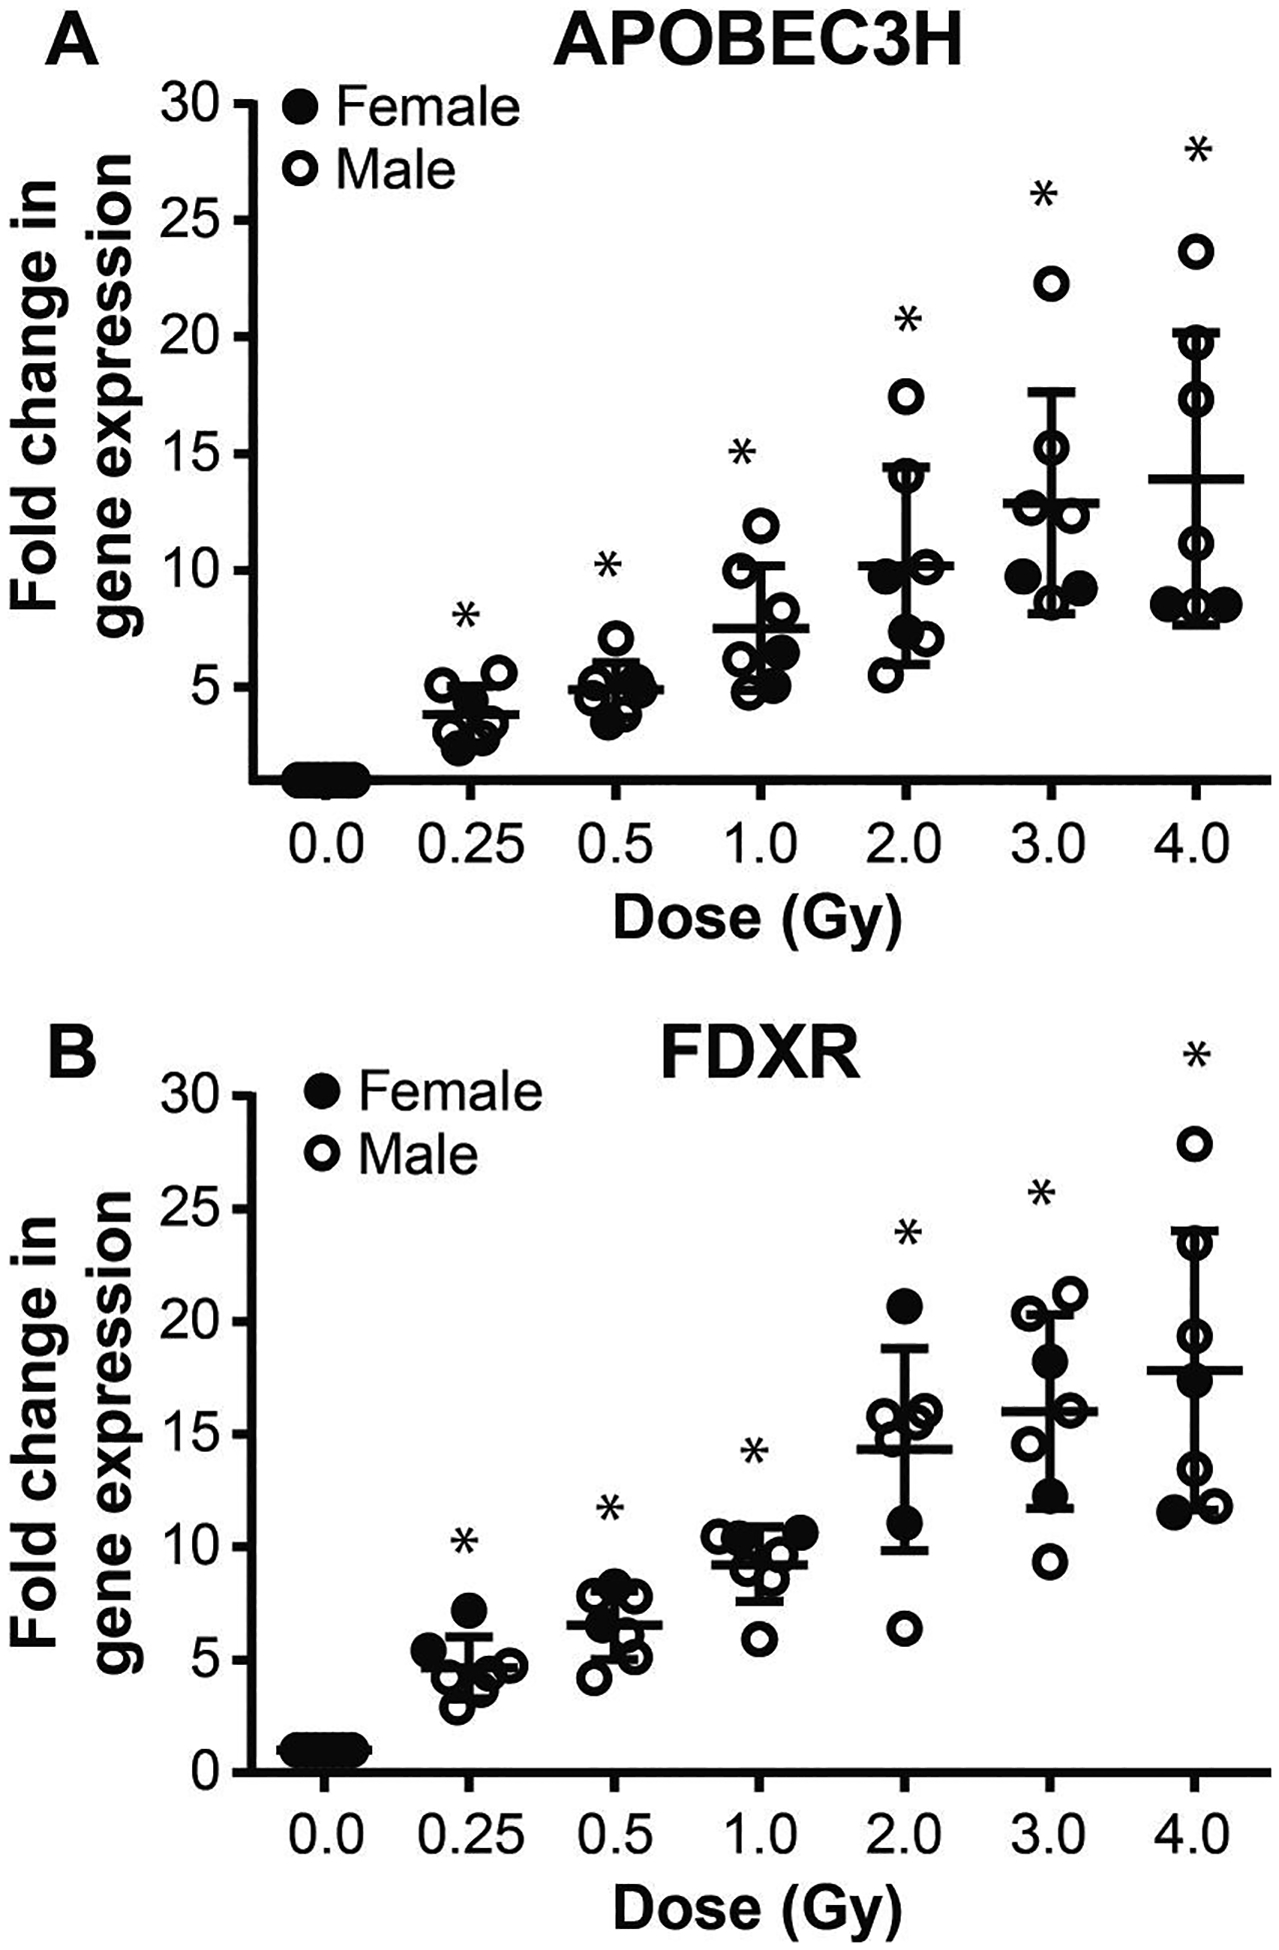
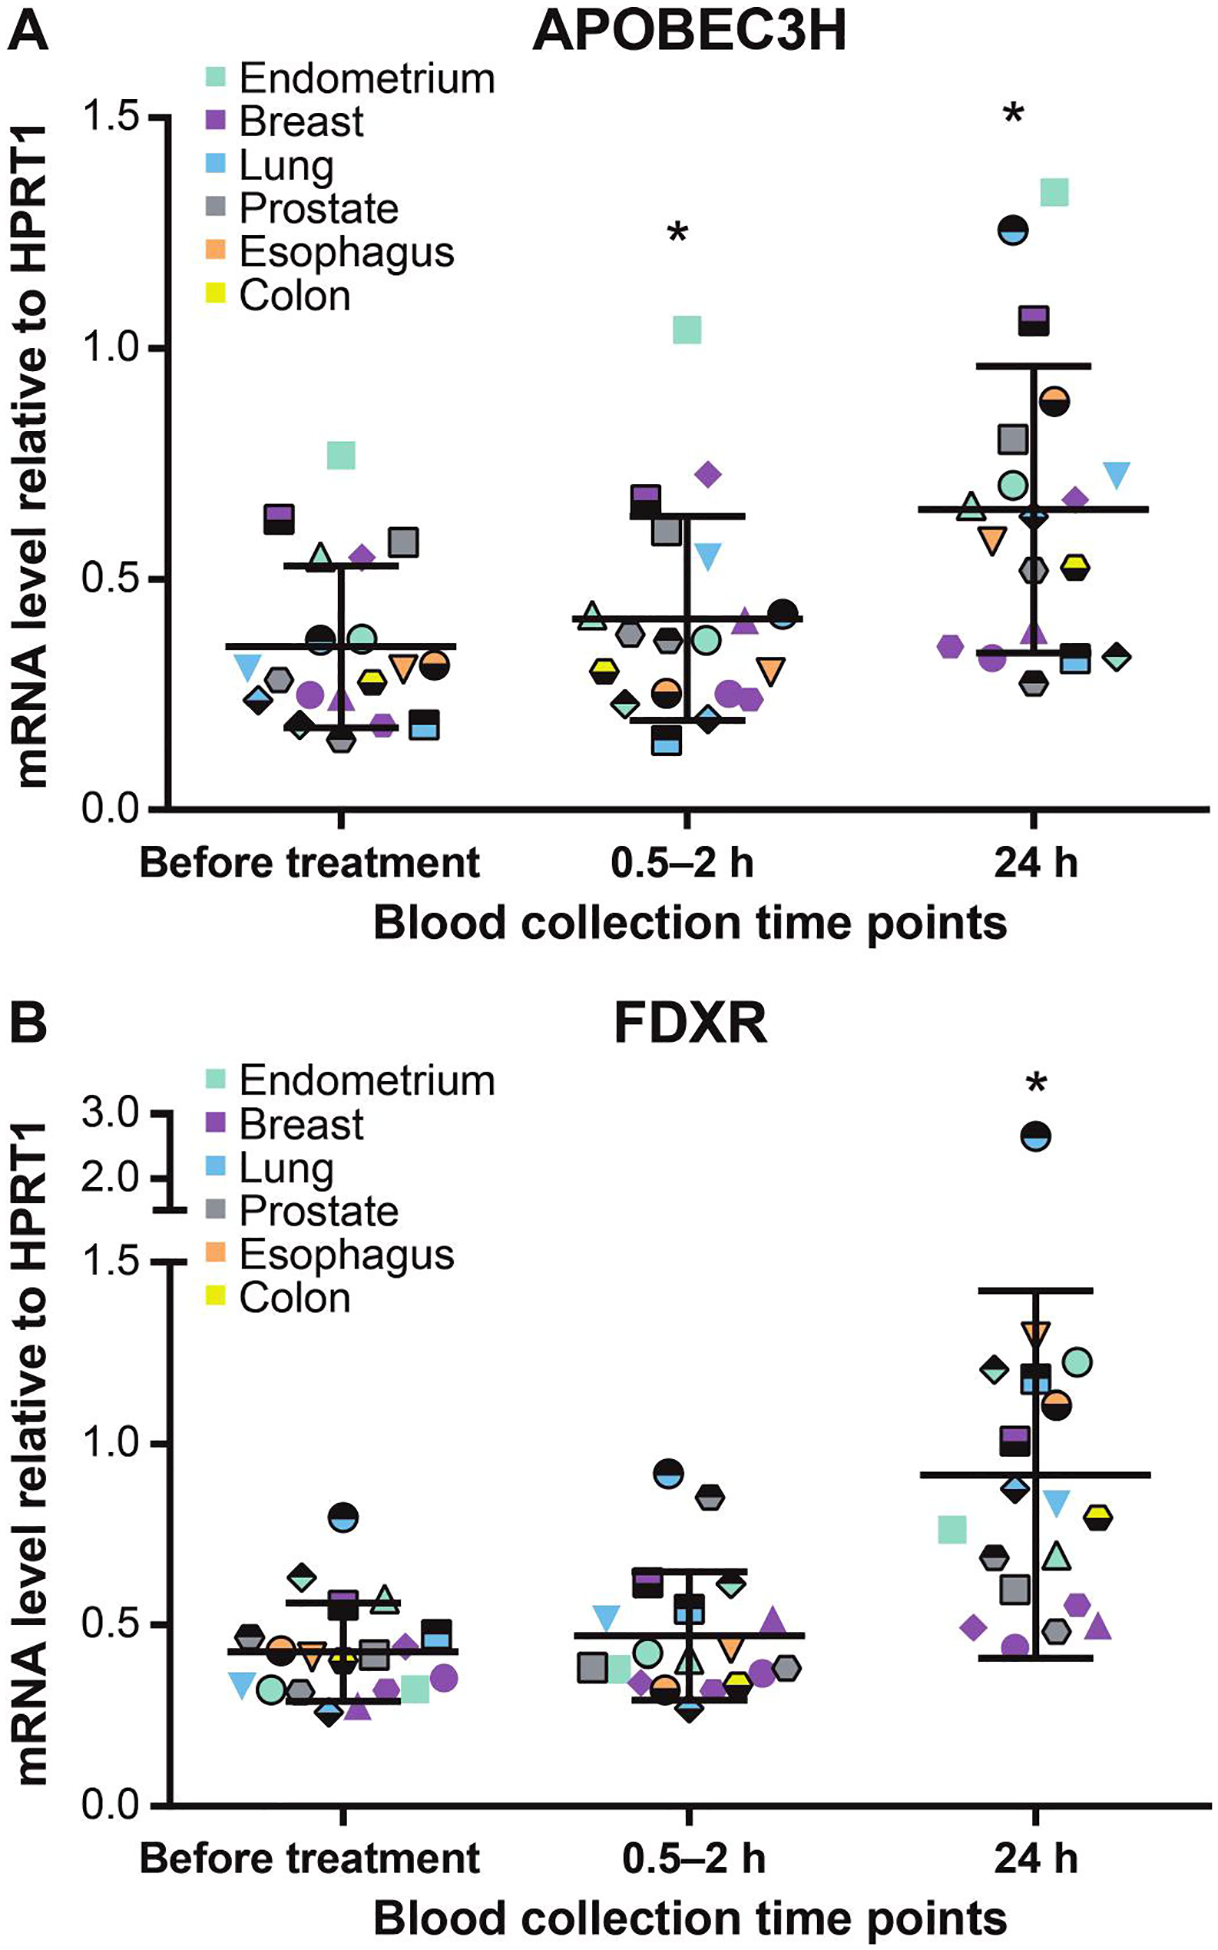
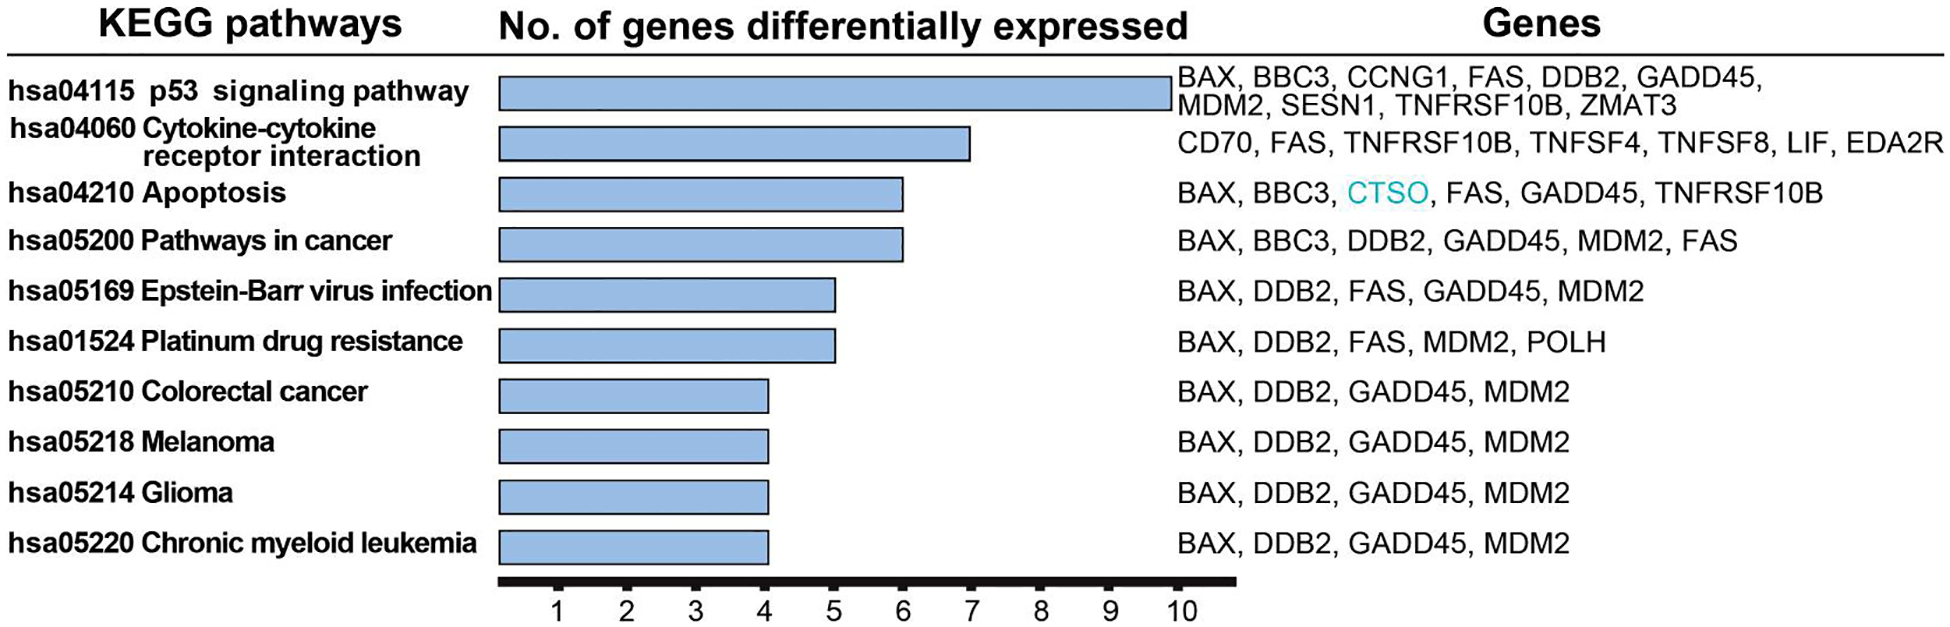
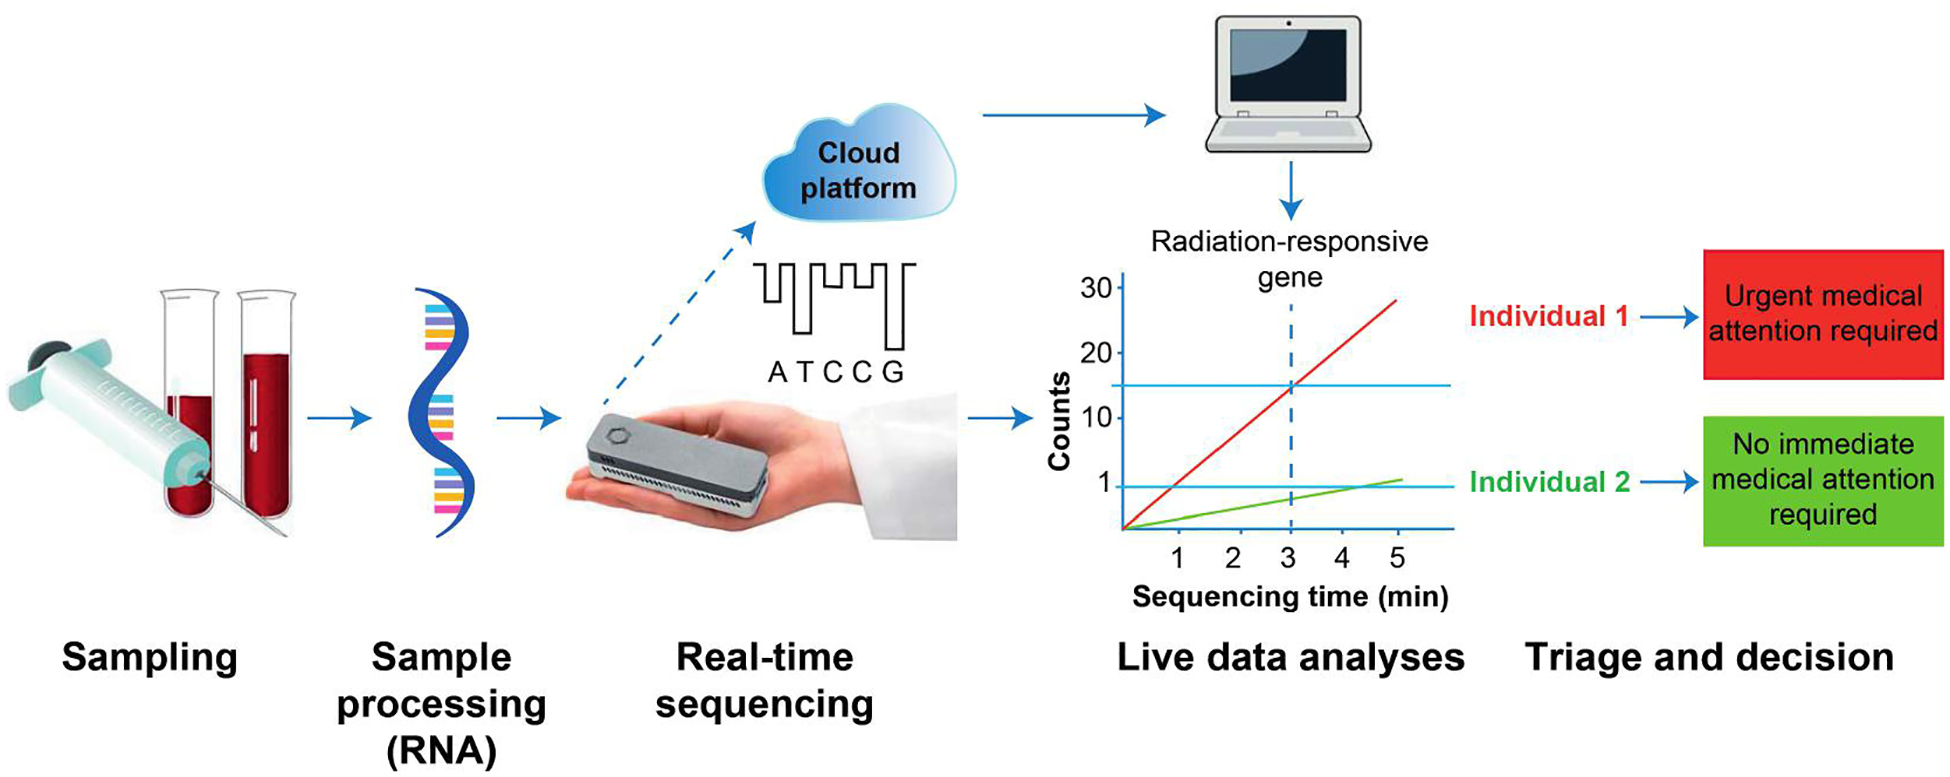
In the event of a large-scale event leading to acute ionizing radiation exposure, high-throughput methods would be required to assess individual dose estimates for triage purposes. Blood-based gene expression is a broad source of biomarkers of radiation exposure which have great potential for providing rapid dose estimates for a large population. Time is a crucial component in radiological emergencies and the shipment of blood samples to relevant laboratories presents a concern. In this study, we performed nanopore sequencing analysis to determine if the technology can be used to detect radiation-inducible genes in human peripheral blood mononuclear cells (PBMCs). The technology offers not only long-read sequencing but also a portable device which can overcome issues involving sample shipment, and provide faster results. For this goal, blood from nine healthy volunteers was 2 Gy ex vivo X irradiated. After PBMC isolation, irradiated samples were incubated along with the controls for 24 h at 37°C. RNA was extracted, poly(A)+ enriched and reverse-transcribed before sequencing. The data generated was analyzed using a Snakemake pipeline modified to handle paired samples. The sequencing analysis identified a radiation signature consisting of 46 differentially expressed genes (DEGs) which included 41 protein-coding genes, a long non-coding RNA and four pseudogenes, five of which have been identified as radiation-responsive transcripts for the first time. The genes in which transcriptional expression is most significantly modified after radiation exposure were APOBEC3H and FDXR, presenting a 25- and 28-fold change on average, respectively. These levels of transcriptional response were comparable to results we obtained by quantitative polymerase chain reaction (qPCR) analysis. In vivo exposure analyses showed a transcriptional radioresponse at 24 h postirradiation for both genes together with a strong dose-dependent response in blood irradiated ex vivo. Finally, extrapolating from the data we obtained, the minimum sequencing time required to detect an irradiated sample using APOBEC3H transcripts would be less than 3 min for a total of 50,000 reads. Future improvements, in sample processing and bioinformatic pipeline for specific radiation-responsive transcript identification, will allow the provision of a portable, rapid, real-time biodosimetry platform based on this new sequencing technology. In summary, our data show that nanopore sequencing can identify radiation-responsive genes and can also be used for identification of new transcripts.


Figures

FIG. 1.
FIG. 1.
Experimental workflow. Panel A: Blood from nine healthy donors (20 ml per donor), which was sham or 2 Gy irradiated (dose rate 0.5 Gy min−1) ex vivo, was used to isolate PBMCs by a density gradient centrifugation. The PBMCs were incubated for 24 h at 37°C before the RNA was extracted. The total RNA obtained was poly(A)+ enriched to remove ribosomal RNAs from the samples. Panel B: A total of 1 ng from the poly(A)+-enriched RNA was used for the sequencing analysis. The RNA was reverse transcribed using VN and strand-switching (SSP) primers. A PCR amplification step was performed to enrich the samples for full-length cDNAs followed by the addition of sequencing adapters. The samples were run in two SpotON flow cells per sample in a PromethION sequencer. The time required for each step of the protocol is included in the diagram.
FIG. 2.
FIG. 2.
Gene expression analysis of ex vivo irradiated blood by long-read nanopore RNA sequencing. Panel A: Sequencing depth per library (number of reads per sample/library). Panel B: MA plot showing the differential expressed genes between the control and irradiated samples. The blue lines indicate genes that are up- or downregulated two-fold. Panel C: Volcano plot representing the FDR (−log10 FDR) versus fold change (log FC). The green line indicates a FDR value of 0.05. Panel D: Volcano plot representing significance (−log10 P value) versus fold change (log FC). Panel E: Heatmap of the normalized counts to HPRT. The 46 genes significantly regulated by radiation exposure were grouped by hierarchical clustering. Differential gene expression was detected using the quasi-likelihood method provided by the edgeR.
FIG. 3.
FIG. 3.
Number of read counts per gene and comparison of the radiation response of APOBEC3H, FDXR and GADD45 by nanopore long-read sequencing analysis versus qPCR. Panel A: The abundance of reads per gene is shown for the control and irradiated samples (counts normalized by library size). Panel B: The fold change between the control and irradiated samples was compared between sequencing and qPCR analyses. Data are shown as mean ± standard deviation. No significant differences were observed (t test, P < 0.05) between sequencing and qPCR analysis. *Significant differences between control and irradiated sample (t test, P ≤ 0.05).
FIG. 4.
FIG. 4.
Effect of transcript variant identification by nanopore sequencing on radiation response. The fold change for DDB2 was compared between nanopore sequencing and qPCR analyses, including or excluding specific transcript variants. The variants excluded were not detected with the qPCR primer designs. *Statistically significant differences (t test, P ≤ 0.05).
FIG. 5.
FIG. 5.
Dose-response analyses of APOBEC3H and FDXR. Multiplexed QRT-PCR gene expression fold changes of APOBEC3H and FDXR (panels A and B, respectively) 24 h postirradiation in blood samples from seven healthy donors exposed ex vivo to a range of doses (0.25, 0.5, 1, 2, 3, 4 Gy; 0.5 Gy min−1). *Significantly different from control (paired t test, P ≤ 0.001).
FIG. 6.
FIG. 6.
mRNA expression levels of APOBEC3H and FDXR (panels A and B, respectively) in blood from radiotherapy patients. Blood samples from 19 patients, comprising those with endometrial, breast, lung, prostate, esophageal and colon cancer, were analyzed. Blood was collected at three time points: before the start of the treatment, at 0.5–2 h and 24 h after the first fraction. Individual data points are shown for all patients, together with the mean ± SD (each patient is represented with a different symbol). Each cancer group was color coded. Statistical analyses were performed in log-transformed data. *Significantly different from the control (before treatment) (paired t test, P ≤ 0.05).
FIG. 7.
FIG. 7.
KEGG pathway analysis for DEGs between control and irradiated PBMCs. All the genes listed were upregulated apart from CTSO (highlighted in blue).
FIG. 8.
FIG. 8.
Biodosimetry workflow. Future research will continue in the direction of the development of a fast-analytical platform by using portable third-generation sequencing technology and the panel of genes presented in this study.

References

    1. Hall J, Jeggo PA, West C, Gomolka M, Quintens R, Badie C, et al. Ionizing radiation biomarkers in epidemiological studies – An update. Mutat Res 2017; 771:59–84. - PubMed
    1. Tichy A, Kabacik S, O’Brien G, Pejchal J Sinkorova Z, Kmochova A, et al. The first in vivo multiparametric comparison of different radiation exposure biomarkers in human blood. PLOS One 2018; 13:e0193412. - PMC - PubMed
    1. Ainsbury E, Badie C, Barnard S, Manning G, Moquet J, Abend M, et al. Integration of new biological and physical retrospective dosimetry methods into EU emergency response plans - joint RENEB and EURADOS inter-laboratory comparisons. Int J Radiat Biol 2017; 93:99–109. - PubMed
    1. Kulka U, Abend M, Ainsbury E, Badie C, Barquinero JF, Barrios L, et al. RENEB - Running the European Network of biological dosimetry and physical retrospective dosimetry. Int J Radiat Biol 2017; 93:2–14. - PubMed
    1. Meadows SK, Dressman HK, Muramoto GG, Himburg H, Salter A, Wei ZZ, et al. Gene expression signatures of radiation response are specific, durable and accurate in mice and humans. PLoS One 2008; 3. - PMC - PubMed

Publication types

MeSH terms