. 2020 Jan 16;5(1):e133276.
doi: 10.1172/jci.insight.133276.

Glucocorticoids counteract hypertrophic effects of myostatin inhibition in dystrophic muscle

Affiliations

Glucocorticoids counteract hypertrophic effects of myostatin inhibition in dystrophic muscle

David W Hammers et al. JCI Insight. .

Abstract

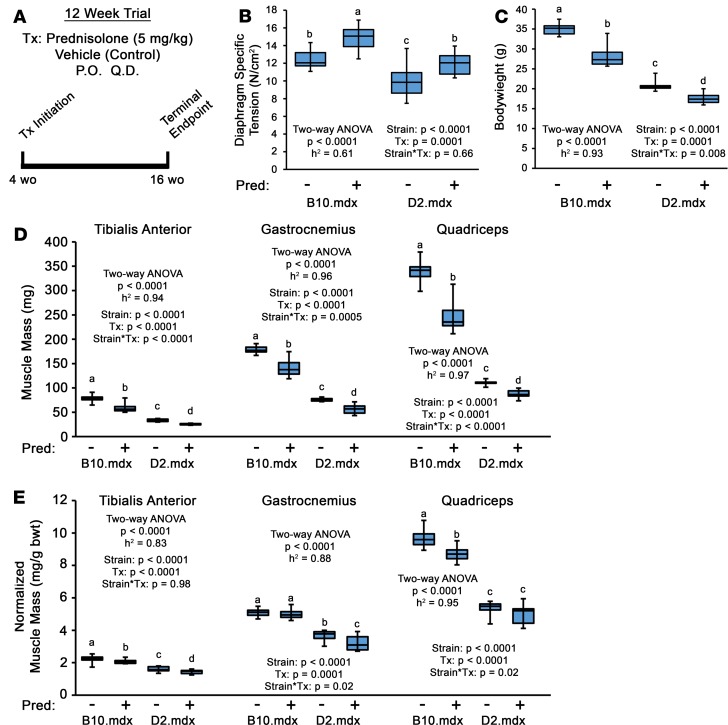
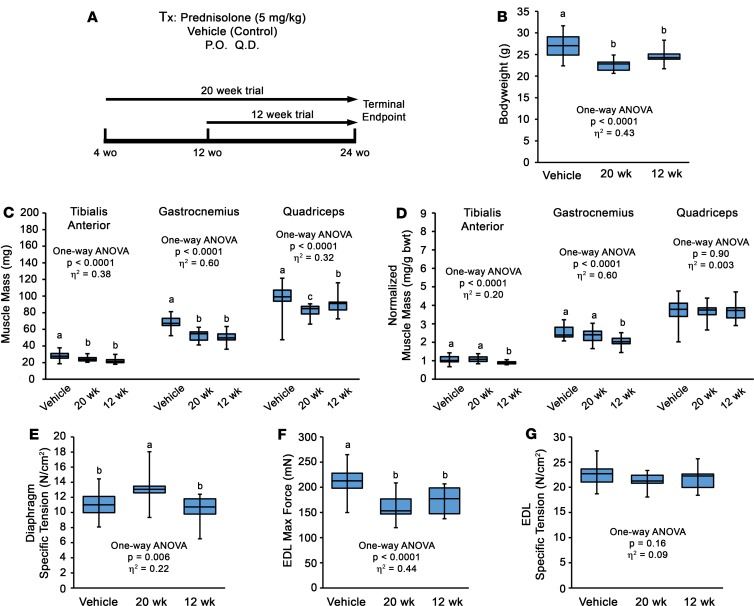
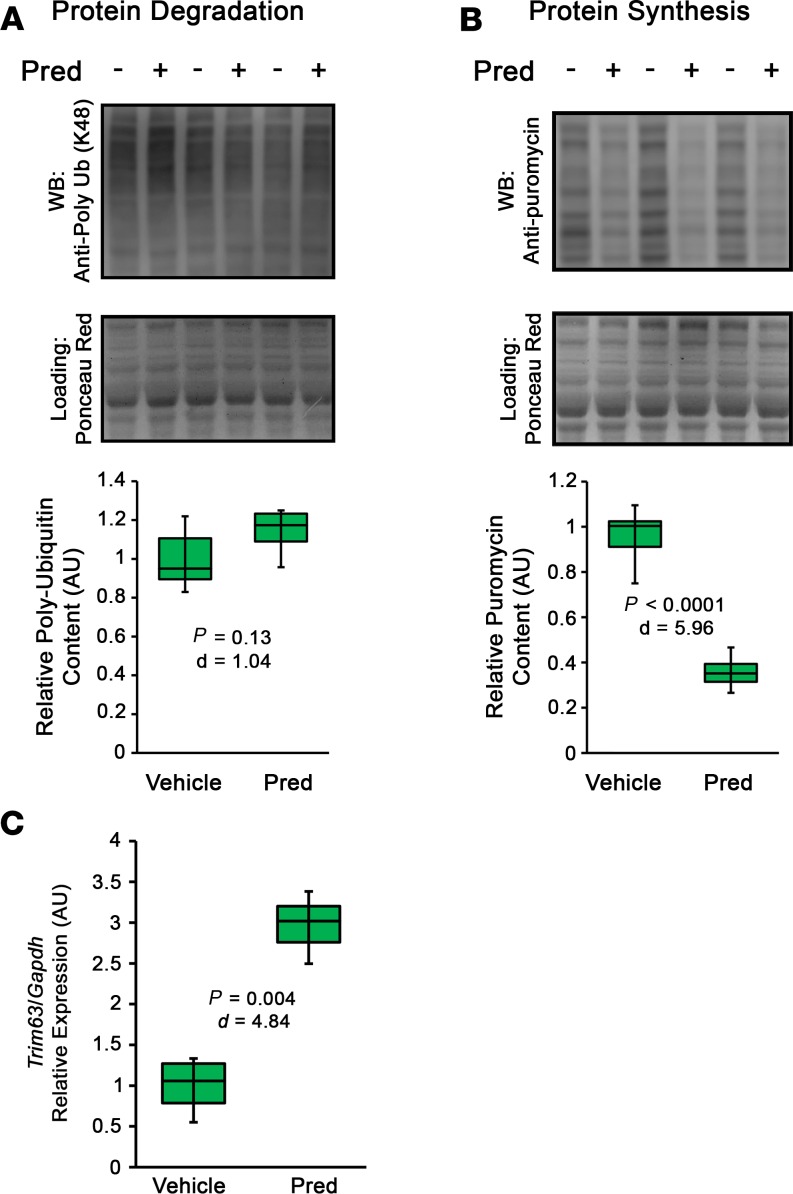
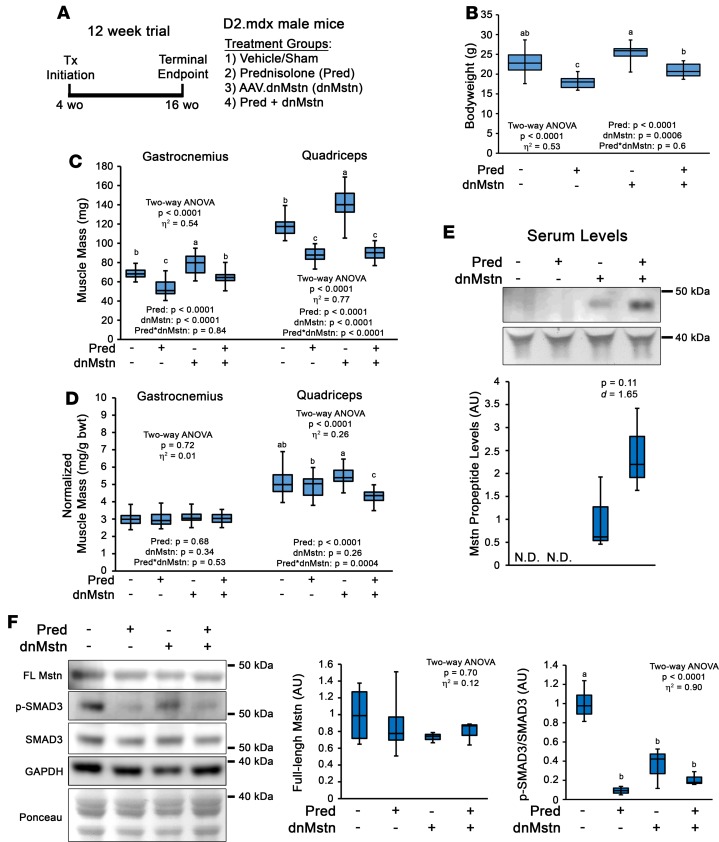
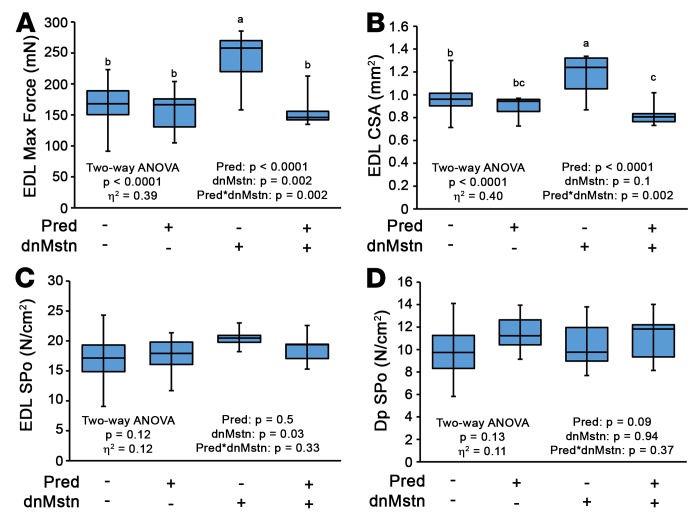
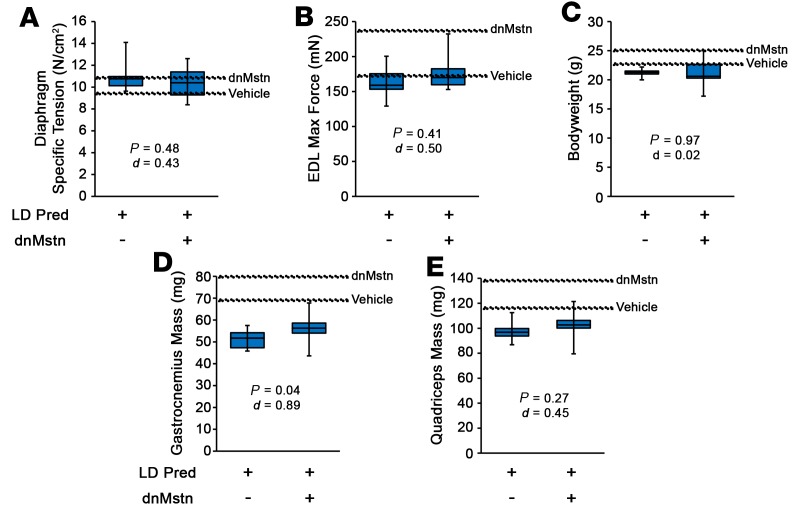
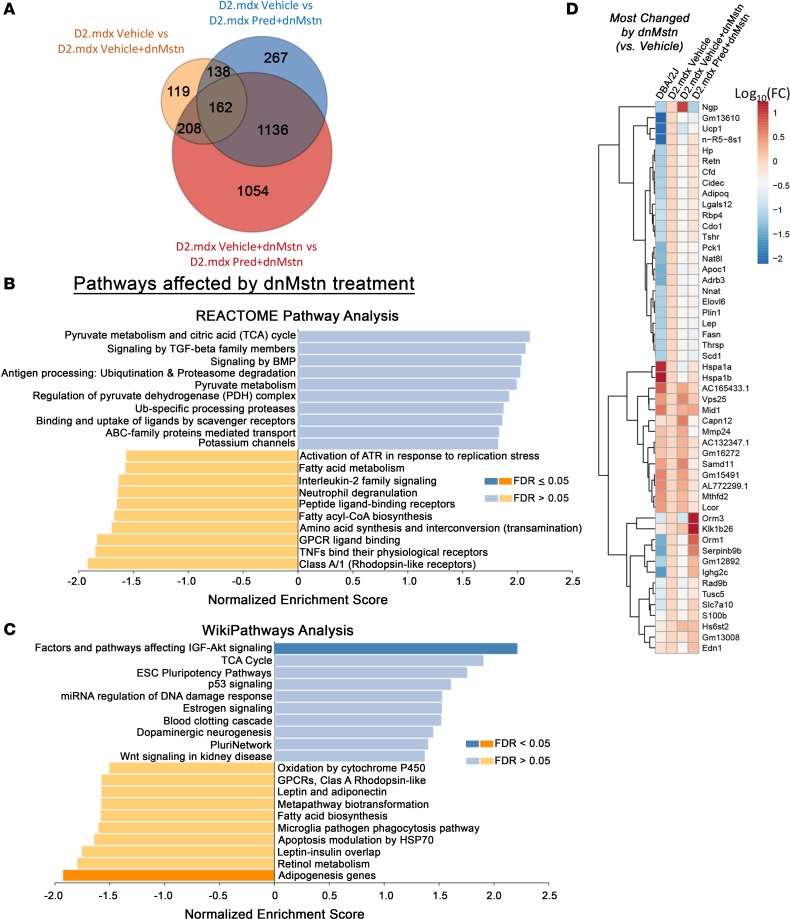
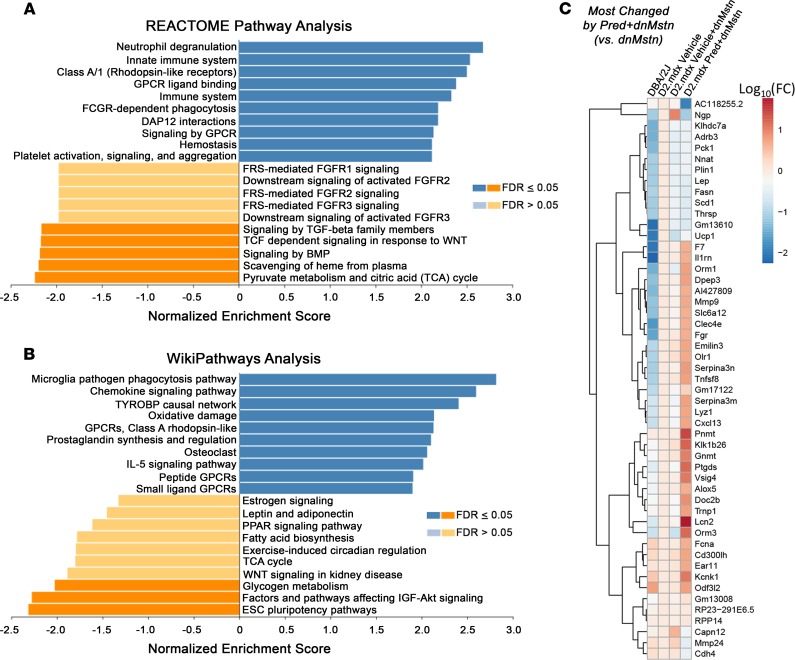
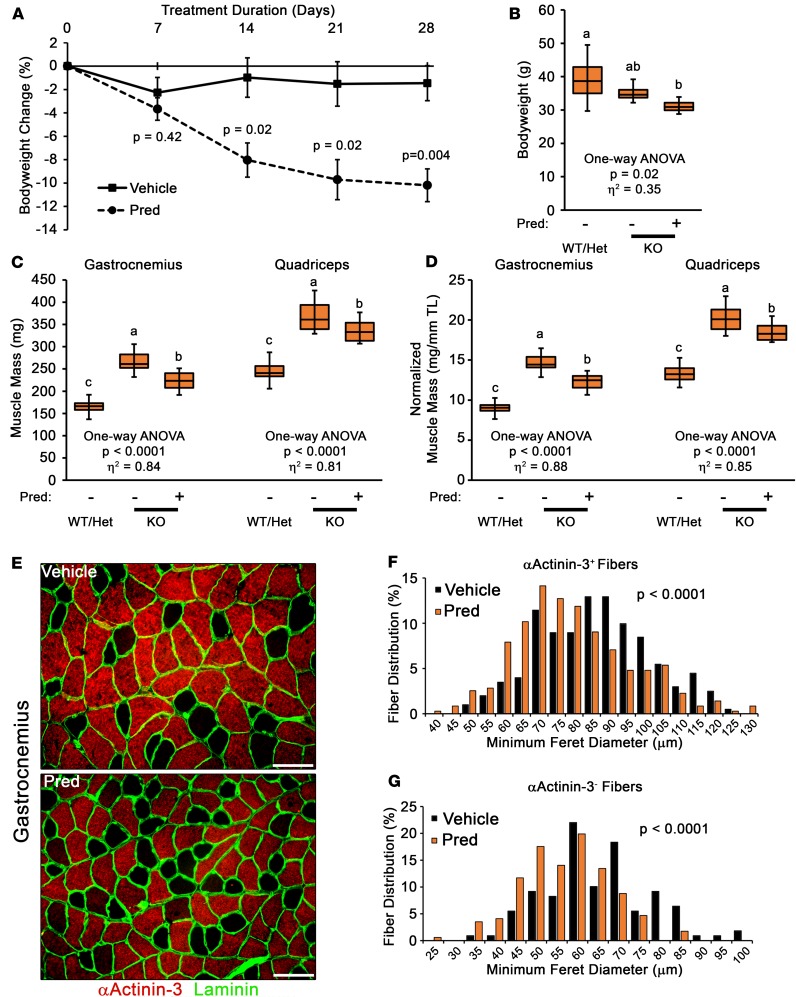
Duchenne muscular dystrophy (DMD) is a devastating genetic muscle disease resulting in progressive muscle degeneration and wasting. Glucocorticoids, specifically prednisone/prednisolone and deflazacort, are commonly used by DMD patients. Emerging DMD therapeutics include those targeting the muscle-wasting factor, myostatin (Mstn). The aim of this study was to investigate how chronic glucocorticoid treatment impacts the efficacy of Mstn inhibition in the D2.mdx mouse model of DMD. We report that chronic treatment of dystrophic mice with prednisolone (Pred) causes significant muscle wasting, entailing both activation of the ubiquitin-proteasome degradation pathway and inhibition of muscle protein synthesis. Combining Pred with Mstn inhibition, using a modified Mstn propeptide (dnMstn), completely abrogates the muscle hypertrophic effects of Mstn inhibition independently of Mstn expression or SMAD3 activation. Transcriptomic analysis identified that combining Pred with dnMstn treatment affects gene expression profiles associated with inflammation, metabolism, and fibrosis. Additionally, we demonstrate that Pred-induced muscle atrophy is not prevented by Mstn ablation. Therefore, glucocorticoids interfere with potential muscle mass benefits associated with targeting Mstn, and the ramifications of glucocorticoid use should be a consideration during clinical trial design for DMD therapeutics. These results have significant implications for past and future Mstn inhibition trials in DMD.

Keywords: Monogenic diseases; Muscle; Muscle Biology; Therapeutics; Translation.


Conflict of interest statement

Conflict of interest: The authors have declared no conflict of interest exists.

Figures

Figure 1
Figure 1. Chronic prednisolone treatment induces muscle wasting in mdx mouse model of DMD regardless of genetic background.
(A) Preclinical trial design consisting of male mdx mice of C57BL/10 (B10.mdx) and DBA/2J (D2.mdx) genetic backgrounds receiving daily oral treatments of vehicle or 5 mg/kg prednisolone (Pred; n = 8–10). Treatments were initiated at 4 weeks of age and terminated at 16 weeks of age (12 weeks of treatment). (B) Ex vivo muscle function of the diaphragm was evaluated at terminal endpoint. (C–E) Body weights (C), absolute muscle masses (D), and body weight-normalized muscle masses (E) measured at terminal endpoint. Data were analyzed using 2-way ANOVA (strain and treatment effects; effect size reported as η2), followed by Tukey’s post hoc tests (α = 0.05). Data are presented as box-and-whisker plots, with minimum and maximum values indicated by error bars; data are shown as mean ± SEM. Groups that are significantly different from each other are indicated by nonoverlapping letter designations (P ≤ 0.05).
Figure 2
Figure 2. Delayed prednisolone treatment does not prevent muscle atrophy in D2.mdx mice.
(A) Male D2.mdx mice received daily oral treatments of vehicle or 5 mg/kg prednisolone (Pred) that was initiated at either 4 or 12 weeks of age. (B–G) Terminal endpoint body weights (B), absolute muscle masses (C), body weight-normalized muscle masses (D), diaphragm (E), and extensor digitorum longus (EDL) (F and G) functional evaluations are reported. Data were analyzed using 1-way ANOVA (effect size reported as η2), followed by Tukey’s post hoc tests (α = 0.05). Data are presented as box-and-whisker plots, with minimum and maximum values indicated by error bars; data are shown as mean ± SEM. Groups that are significantly different from each other are indicated by nonoverlapping letter designations (P ≤ 0.05).
Figure 3
Figure 3. Chronic prednisolone treatment affects skeletal muscle protein balance in vivo.
Adult male DBA/2J mice received daily oral treatments with vehicle or 5 mg/kg prednisolone (Pred) for 10 days. (A) To assess relative protein degradation, vehicle- and Pred-treated mice (n = 5–6) received a s.c. injection of 20 mg/kg of the proteasome inhibitor, MG-132, 24 hours prior to terminal endpoint. The accumulation of poly-ubiquitinated (K-48 linkage) proteins was assessed by immunoblotting of quadriceps muscle lysates. (B) To assess relative protein synthesis, vehicle- and Pred-treated mice (n = 6) received an i.p. injection of 20 mg/kg puromycin 30 minutes prior to terminal endpoint. The prevalence of puromycin-labeled peptides was assayed by immunoblotting using an anti-puromycin antibody. Ponceau red staining was used to visualize protein loading for immunoblot signal normalization. (C) Relative gene expression of the ubiquitin E3-ligase, Trim63, in quadriceps muscle of DBA/2J mice following a single dose of vehicle or Pred (n = 3), normalized to Gapdh. Data were analyzed using Welch’s t test (α = 0.05), with effect size reported as Cohen’s d (d). Data are presented as box-and-whisker plots, with minimum and maximum values indicated by error bars; data are shown as mean ± SEM.
Figure 4
Figure 4. Chronic prednisolone treatment negates muscle hypertrophic effects of myostatin inhibition in D2.mdx mice.
(A) Preclinical trial design consisting of male D2.mdx mice receiving daily oral treatments of vehicle or 5 mg/kg prednisolone (Pred) initiated at 4 weeks of age. At 6 weeks of age, mice received a single sham control or adeno-associated virus–mediated (AAV-mediated) myostatin (Mstn) inhibitor (AAV8.dnMstn) i.p. injection, and the terminal endpoint was 16 weeks of age (n = 7–23). (B–D) body weights (B), absolute muscle masses (C), and body weight-normalized muscle masses (D) were measured at terminal endpoint. (E) Mstn propeptide levels were measured in serum samples from treatment groups by immunoblotting using Mstn N-terminal antibody (N.D., not detected). (F) Immunoblotting of tibialis anterior muscle lysates for full-length Mstn, phosphorylated SMAD3 (p-SMAD3; S425/427), or total SMAD3 protein levels. Ponceau red staining was used to visualize protein loading for immunoblot signal normalization. GAPDH content is shown for immunoblotting verification of equal loading. Data were analyzed using 2-way ANOVA (strain and treatment effects; effect size reported as η2), followed by Tukey’s post hoc tests (α = 0.05). Data are presented as box-and-whisker plots, with minimum and maximum values indicated by error bars; data are shown as mean ± SEM. Groups that are significantly different from each other are indicated by nonoverlapping letter designations (P ≤ 0.05).
Figure 5
Figure 5. Muscle functional benefits of myostatin inhibition are blocked by chronic prednisolone treatment.
Ex vivo muscle function evaluation of the extensor digitorum longus (EDL) and diaphragm (Dp) from mice of the study depicted in Figure 4A. (A–D) Max force (A), cross-sectional area (CSA) (B), specific tension (SPo) of the EDL (C), and SPo of the Dp (D) are reported. Data were analyzed using 2-way ANOVA (strain and treatment effects; effect size reported as η2), followed by Tukey’s post-hoc tests (α = 0.05). Data are presented as box-and-whisker plots, with minimum and maximum values indicated by error bars; data are shown as mean ± SEM. Groups that are significantly different from each other are indicated by nonoverlapping letter designations (P ≤ 0.05).
Figure 6
Figure 6. Low-dose prednisolone treatment does not unmask muscle hypertrophy when combined with myostatin inhibition.
Male D2.mdx mice received daily oral treatments of 1 mg/kg prednisolone (LD Pred) beginning at 4 weeks of age and received a single i.p. injection of either sham of AAV.dnMstn at 6 weeks of age (n = 5–7). (A–E) At terminal endpoint (16 weeks of age), ex vivo muscle function of diaphragm (A) and extensor digitorum longus (EDL) (B) was evaluated, and mouse body weights (C) and muscle masses (D and E) were recorded. Vehicle and dnMstn mean values from Figures 4 And 5 are shown for comparison. Data were analyzed using Welch’s t test (α = 0.05), with effect size reported as Cohen’s d (d). Data are presented as box-and-whisker plots, with minimum and maximum values indicated by error bars; data are shown as mean ± SEM.
Figure 7
Figure 7. Transcriptomic analysis of most-changed genes by myostatin inhibition in dystrophic skeletal muscle.
RNA-seq transcriptomic analysis was performed on quadriceps muscles from the study depicted in Figure 4A, as well as those from age-matched DBA/2J WT mice (n = 4). Analysis was performed on WT DBA-2J, vehicle-treated D2.mdx, vehicle-treated D2.mdx with dnMstn, and Pred-treated D2.mdx with dnMstn. (A) Venn diagram depicting number of genes differentially expressed by each D2.mdx treatment group analyzed. Most activated (blue) and inhibited (orange) pathways associated with myostatin inhibition (D2.mdx vehicle + dnMstn vs D2.mdx vehicle-only) identified using (B) REACTOME Pathway Knowledgebase and (C) WikiPathways databases. Pathways having false discover rate (FDR) P values ≤ 0.05 for either direction are indicated by darker coloration. (D) Clustered heatmap analysis of the 50 most-changed genes in D2.mdx vehicle+dnMstn vs. D2.mdx vehicle-only comparison. Gene expression levels were calculated using the DESeq method are displayed as log10 (normalized expression relative to D2.mdx vehicle-only values).
Figure 8
Figure 8. Transcriptomic analysis of most-changed genes by combining prednisolone with myostatin inhibition.
(A and B) Most activated (blue) and inhibited (orange) pathways associated with combining prednisolone (Pred) with myostatin inhibition (D2.mdx Pred + dnMstn vs. D2.mdx vehicle + dnMstn) identified using REACTOME Pathway Knowledgebase (A) and WikiPathways (B) databases. Pathways having FDR-adjusted P ≤ 0.05 for either direction are indicated by darker coloration. (C) Clustered heatmap analysis of the 50 most-changed genes in D2.mdx vehicle + dnMstn vs. D2.mdx vehicle-only comparison. Gene expression levels were calculated using the DESeq method are displayed as log10 (normalized expression relative to D2.mdx vehicle-only values).
Figure 9
Figure 9. Myostatin ablation does not prevent Pred-induced muscle atrophy.
Adult myostatin KO mice received daily oral treatments of vehicle or 5 mg/kg prednisolone (Pred) for 28 days (n = 4–5). (A) Mouse body weight change was evaluated during the course of the experiment. Data were analyzed using Welch’s t test (α = 0.05) and are displayed as mean ± SEM. (B–D) Body weight (B), absolute muscle masses (C), and tibia length–normalized muscle masses (D) were measured at terminal endpoint. WT and heterozygous (Het) littermate values are included for mass difference perspective. Data were analyzed using 1-way ANOVA (effect size reported as η2), followed by Tukey’s post hoc tests (α = 0.05). Data are presented as box-and-whisker plots, with minimum and maximum values indicated by error bars; data are shown as mean ± SEM. Groups that are significantly different from each other are indicated by nonoverlapping letter designations (P ≤ 0.05). (E–G) Immunofluorescent staining of vehicle- and Pred-treated KO gastrocnemius muscles for αActinin-3, a marker of fast-glycolytic muscle fibers, and laminin (E) allowed fiber size distribution analysis of αActinin-3+ (positive) fibers (F) and αActinin-3 (negative) fibers (G) of vehicle and Pred groups. Data were analyzed using Welch’s t test (α = 0.05) and are depicted as histograms of the entire data set. Scale bars: 100 μm.

References

    1. Hoffman EP, Brown RH, Kunkel LM. Dystrophin: the protein product of the Duchenne muscular dystrophy locus. Cell. 1987;51(6):919–928. doi: 10.1016/0092-8674(87)90579-4. - DOI - PubMed
    1. Petrof BJ, Shrager JB, Stedman HH, Kelly AM, Sweeney HL. Dystrophin protects the sarcolemma from stresses developed during muscle contraction. Proc Natl Acad Sci USA. 1993;90(8):3710–3714. doi: 10.1073/pnas.90.8.3710. - DOI - PMC - PubMed
    1. Welch EM, et al. PTC124 targets genetic disorders caused by nonsense mutations. Nature. 2007;447(7140):87–91. doi: 10.1038/nature05756. - DOI - PubMed
    1. Mendell JR, et al. Eteplirsen for the treatment of Duchenne muscular dystrophy. Ann Neurol. 2013;74(5):637–647. doi: 10.1002/ana.23982. - DOI - PubMed
    1. Mendell JR, et al. Gene therapy for muscular dystrophy: lessons learned and path forward. Neurosci Lett. 2012;527(2):90–99. doi: 10.1016/j.neulet.2012.04.078. - DOI - PMC - PubMed

Publication types