. 2019 Dec 12;12(1):192.
doi: 10.1186/s12920-019-0620-6.

Systematic computational identification of prognostic cytogenetic markers in neuroblastoma

Affiliations

Systematic computational identification of prognostic cytogenetic markers in neuroblastoma

Chao Qin et al. BMC Med Genomics. .

Abstract

Background: Neuroblastoma (NB) is the most common extracranial solid tumor found in children. The frequent gain/loss of many chromosome bands in tumor cells and absence of mutations found at diagnosis suggests that NB is a copy number-driven cancer. Despite the previous work, a systematic analysis that investigates the relationship between such frequent gain/loss of chromosome bands and patient prognosis has yet to be implemented.

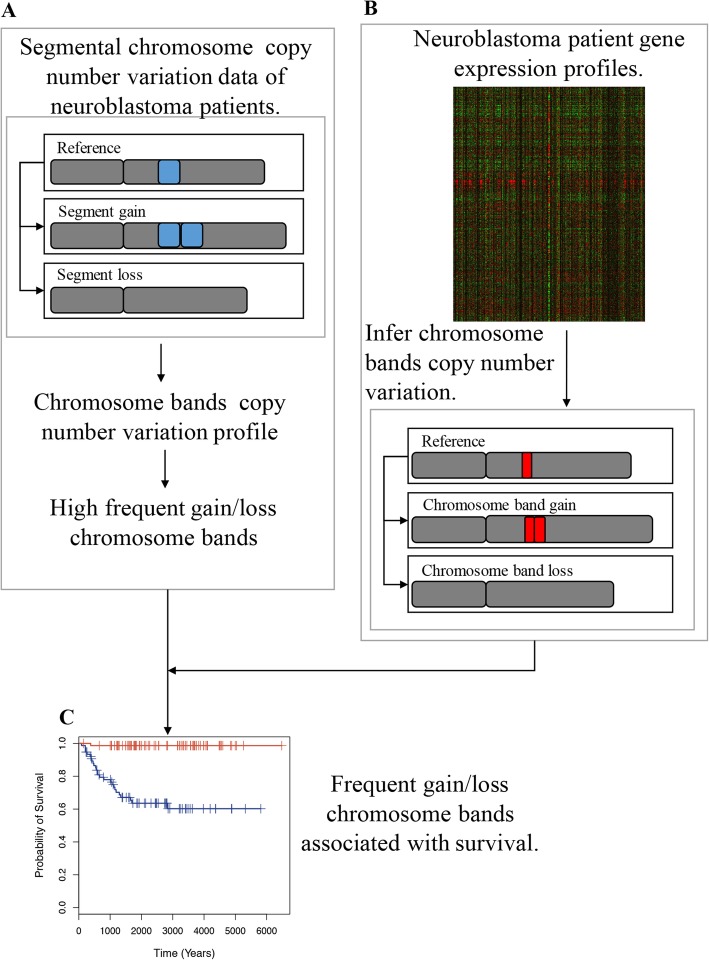
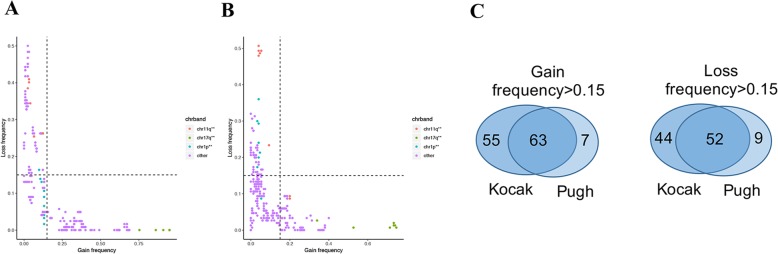
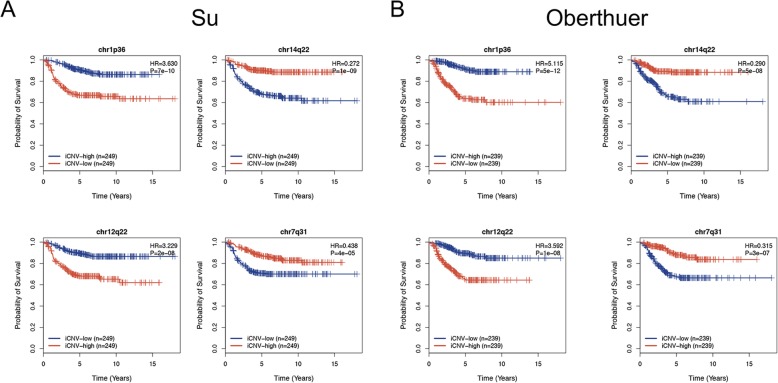
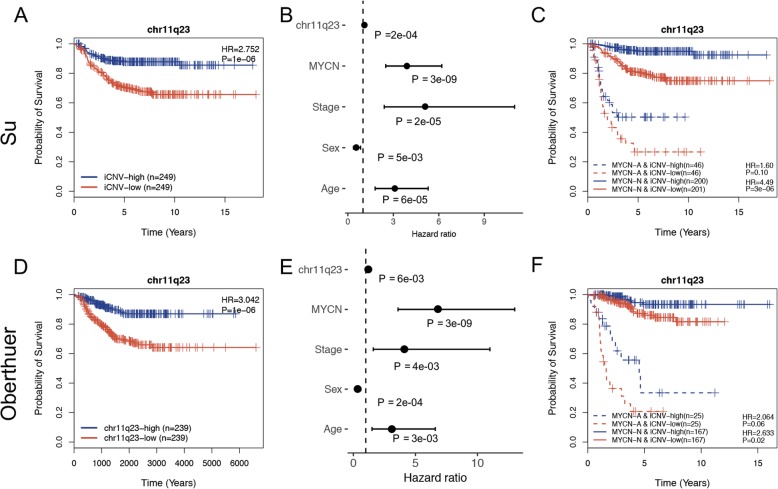
Methods: First, we analyzed two NB CNV datasets to select chromosomal bands with a high frequency of gain or loss. Second, we applied a computational approach to infer sample-specific CNVs for each chromosomal band selected in step 1 based on gene expression data. Third, we applied univariate Cox proportional hazards models to examine the association between the resulting inferred copy number values (iCNVs) and patient survival. Finally, we applied multivariate Cox proportional hazards models to select chromosomal bands that remained significantly associated with prognosis after adjusting for critical clinical variables, including age, stage, gender, and MYCN amplification status.

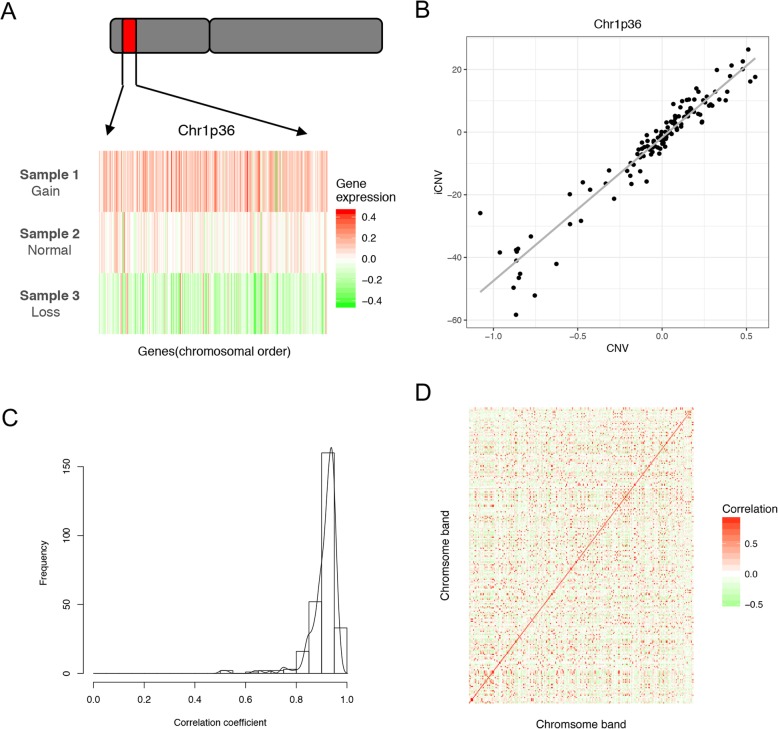
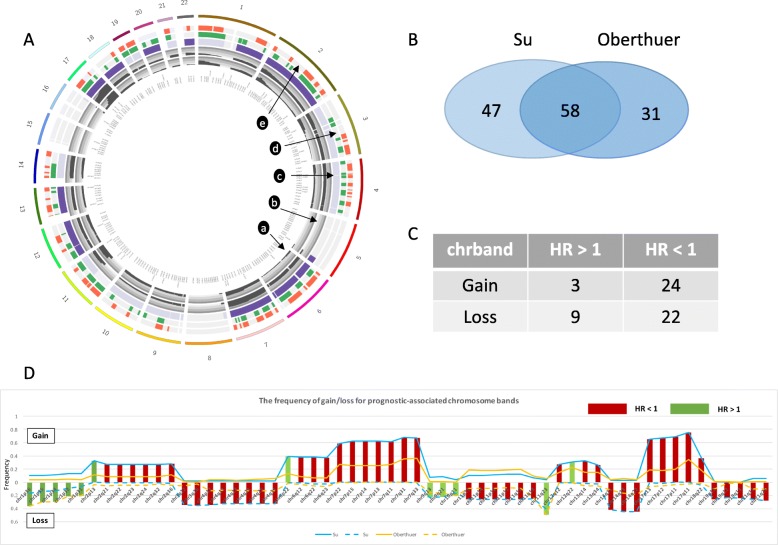
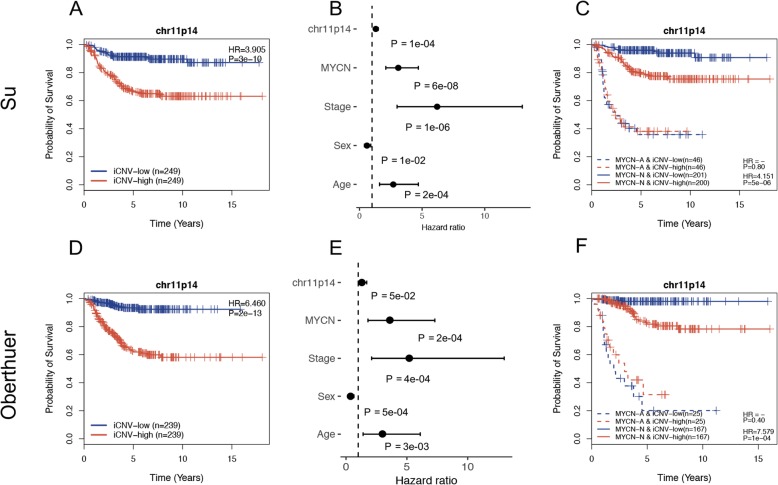
Results: Here, we used a computational method to infer the copy number variations (CNVs) of sample-specific chromosome bands from NB patient gene expression profiles. The resulting inferred CNVs (iCNVs) were highly correlated with the experimentally determined CNVs, demonstrating CNVs can be accurately inferred from gene expression profiles. Using this iCNV metric, we identified 58 frequent gain/loss chromosome bands that were significantly associated with patient survival. Furthermore, we found that 7 chromosome bands were still significantly associated with patient survival even when clinical factors, such as MYCN status, were considered. Particularly, we found that the chromosome band chr11p14 has high potential as a novel candidate cytogenetic biomarker for clinical use.

Conclusion: Our analysis resulted in a comprehensive list of prognostic chromosome bands supported by strong statistical evidence. In particular, the chr11p14 gain event provided additional prognostic value in addition to well-established clinical factors, including MYCN status, and thereby represents a novel candidate cytogenetic biomarker with high clinical potential. Additionally, this computational framework could be readily extended to other cancer types, such as leukemia.

Keywords: Chr11p14; Chr11q23; Cytogenetic marker; Neuroblastoma; Prognosis.


Conflict of interest statement

The authors declare that they have no competing interests.

Figures

Fig. 1
Fig. 1
Schematic diagram of our analysis. a The segmental chromosome copy number variation data of neuroblastoma patients was used to map to the chromosome band copy number variation, and the frequency of chromosome band gain/loss was obtained. We selected chromosome bands with a gain/loss frequency > 15% as the frequent gain/loss chromosome bands. b The neuroblastoma patient gene expression profiles were used to calculate the inferred copy number variation (iCNV) of each chromosome band. c A Cox proportional hazard model was used to measure the correlation between frequent gain/loss chromosome band iCNVs and patient survival time
Fig. 2
Fig. 2
Chromosome band gain/loss frequency in the Kocak and Pugh datasets. a The frequency of chromosome band gain/loss on the Kocak dataset, which contains all six stages of neuroblastoma patients. Chromosome bands on the right side of the vertical dashed line or above the horizontal dashed line are considered frequent gain/loss on the Kocak dataset. b The chromosome band gain/loss frequency in the Pugh dataset, which contained 1 Stage I patient and 149 Stage IV patients. Chromosome bands on the right side of the vertical dashed line or above the horizontal dashed line were considered to have frequent gain/loss in the Pugh dataset. c The number of frequent gain/loss chromosome bands in the Kocak and Pugh datasets. The association of these 223 chromosome bands with frequent gain/loss events with patient survival was studied
Fig. 3
Fig. 3
Correlation between chromosome band inferred copy number variation (iCNV) and copy number variation (CNV). a The gene expression profile of three patients with gain, normal, and loss of Chr1p36. Genes are sorted according to their position on the chromosome. b The correlation between iCNV and CNV of Chr1p36 for all samples. c A histogram for the correlation coefficient of chromosome bands across all samples. d The correlation matrix heatmap of the chromosome bands across all samples
Fig. 4
Fig. 4
Fifty-eight robust chromosome bands were associated with patient survival. a An overview of the 272 chromosome bands with frequency of gain/loss events and prognosis. Track a shows a histogram of the gain/loss frequency in the Pugh dataset. Track b shows a histogram of the gain/loss frequency in the Kocak dataset. Track c shows the gain/loss status for each chromosome band. Dark purple represents frequent gain. Light purple represents frequent loss. Gray represents nonfrequent gain/loss. Track d shows the association between chromosome aberration and prognosis in the Su dataset. Green presents the high frequency of gain/loss chromosome bands associated with prognosis. Gray presents non-association with prognosis. Track e shows the association between chromosome aberration and prognosis in the Oberthuer dataset. Red presents chromosome bands with high gain/loss frequency associated with prognosis. Gray presents non-association with prognosis. b The overlapping prognostic-associated chromosome bands in the Su and Oberthuer dataset. c The number of frequent gain/loss chromosome bands associated with good/bad outcome. d Detailed information on the 58 robust chromosome bands associated with patient survival
Fig. 5
Fig. 5
Prediction applications of the iCNV of chromosome bands in the Su and Oberthuer datasets. Loss of chr1p36 and gain of chr12q22 were associated with poor prognosis in both the Su (a) and Oberthuer (b) datasets. Loss of chr14q22 and gain of chr7q31 were associated with good prognosis in both the Su (a) and Oberthuer (b) datasets
Fig. 6
Fig. 6
iCNV of chr11q23 as a predictor of survival in Su and Oberthuer datasets. a, d Loss of chr11q23 was associated with poor outcome in the Su and Oberthuer datasets. b, e The iCNV of chr11q23 was significantly associated with poor prognosis after taking into account several confounding factors in the two datasets. c, f The iCNV of chr11q23 was still significant among MYCN nonamplification patients and predicted poor prognosis in the Su and Oberthuer datasets
Fig. 7
Fig. 7
Chr11p14 as a potential cytogenetic marker for predicting survival in the Su and Oberthuer datasets. a, d Gain of chr11q23 was associated with poor outcome in the two datasets. b, e The iCNV of chr11p14 was significantly associated with poor prognosis after taking into account several confounding factors in the two datasets. c, f The iCNV of chr11p14 was still significantly associated with poor prognosis among MYCN nonamplification patients in the two datasets

References

    1. Maris JM, Hogarty MD, Bagatell R, Cohn SL. Neuroblastoma. Lancet. 2007;369(9579):2106–2120. doi: 10.1016/S0140-6736(07)60983-0. - DOI - PubMed
    1. Brodeur GM. Neuroblastoma: biological insights into a clinical enigma. Nat Rev Cancer. 2003;3(3):203–216. doi: 10.1038/nrc1014. - DOI - PubMed
    1. Stiller CA, Parkin DM. International variations in the incidence of neuroblastoma. Int J Cancer. 1992;52(4):538–543. doi: 10.1002/ijc.2910520407. - DOI - PubMed
    1. London WB, Castleberry RP, Matthay KK, et al. Evidence for an age cutoff greater than 365 days for neuroblastoma risk group stratification in the children’s oncology group. J Clin Oncol. 2005;23(27):6459–6465. doi: 10.1200/JCO.2005.05.571. - DOI - PubMed
    1. Brodeur GM, Pritchard J, Berthold F, et al. Revisions of the international criteria for neuroblastoma diagnosis, staging, and response to treatment. J Clin Oncol. 1993;11(8):1466–1477. doi: 10.1200/JCO.1993.11.8.1466. - DOI - PubMed

Publication types

Substances