. 2019 Dec 12;12(1):73.
doi: 10.1186/s13072-019-0320-7.

Maintenance of active chromatin states by HMGN2 is required for stem cell identity in a pluripotent stem cell model

Affiliations

Maintenance of active chromatin states by HMGN2 is required for stem cell identity in a pluripotent stem cell model

Sylvia Garza-Manero et al. Epigenetics Chromatin. .

Abstract

Background: Members of the HMGN protein family modulate chromatin structure and influence epigenetic modifications. HMGN1 and HMGN2 are highly expressed during early development and in the neural stem/progenitor cells of the developing and adult brain. Here, we investigate whether HMGN proteins contribute to the chromatin plasticity and epigenetic regulation that is essential for maintaining pluripotency in stem cells.

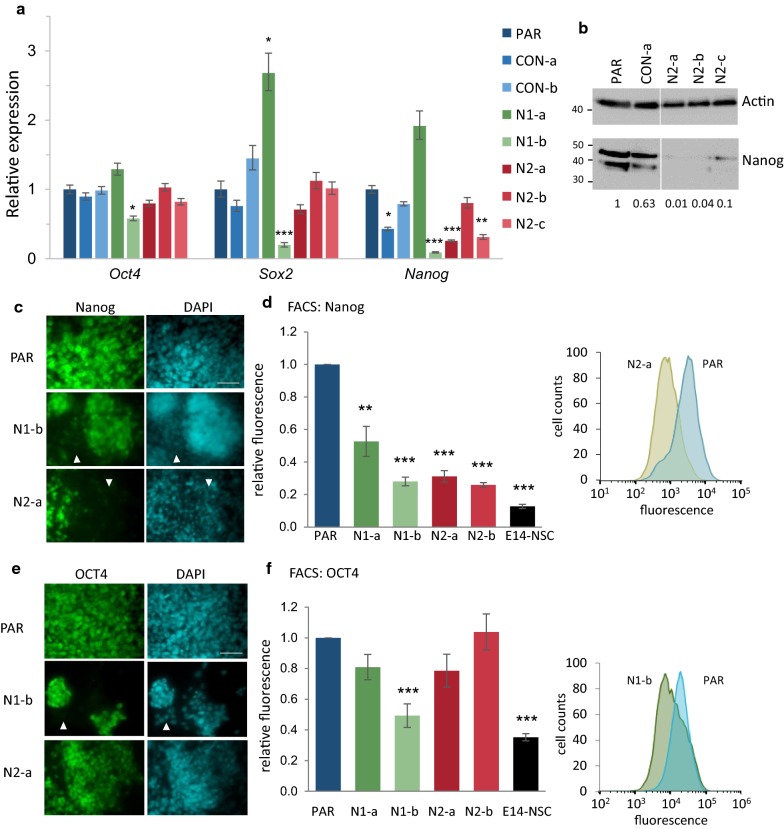
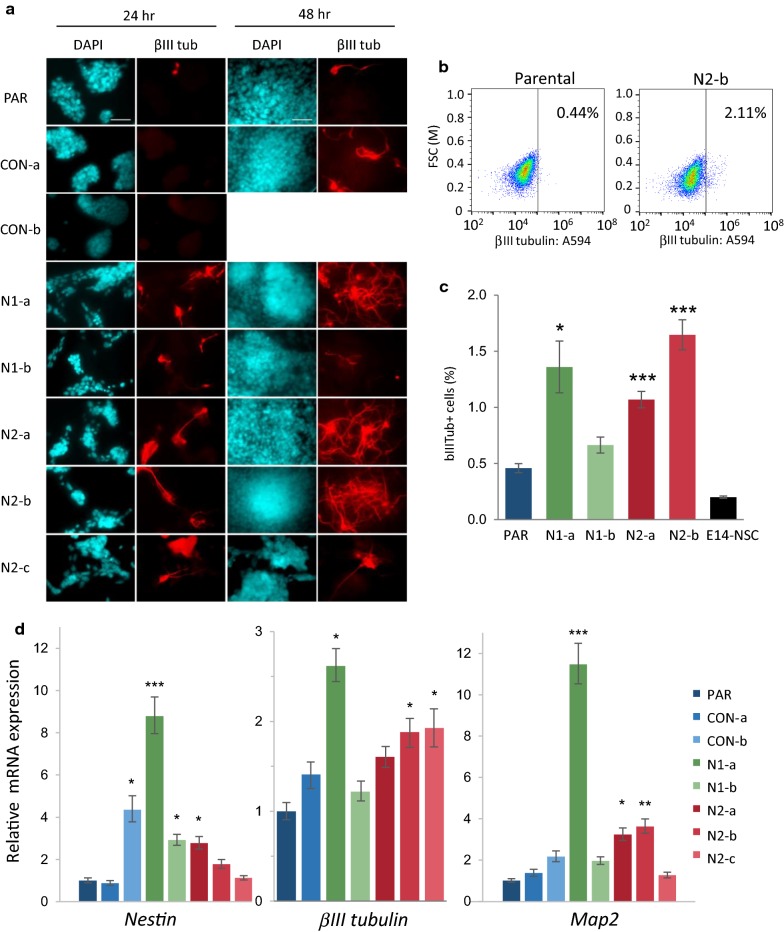
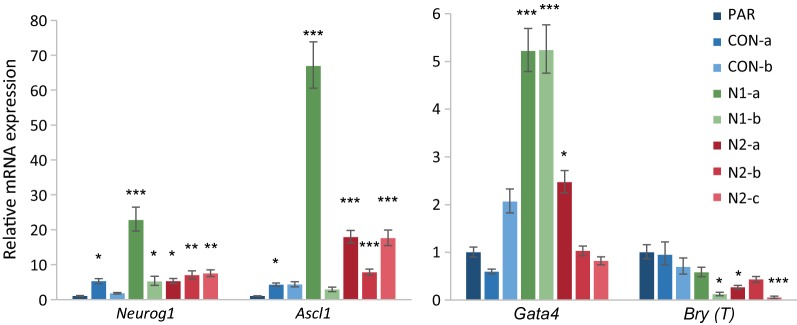
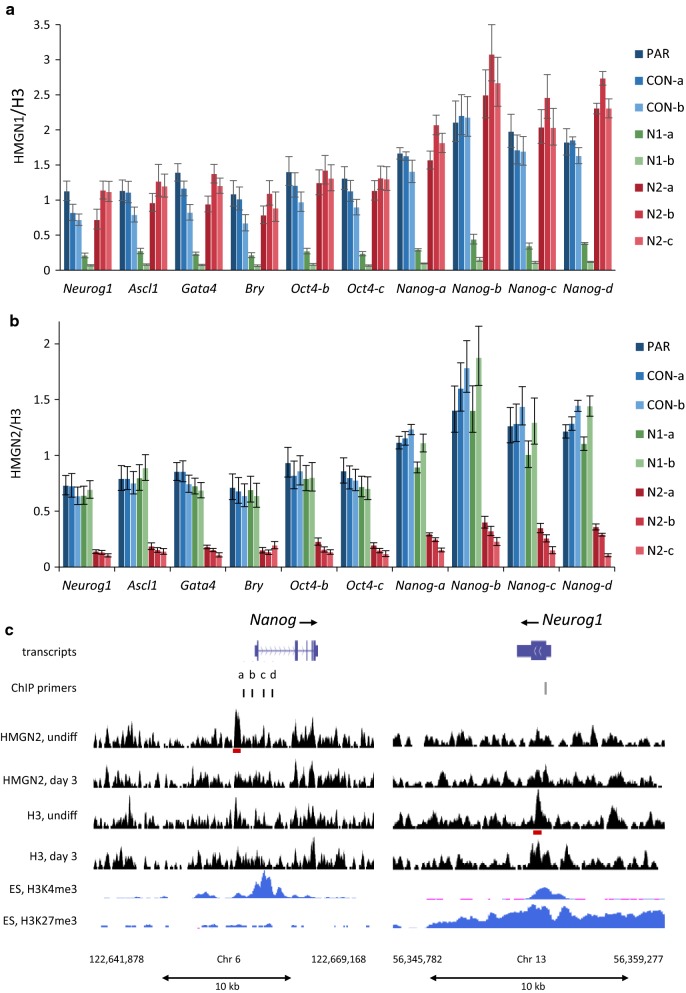
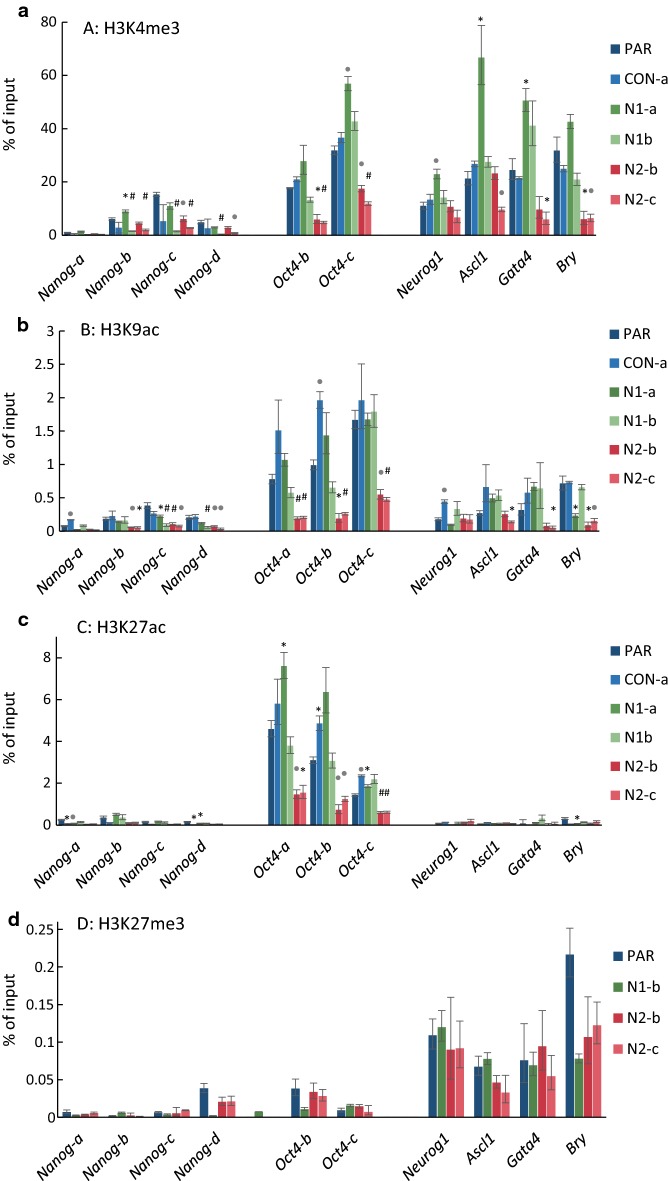
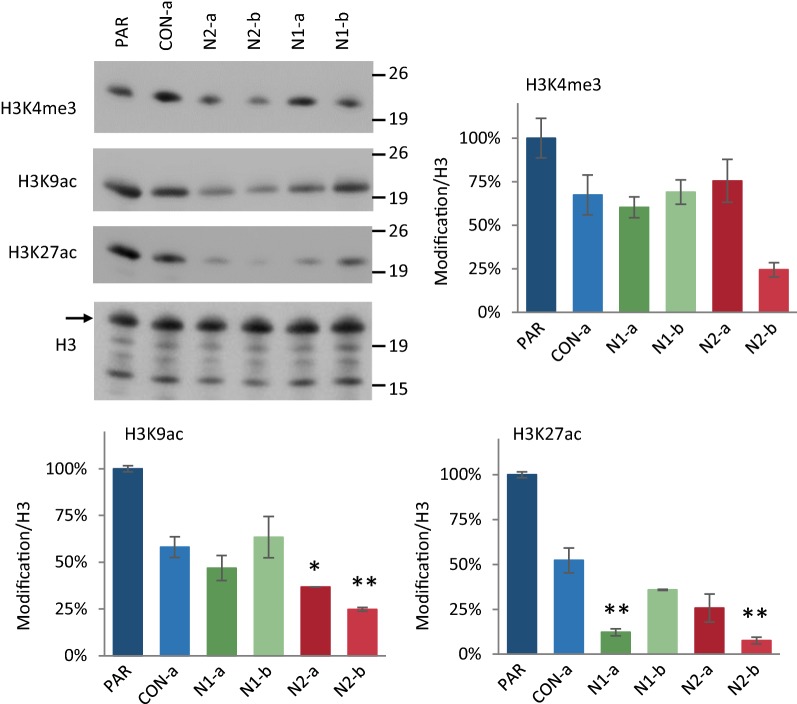
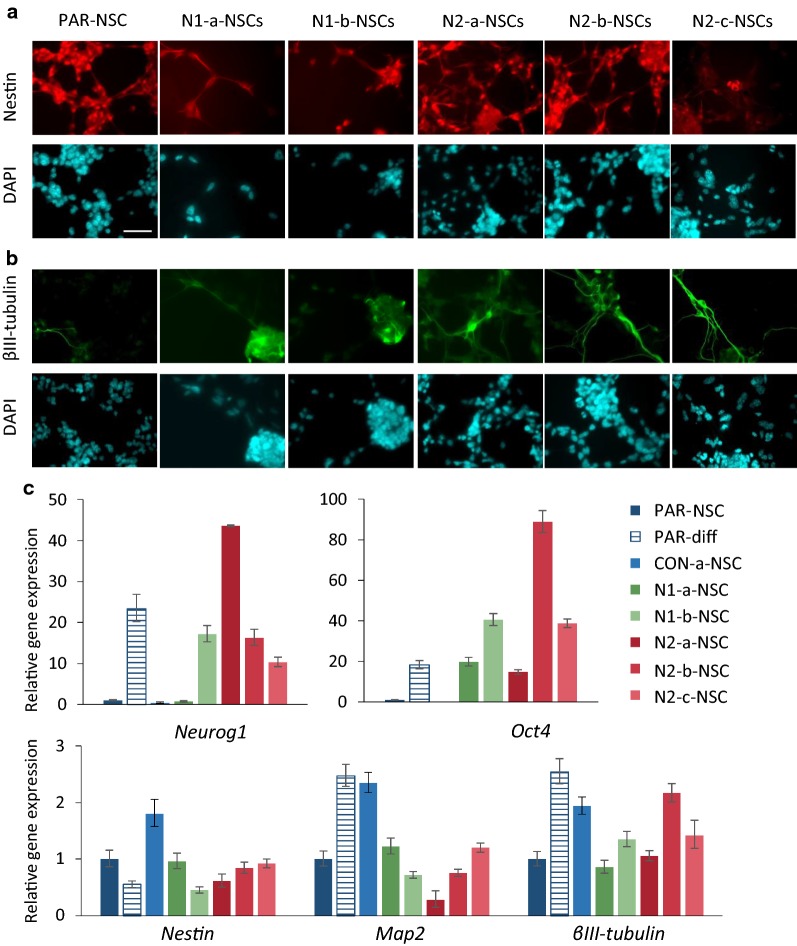
Results: We show that loss of Hmgn1 or Hmgn2 in pluripotent embryonal carcinoma cells leads to increased levels of spontaneous neuronal differentiation. This is accompanied by the loss of pluripotency markers Nanog and Ssea1, and increased expression of the pro-neural transcription factors Neurog1 and Ascl1. Neural stem cells derived from these Hmgn-knockout lines also show increased spontaneous neuronal differentiation and Neurog1 expression. The loss of HMGN2 leads to a global reduction in H3K9 acetylation, and disrupts the profile of H3K4me3, H3K9ac, H3K27ac and H3K122ac at the Nanog and Oct4 loci. At endodermal/mesodermal genes, Hmgn2-knockout cells show a switch from a bivalent to a repressive chromatin configuration. However, at neuronal lineage genes whose expression is increased, no epigenetic changes are observed and their bivalent states are retained following the loss of HMGN2.

Conclusions: We conclude that HMGN1 and HMGN2 maintain the identity of pluripotent embryonal carcinoma cells by optimising the pluripotency transcription factor network and protecting the cells from precocious differentiation. Our evidence suggests that HMGN2 regulates active and bivalent genes by promoting an epigenetic landscape of active histone modifications at promoters and enhancers.

Keywords: Chromatin; Differentiation; Embryonal carcinoma cells; Epigenetics; HMGN; Neuronal; Stem cells.


Conflict of interest statement

The authors declare that they have no competing interests.

Figures

Fig. 1
Fig. 1
Generation of Hmgn1 and Hmgn2 knockout P19 lines. Western blot analysis of a HMGN1 and b HMGN2 protein levels in clonal P19 lines; β-tubulin is shown as a loading control. c Hmgn1 and Hmgn2 mRNA expression as determined by qRT-PCR in control and Hmgn-knockout cells. The graph represents the average fold change relative to parental P19 cells (n = 3–10) (***p < 0.0001)
Fig. 2
Fig. 2
Expression of pluripotency markers in Hmgn knockout cells. a Relative expression of the pluripotency transcription factors Oct4, Sox2, and Nanog as determined by qRT-PCR. The graphs show the fold change relative to parental P19 cells (n = 3–10) (*p < 0.05, **p < 0.01, ***p < 0.001). b Western blot analysis of Nanog protein levels in whole cell extracts from parental P19, CON-a, N2-a, N2-b and N2-c cells. For both Actin and Nanog, all samples were run on the same gel and exposed at the same time. Actin is shown as a loading control. The relative ratios of Nanog to Actin, averaged from two replicate blots, are shown below. Immunofluorescence analysis of Nanog (c) and OCT4 (e) expression. Parental, N1-a and N2-a cells were fixed 24 h after seeding. DAPI was used to stain the nuclei (cyan). Scale bar indicates 50 µm. Nanog levels are heterogeneous, and cells with reduced expression are indicated by arrow heads. Images from all lines are shown in Additional file 1: Figure S4. FACS analysis of Nanog (d) and OCT4 (f) expression. E14-NSCs are the negative control. The bar graphs represent the relative fluorescence intensity (median) of each cell line, n = 3 (*p < 0.05, **p < 0.001, ***p < 0.0001). The cell count plots are representative examples to illustrate the distribution of the data for parental and knockout cells
Fig. 3
Fig. 3
Hmgn knockout cells show increased levels of spontaneous neuronal differentiation. a Immunofluorescence analysis of the neurofilament protein βIII-tubulin (red). Control and Hmgn-knockout cells were fixed 24 h and 48 h after seeding. CON-b cells adhere weakly to slides after 48 h, so no immunofluorescence data are available for this time point. DAPI was used to stain the nuclei (cyan). Scale bar indicates 50 µm. FACS analysis of βIII tubulin expression. b Example dot plots show the distribution of 10,000 cells and the gate that delineates βIII tubulin-positive cells. The percentage of βIII tubulin-positive cells is shown. c Percentage of βIII tubulin-positive cells in each cell line, as determined by FACS (n = 3) (*p < 0.05, **p < 0.001, ***p < 0.0001). E14-NSCs are a negative control. d Relative mRNA expression of the neural-specific markers Nestin, βIII-tubulin and Map2 (no data available for βIII tubulin expression in CON-b cells). The graphs show the fold change relative to parental cells (n = 3–10) (*p < 0.05, **p < 0.01, ***p < 0.001)
Fig. 4
Fig. 4
Hmgn knockout cells have increased expression of pro-neural transcription factors. Relative mRNA expression of the proneural lineage-specific transcription factors Neurog1 and Ascl1, and the endodermal/mesodermal markers Gata4 and Bry (T). The graphs show the fold change relative to parental cells (n = 3–10) (*p < 0.05, **p < 0.01, ***p < 0.001)
Fig. 5
Fig. 5
HMGN1 and HMGN2 are not highly enriched at active gene promoters. ChIP-PCR assays in control and knockout cell lines. Enrichment of HMGN1 (a) or HMGN2 (b) at each primer set was normalised to the average H3 signal from all primer sets. The graphs present the mean and sd of technical qPCR triplicates from the same IP reaction. Data are representative of 2–3 independent biological replicates. c ChIP-seq for HMGN2 and H3 was performed in undifferentiated and day 3 neuronal induced P19 cells. Reads were aligned to the mm9 mouse genome and regions surrounding the Nanog and Neurog1 loci are shown. Peaks revealed by MACS peak calling software for HMGN2 and H3 are shown as red blocks below the relevant signal track. Positions of the primer sets used for ChIP are indicated. Data for H3K4me3 and H3K27me3 in mouse ES Bruce4 cells was obtained from the UCSC genome browser (http://genome.ucsc.edu; accessions wgEncodeEM001682 and wgEncodeEM002709) [50, 51]. Y-axis maxima are 0.62 for all H3 and HMGN2 tracks, 21 for H3K4me3 and 3.5 for H3K27me3. Similar data for the regions surrounding the Oct4 and Ascl1 loci are shown in Additional file 1: Figure S9
Fig. 6
Fig. 6
Hmgn2-knockout cells show a reduction in active histone H3 modifications at bivalent and active gene loci. ChIP-PCR assays in control and knockout cell lines for H3K4me3 (a), H3K9ac (b), H3K27ac (c) and H3K27me3 (d). Data show the enrichment of each modification as a percentage of input. Statistical significance between parental and experimental lines was determined using the Student’s T test, with Bonferroni correction for multiple testing (*p < 0.005, .p < 0.001, #p < 0.0001). Data for H3K122ac, H3 and H1 are shown in Additional file 1: Figure S11
Fig. 7
Fig. 7
Global reduction of histone acetylation in Hmgn-knockout cells. Western blotting for the detection of H3K4me3, H3K9ac and H3K27ac. Acid histone extracts were prepared in duplicate from two different cell passages of each cell line and separated by SDS-PAGE. Western blotting for each histone modification and sample set was performed twice or three times. Representative images are displayed (left). The H3 protein is indicated by an arrow, and additional bands on this blot are the results of non-specific antibody interactions. The intensity for each modification was normalised to that of H3, and the average and s.e.m. is plotted relative to that in parental cells (*p < 0.05, **p < 0.01)
Fig. 8
Fig. 8
Neural stem cells derived from cells lacking Hmgn1 or Hmgn2 show loss of NSC identity. Immunostaining for a nestin and b βIII tubulin in NSCs derived from parental P19 cells, Hmgn1 and Hmgn2 knockout lines. Scale bar indicates 50 µm. c Relative mRNA expression in NSCs derived from parental P19 cells, CON-a cells, and Hmgn1 and Hmgn2 knockout lines. Expression in parental NSCs that were induced to differentiate down the neuronal lineage by removal of growth factors is also shown. Expression is normalised to that of Gpi1, and is plotted relative to that in parental NSCs. Error bars represent the sd from technical qRT-PCR triplicates. Data are representative of two independent NSC derivation experiments

References

    1. Mattout A, Meshorer E. Chromatin plasticity and genome organization in pluripotent embryonic stem cells. Curr Opin Cell Biol. 2010;22(3):334–341. doi: 10.1016/j.ceb.2010.02.001. - DOI - PubMed
    1. Bernstein BE, Mikkelsen TS, Xie X, Kamal M, Huebert DJ, Cuff J, et al. A bivalent chromatin structure marks key developmental genes in embryonic stem cells. Cell. 2006;125(2):315–326. doi: 10.1016/j.cell.2006.02.041. - DOI - PubMed
    1. Deng T, Zhu ZI, Zhang S, Leng F, Cherukuri S, Hansen L, et al. HMGN1 modulates nucleosome occupancy and DNase I hypersensitivity at the CpG island promoters of embryonic stem cells. Mol Cell Biol. 2013;33(16):3377–3389. doi: 10.1128/MCB.00435-13. - DOI - PMC - PubMed
    1. Meshorer E, Yellajoshula D, George E, Scambler PJ, Brown DT, Misteli T. Hyperdynamic plasticity of chromatin proteins in pluripotent embryonic stem cells. Dev Cell. 2006;10(1):105–116. doi: 10.1016/j.devcel.2005.10.017. - DOI - PMC - PubMed
    1. Kugler JE, Deng T, Bustin M. The HMGN family of chromatin-binding proteins: dynamic modulators of epigenetic processes. Biochimica et Biophysica Acta (BBA). 2012;1819(7):652–656. doi: 10.1016/j.bbagrm.2012.01.013. - DOI - PMC - PubMed

Publication types

MeSH terms