

Localized Dielectric Loss Heating in Dielectrophoresis Devices
- PMID: 31831755
- PMCID: PMC6908616
- DOI: 10.1038/s41598-019-55031-y
Localized Dielectric Loss Heating in Dielectrophoresis Devices
Abstract
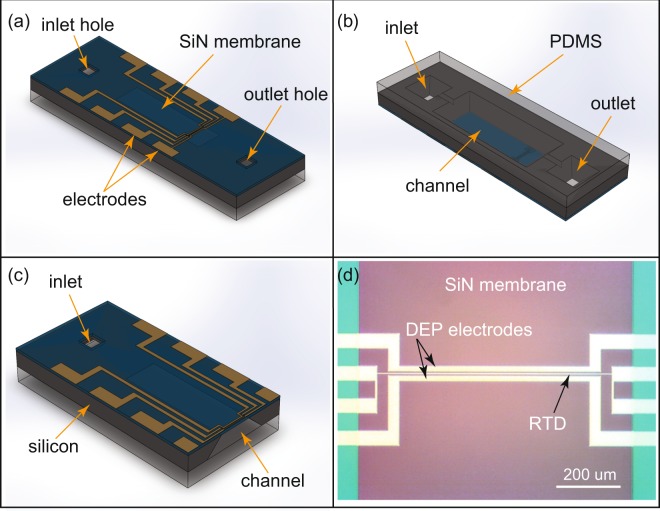
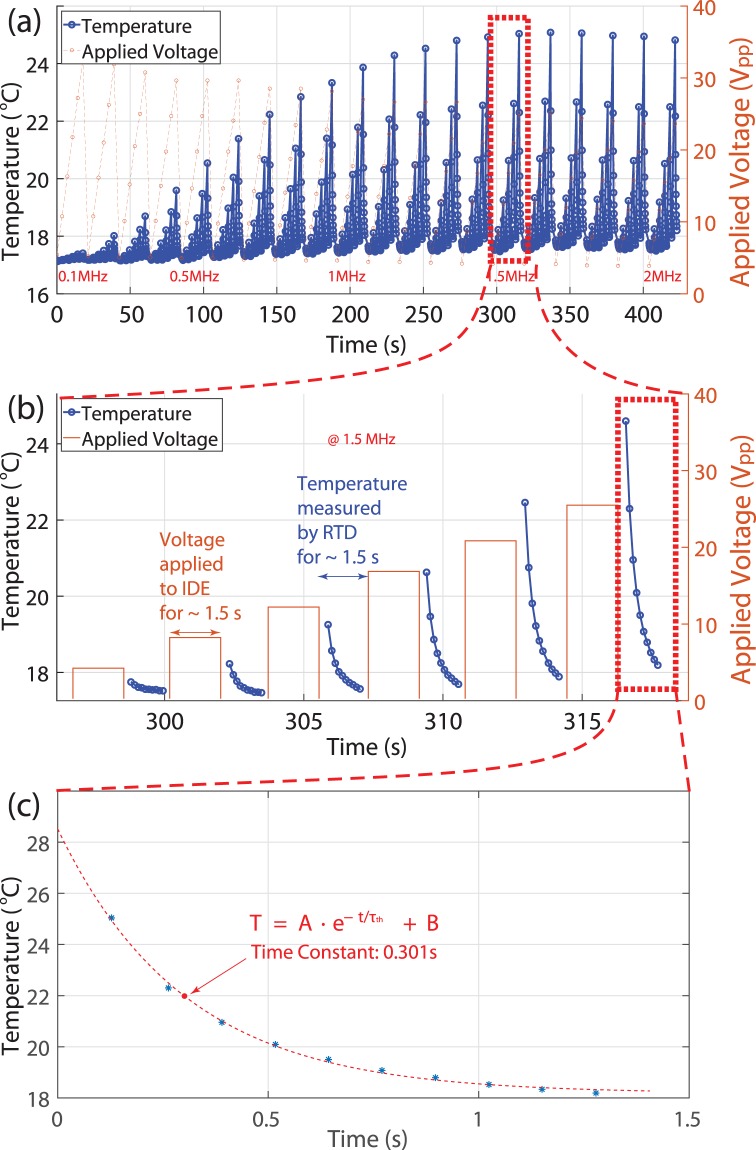
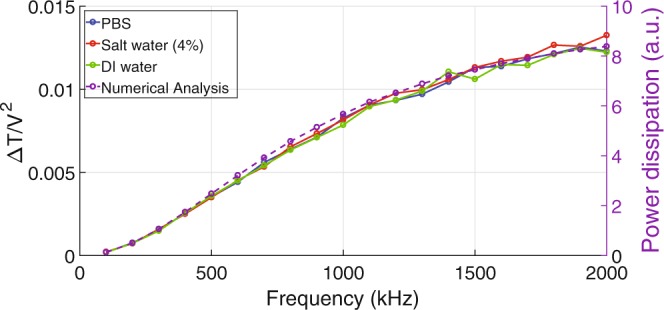
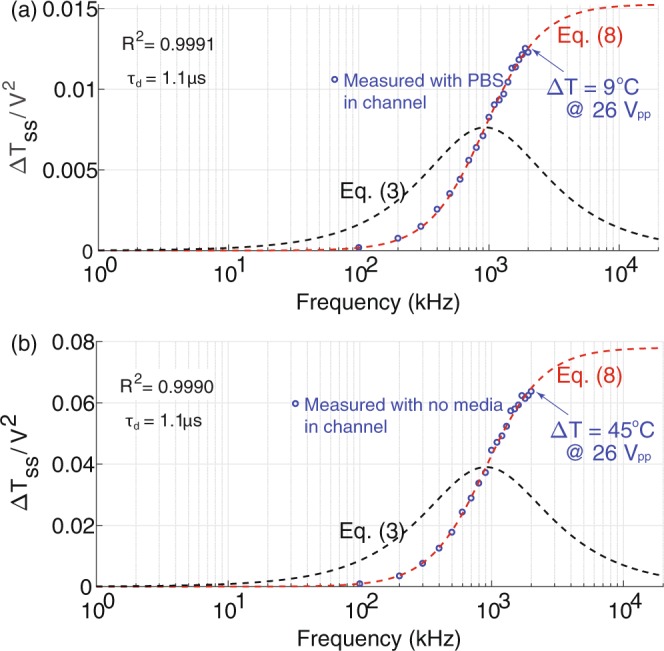
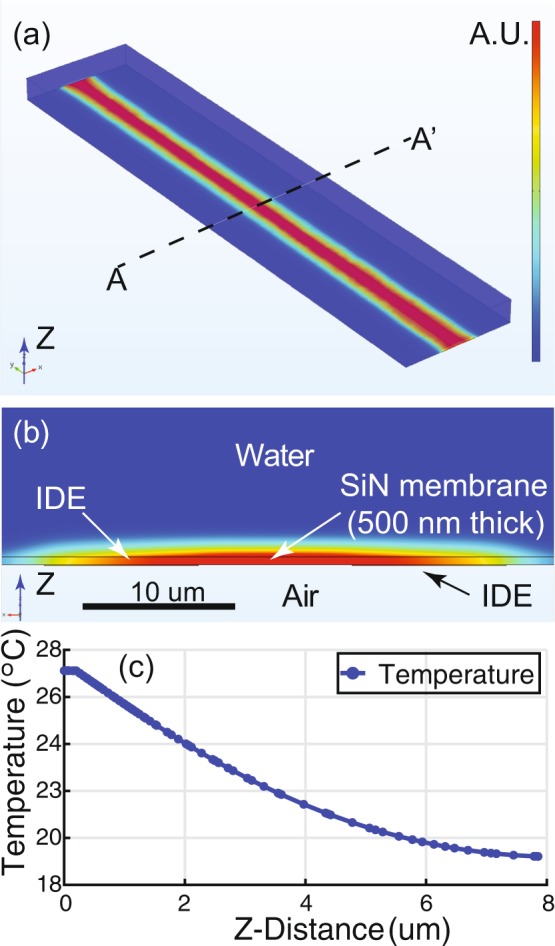
Temperature increases during dielectrophoresis (DEP) can affect the response of biological entities, and ignoring the effect can result in misleading analysis. The heating mechanism of a DEP device is typically considered to be the result of Joule heating and is overlooked without an appropriate analysis. Our experiment and analysis indicate that the heating mechanism is due to the dielectric loss (Debye relaxation). A temperature increase between interdigitated electrodes (IDEs) has been measured with an integrated micro temperature sensor between IDEs to be as high as 70 °C at 1.5 MHz with a 30 Vpp applied voltage to our ultra-low thermal mass DEP device. Analytical and numerical analysis of the power dissipation due to the dielectric loss are in good agreement with the experiment data.
Conflict of interest statement
The authors declare no competing interests.
Figures
Similar articles
-
Numerical Study of Joule Heating Effects on Microfluidics Device Reliability in Electrode Based Devices.Materials (Basel). 2021 Oct 5;14(19):5819. doi: 10.3390/ma14195819. Materials (Basel). 2021. PMID: 34640216 Free PMC article.
-
Rational Design and Numerical Analysis of a Hybrid Floating cIDE Separator for Continuous Dielectrophoretic Separation of Microparticles at High Throughput.Micromachines (Basel). 2022 Apr 8;13(4):582. doi: 10.3390/mi13040582. Micromachines (Basel). 2022. PMID: 35457887 Free PMC article.
-
Joule heating effects in optimized insulator-based dielectrophoretic devices: An interplay between post geometry and temperature rise.Electrophoresis. 2019 May;40(10):1408-1416. doi: 10.1002/elps.201800490. Epub 2019 Mar 27. Electrophoresis. 2019. PMID: 30883810
-
DEP-on-a-Chip: Dielectrophoresis Applied to Microfluidic Platforms.Micromachines (Basel). 2019 Jun 24;10(6):423. doi: 10.3390/mi10060423. Micromachines (Basel). 2019. PMID: 31238556 Free PMC article. Review.
-
Electric field-induced effects on neuronal cell biology accompanying dielectrophoretic trapping.Adv Anat Embryol Cell Biol. 2003;173:III-IX, 1-77. doi: 10.1007/978-3-642-55469-8. Adv Anat Embryol Cell Biol. 2003. PMID: 12901336 Review.
Cited by
-
Electromagnetic Forces and Torques: From Dielectrophoresis to Optical Tweezers.Chem Rev. 2023 Jan 31;123(4):1680-711. doi: 10.1021/acs.chemrev.2c00576. Online ahead of print. Chem Rev. 2023. PMID: 36719985 Free PMC article. Review.
-
Theoretical and experimental analysis of negative dielectrophoresis-induced particle trajectories.Electrophoresis. 2022 Jun;43(12):1366-1377. doi: 10.1002/elps.202100372. Epub 2022 May 15. Electrophoresis. 2022. PMID: 35377504 Free PMC article.
-
Comb-Tipped Coupled Cantilever Sensor for Enhanced Real-Time Detection of E. coli Bacteria.Sensors (Basel). 2025 Jul 3;25(13):4145. doi: 10.3390/s25134145. Sensors (Basel). 2025. PMID: 40648400 Free PMC article.
-
Efficient electroporation in primary cells with PEDOT:PSS electrodes.Sci Adv. 2024 Oct 25;10(43):eado5042. doi: 10.1126/sciadv.ado5042. Epub 2024 Oct 25. Sci Adv. 2024. PMID: 39454003 Free PMC article.
-
Dynamically controlled dielectrophoresis using resonant tuning.Electrophoresis. 2021 May;42(9-10):1079-1092. doi: 10.1002/elps.202000328. Epub 2021 Mar 9. Electrophoresis. 2021. PMID: 33599974 Free PMC article.
References
-
- Van Rijn J, Van den Berg J, Souren J, Van Wijk R, Joenje H. Hepatoma cells adapted to proliferate under normally lethal hyperthermic stress conditions show rapid decay of thermoresistance and heat shock protein synthesis when returned to 37 c. Int. journal hyperthermia. 1995;11:697–708. doi: 10.3109/02656739509022501. - DOI - PubMed
Publication types
LinkOut - more resources
Full Text Sources
Miscellaneous
