

Ionic direct current modulation evokes spike-rate adaptation in the vestibular periphery
- PMID: 31831760
- PMCID: PMC6908704
- DOI: 10.1038/s41598-019-55045-6
Ionic direct current modulation evokes spike-rate adaptation in the vestibular periphery
Abstract
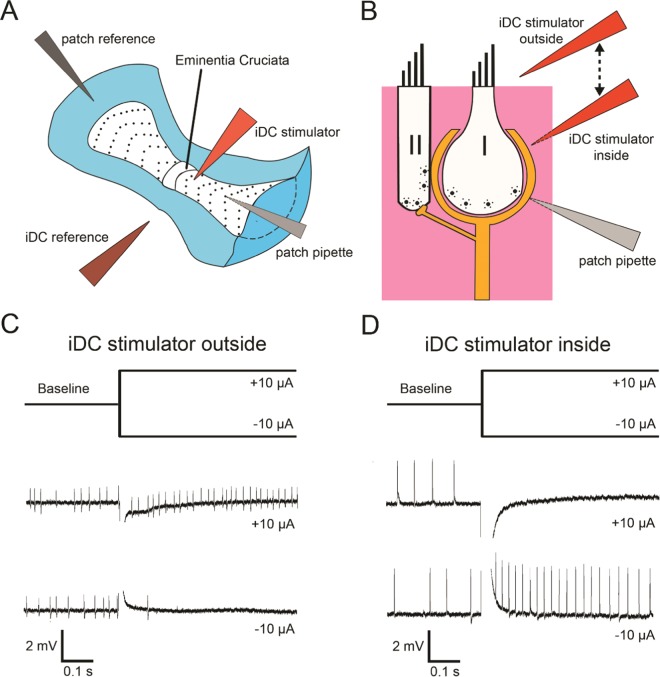
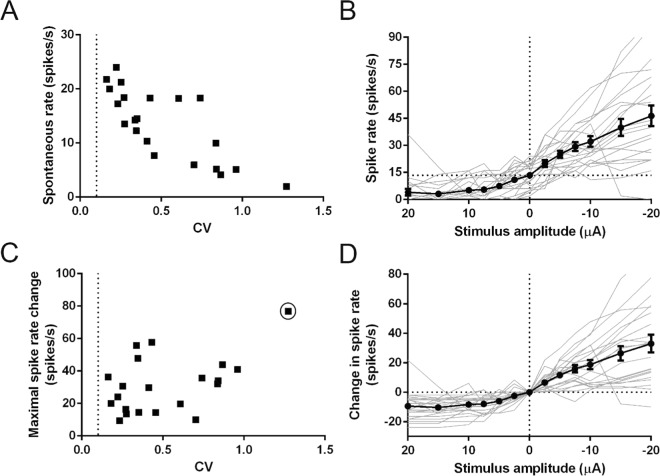
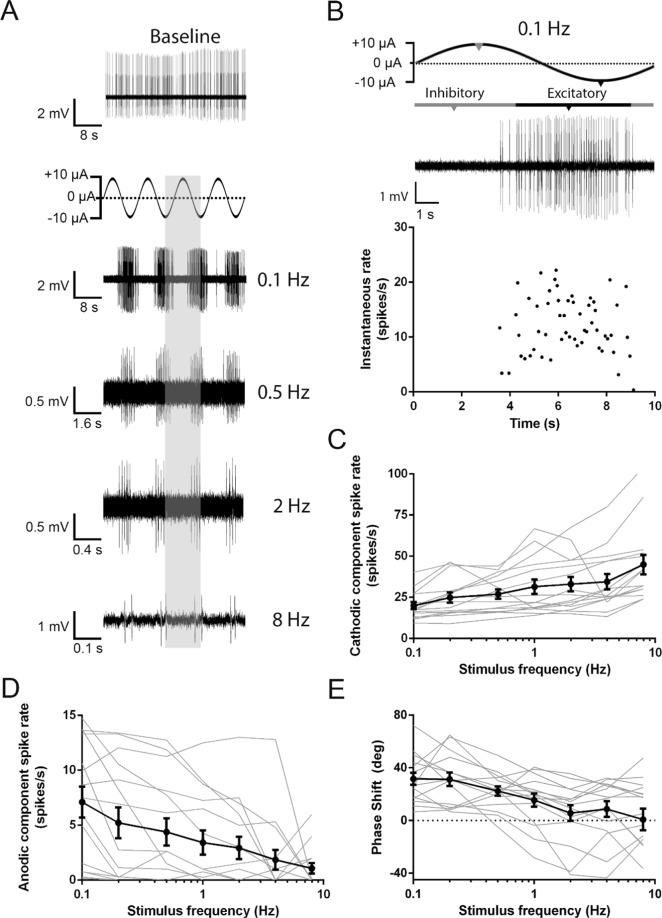
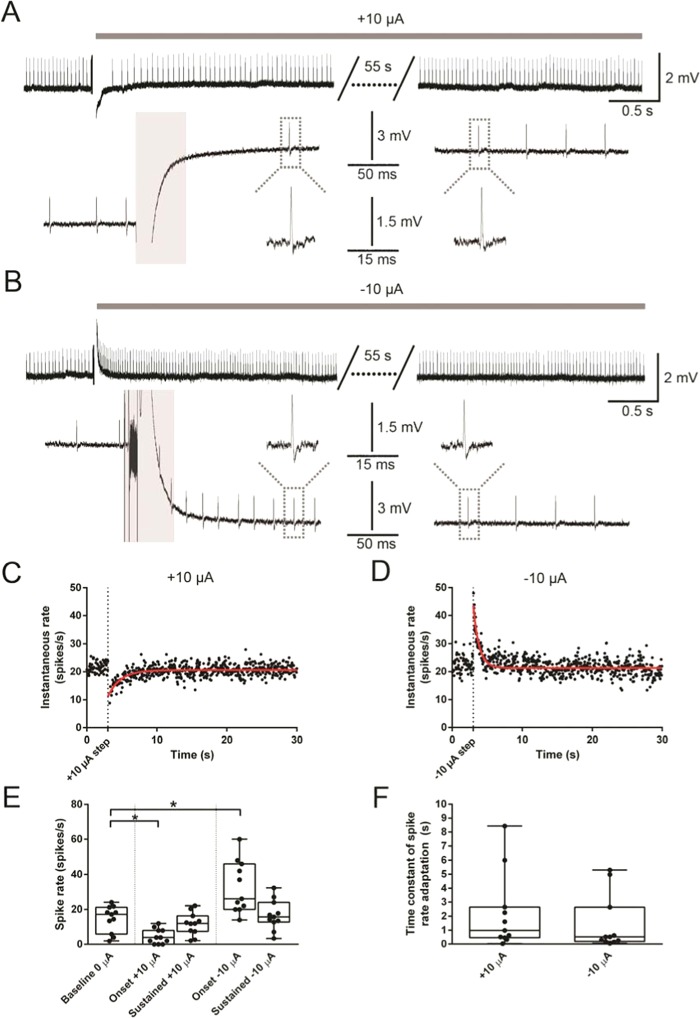
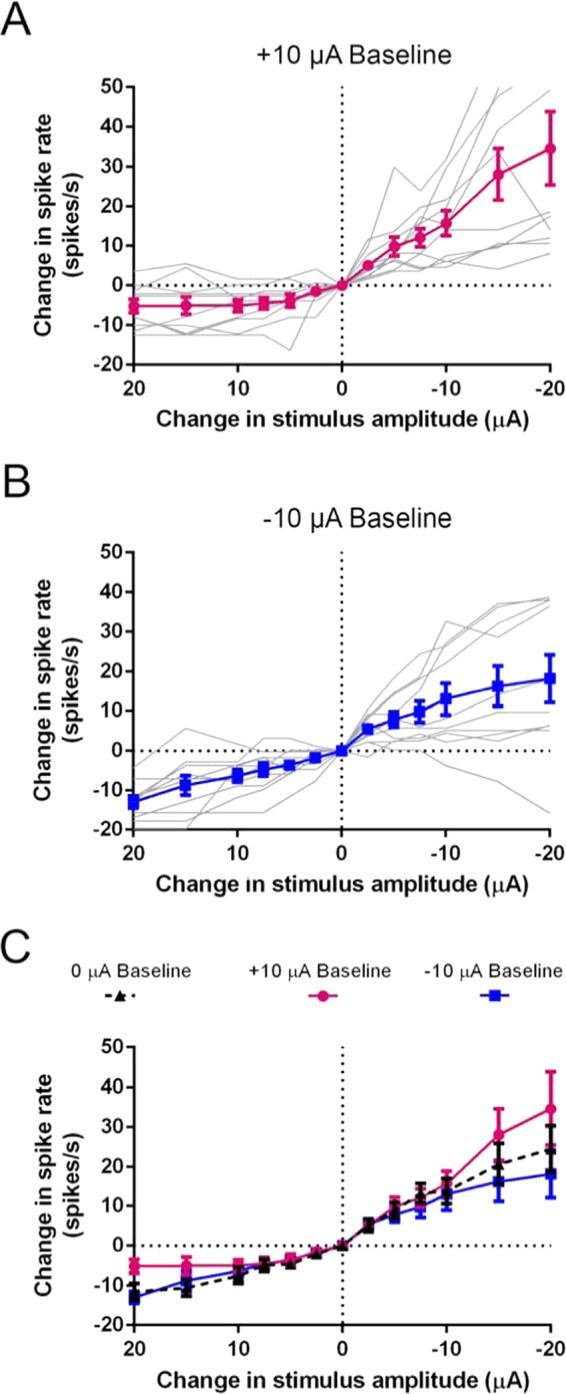
Recent studies have shown that ionic direct current (iDC) can modulate the vestibular system in-vivo, with potential benefits over conventional pulsed stimulation. In this study, the effects of iDC stimulation on vestibular nerve fiber firing rate was investigated using loose-patch nerve fiber recordings in the acutely excised mouse crista ampullaris of the semicircular canals. Cathodic and anodic iDC steps instantaneously reduced and increased afferent spike rate, with the polarity of this effect dependent on the position of the stimulating electrode. A sustained constant anodic or cathodic current resulted in an adaptation to the stimulus and a return to spontaneous spike rate. Post-adaptation spike rate responses to iDC steps were similar to pre-adaptation controls. At high intensities spike rate response sensitivities were modified by the presence of an adaptation step. Benefits previously observed in behavioral responses to iDC steps delivered after sustained current may be due to post-adaptation changes in afferent sensitivity. These results contribute to an understanding of peripheral spike rate relationships for iDC vestibular stimulation and validate an ex-vivo model for future investigation of cellular mechanisms. In conjunction with previous in-vivo studies, these data help to characterize iDC stimulation as a potential therapy to restore vestibular function after bilateral vestibulopathy.
Conflict of interest statement
Dr. Fridman is an inventor on the following patents associated with the Safe Direct Current Stimulation technology: Fridman, G, Safe Direct Current Stimulator Design for Reduced Power and Increased Reliability, JHU PCT/US2018/041246, 62/529,611 (pending) Fridman, G, Chiang, B, Della Santina CC, Implantable Vestibular Prosthesis and Methods for Sensing Head Motion and Conveying the Signals Representing Head Movements to the Vestibular Nerve., JHU US Pat. US20120277835 A1, 2012 (awarded) Fridman, G, Della Santina CC, Artifact Control and Miniaturization of the Safe DC Stimulator for Neural Prostheses, JHU 9,572,979 (awarded)
Figures
Similar articles
-
Combined ionic direct current and pulse frequency modulation improves the dynamic range of vestibular canal stimulation.J Vestib Res. 2019;29(2-3):89-96. doi: 10.3233/VES-190651. J Vestib Res. 2019. PMID: 30856136 Free PMC article.
-
Ionic Direct Current Modulation for Combined Inhibition/Excitation of the Vestibular System.IEEE Trans Biomed Eng. 2019 Mar;66(3):775-783. doi: 10.1109/TBME.2018.2856698. Epub 2018 Jul 16. IEEE Trans Biomed Eng. 2019. PMID: 30010547 Free PMC article.
-
Physiology of peripheral neurons innervating semicircular canals of the squirrel monkey. II. Response to sinusoidal stimulation and dynamics of peripheral vestibular system.J Neurophysiol. 1971 Jul;34(4):661-75. doi: 10.1152/jn.1971.34.4.661. J Neurophysiol. 1971. PMID: 5000363 No abstract available.
-
Optimal firing rate estimation.Neural Netw. 2001 Jul-Sep;14(6-7):877-81. doi: 10.1016/s0893-6080(01)00058-2. Neural Netw. 2001. PMID: 11665778 Review.
-
Galvanic vestibular stimulation: from basic concepts to clinical applications.J Neurophysiol. 2019 Jun 1;121(6):2237-2255. doi: 10.1152/jn.00035.2019. Epub 2019 Apr 17. J Neurophysiol. 2019. PMID: 30995162 Review.
Cited by
-
A microfluidic system integrated with shape memory alloy valves for a safe direct current delivery system.Annu Int Conf IEEE Eng Med Biol Soc. 2020 Jul;2020:3544-3548. doi: 10.1109/EMBC44109.2020.9176474. Annu Int Conf IEEE Eng Med Biol Soc. 2020. PMID: 33018768 Free PMC article.
-
Direct current effects on afferent and hair cell to elicit natural firing patterns.iScience. 2021 Feb 20;24(3):102205. doi: 10.1016/j.isci.2021.102205. eCollection 2021 Mar 19. iScience. 2021. PMID: 33748701 Free PMC article.
-
Galvanic vs. pulsatile effects on decision-making networks: reshaping the neural activation landscape.J Neural Eng. 2024 Apr 3;21(2):10.1088/1741-2552/ad36e2. doi: 10.1088/1741-2552/ad36e2. J Neural Eng. 2024. PMID: 38518369 Free PMC article.
-
Exploring GVS as a display modality: cutaneous sensations and cue association maintenance.Exp Brain Res. 2025 Mar 21;243(4):97. doi: 10.1007/s00221-025-07058-z. Exp Brain Res. 2025. PMID: 40116977 Free PMC article.
-
Clinical Potential of Nerve Input to Tumors: A Bioelectricity Perspective.Bioelectricity. 2021 Mar 1;3(1):14-26. doi: 10.1089/bioe.2020.0051. Epub 2021 Mar 16. Bioelectricity. 2021. PMID: 34476375 Free PMC article.
References
-
- Gensberger K. D., Kaufmann A.-K., Dietrich H., Branoner F., Banchi R., Chagnaud B. P., Straka H. Galvanic Vestibular Stimulation: Cellular Substrates and Response Patterns of Neurons in the Vestibulo-Ocular Network. Journal of Neuroscience. 2016;36(35):9097–9110. doi: 10.1523/JNEUROSCI.4239-15.2016. - DOI - PMC - PubMed
Publication types
MeSH terms
Grants and funding
- R01 DC012957/DC/NIDCD NIH HHS/United States
- R01 NS092726/NS/NINDS NIH HHS/United States
- R01DC009255/U.S. Department of Health & Human Services | NIH | National Institute on Deafness and Other Communication Disorders (NIDCD)/International
- R01DC006476/U.S. Department of Health & Human Services | NIH | National Institute on Deafness and Other Communication Disorders (NIDCD)/International
LinkOut - more resources
Full Text Sources
