. 2019 Nov 7;10(4):383-393.
doi: 10.1007/s13167-019-00189-8. eCollection 2019 Dec.

Development of a membrane lipid metabolism-based signature to predict overall survival for personalized medicine in ccRCC patients

Affiliations

Development of a membrane lipid metabolism-based signature to predict overall survival for personalized medicine in ccRCC patients

Maode Bao et al. EPMA J. .

Abstract

Background: Clear cell renal cell carcinoma (ccRCC) is the most common type of renal cell carcinoma and is characterized by a dysregulation of changes in cellular metabolism. Altered lipid metabolism contributes to ccRCC progression and malignancy.

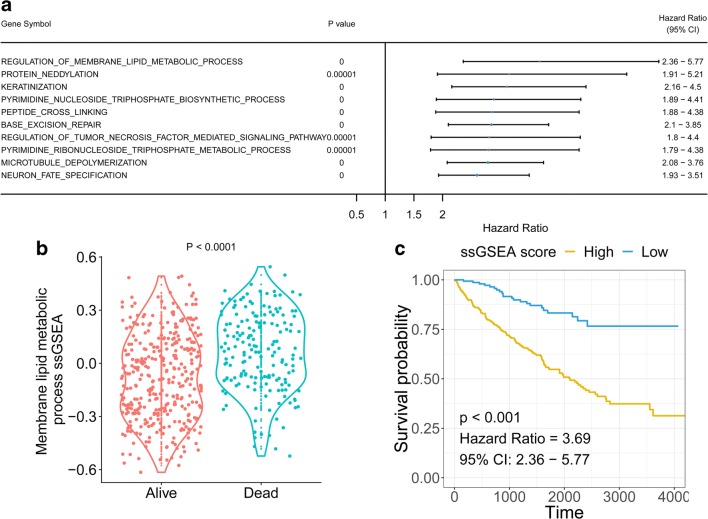
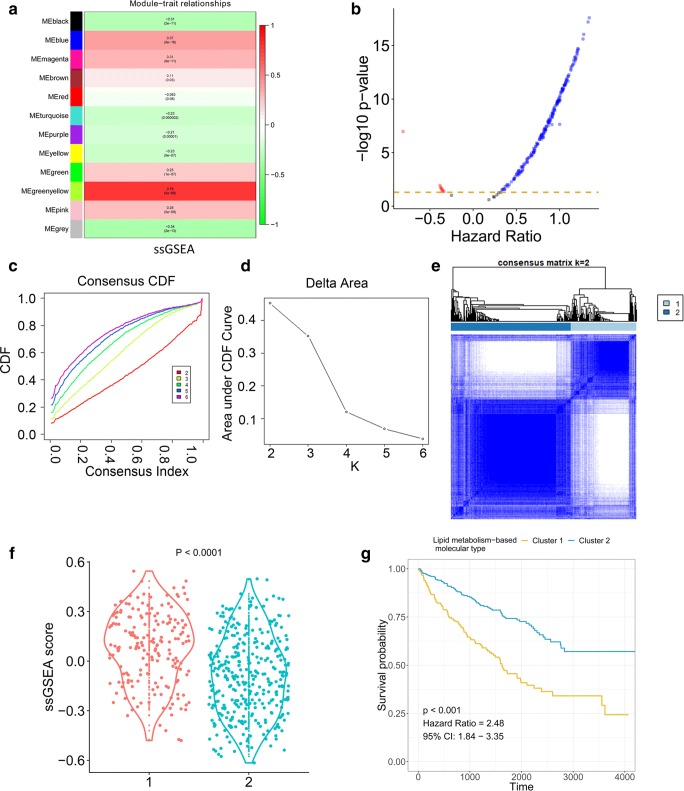
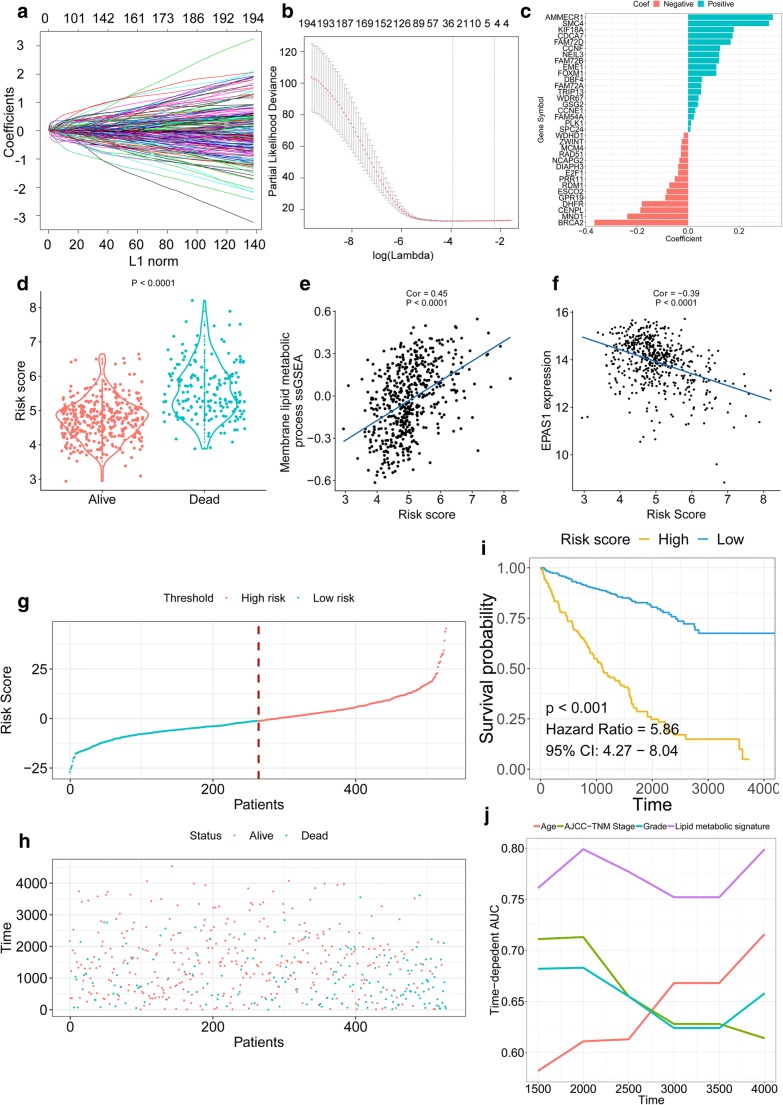
Method: Associations among survival potential and each gene ontology (GO) term were analyzed by univariate Cox regression. The results revealed that membrane lipid metabolism had the greatest hazard ratio (HR). Weighted gene co-expression network analysis (WGCNA) was applied to determine the key genes associated with membrane lipid metabolism. Consensus clustering was used to identify novel molecular subtypes based on the key genes. LASSO Cox regression was performed to build a membrane lipid metabolism-based signature. The random forest algorithm was applied to find the most important mutations associated with membrane lipid metabolism. Decision trees and nomograms were constructed to quantify risks for individual patients.

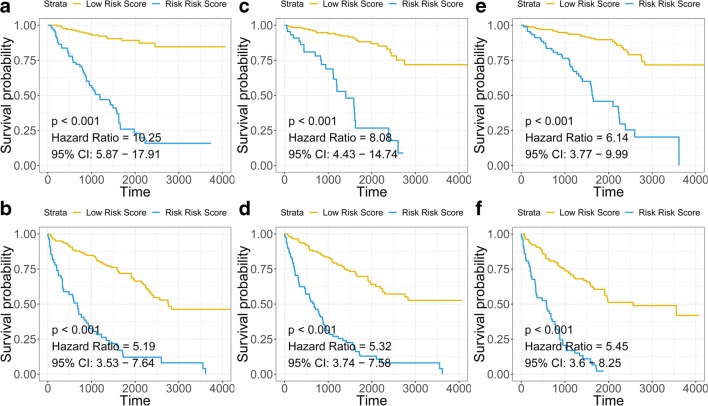
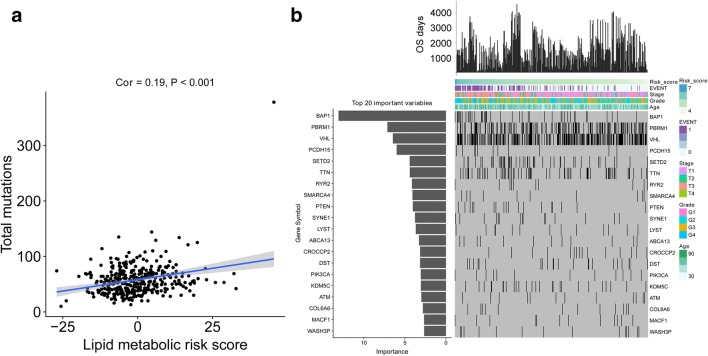
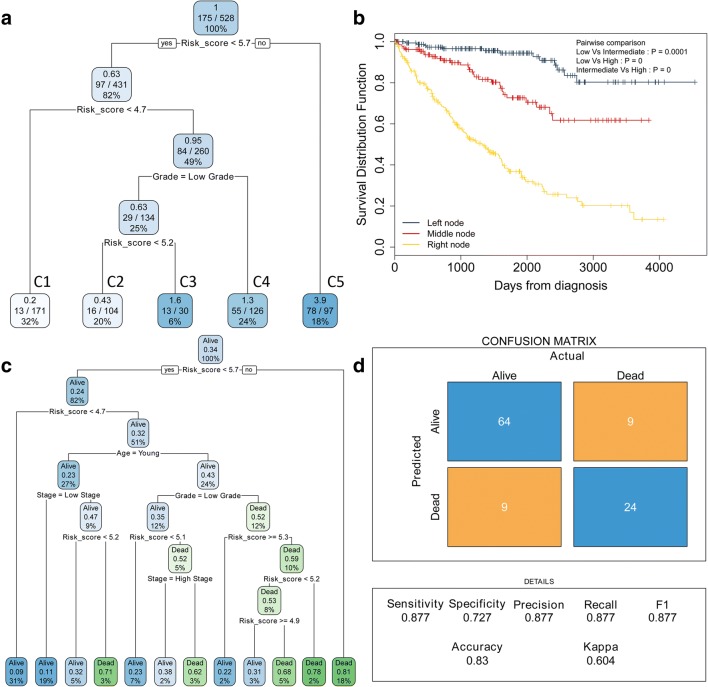
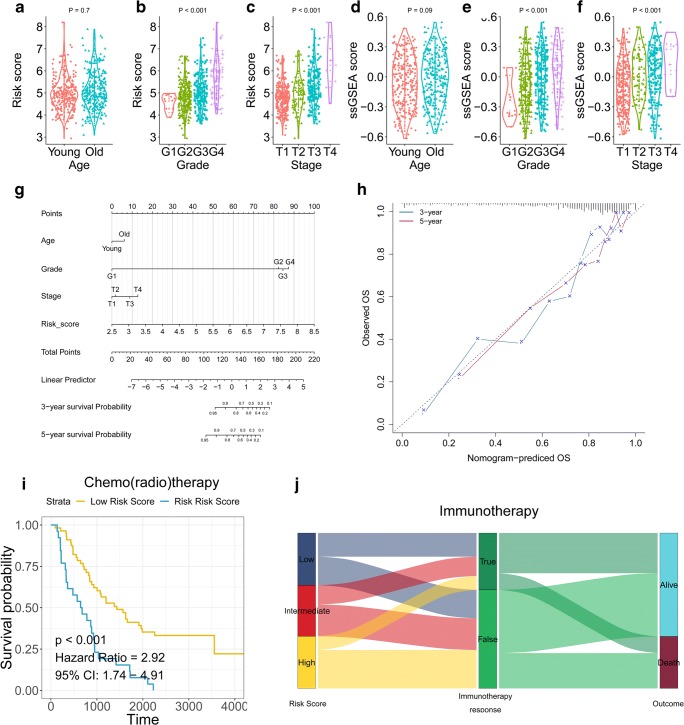
Result: Membrane lipid metabolism stratified ccRCC patients into high- and low-risk groups. Key genes were identified by WGCNA. Membrane lipid metabolism-based signatures exhibited higher prediction efficiency than other clinicopathological traits in both whole cohort and subgroup analyses. The random forest algorithm revealed high associations among the membrane lipid metabolism-based signature and BAP1, PBRM1 and VHL mutations. Decision trees and nomograms indicated high efficiency for risk stratification.

Conclusion: Our study might contribute to the optimization of risk stratification for survival and personalized management of ccRCC patients.

Keywords: Algorithm; Clear cell renal cell carcinoma (ccRCC); Decision tree; Gene co-expression network analysis; Gene signature; Membrane lipid metabolism; Overall survival; Patient stratification; Predictive preventive personalized medicine (PPPM); Risk assessment; Somatic mutations; von Hippel-Lindau (VHL).


Conflict of interest statement

Conflict of interestThe authors declare that they have no competing interests.

Figures

Fig. 1
Fig. 1
Correlation of ssGSEA score and overall survival of ccRCC patients. a Gene ontology term with greatest HR in univariate Cox regression. b Membrane lipid metabolism ssGSEA distribution in living and deceased ccRCC patients. c Kaplan-Meier plot for patients with high and low membrane lipid metabolism ssGSEA scores
Fig. 2
Fig. 2
Identification of novel molecular subtypes. a Correlation between modules and ssGSEA score. b Cox coefficients and p values from univariate Cox regression for the genes in the greenyellow module. c Consensus clustering cumulative distribution function (CDF) for k = 2 to 6. d Relative change in the area under the CDF curve for k = 2 to 6. e Consensus matrix similarity for 2 clusters in the ccRCC cohorts. f Membrane lipid metabolism ssGSEA distribution in two clusters. g Kaplan-Meier plot for patients in cluster 1 and cluster 2
Fig. 3
Fig. 3
Signature-based risk score is a promising marker in ccRCC cohort. a, b LASSO Cox analysis identified genes most correlated with overall survival. c Cox coefficients distribution of the gene signature. d Risk score distribution in living and dead patients. e Correlation between membrane lipid metabolism ssGSEA score and signature-based risk score. f Correlation between EPAS1 expression and signature-based risk score. g Risk score distribution. h Survival overview. i Patients in the high-risk group exhibited worse overall survival compared with those in the low-risk group. j AUC(t) of multivariable models indicated the membrane lipid metabolism–based signature had the highest predictive power for overall survival. h Membrane lipid metabolism–based risk score distribution in living and deceased ccRCC patients
Fig. 4
Fig. 4
Survival analysis in subgroups. Signature-based risk score is a promising marker for overall survival in young (a), old (b), low histologic grade (I–II) (c), high histologic grade (III–IV) (d), low AJCC-TNM stage (I–II) (e) and high AJCC-TNM stage (III–IV) (f)
Fig. 5
Fig. 5
Random forest identified the most important gene mutations. a Correlation between the membrane lipid metabolism–based signature and somatic mutations. b Distribution of somatic mutations correlated with the membrane lipid metabolism–based signature. The upper bar plot indicates OS per patient, whereas the left bar plot shows the importance of the somatic mutations correlated with the membrane lipid metabolism–based signature
Fig. 6
Fig. 6
Decision trees were generated to improve risk stratification. a A survival decision tree was generated to optimize risk stratification, and three risk subgroups were identified. b Kaplan-Meier plot showed three risk subgroups differed remarkably in overall survival of ccRCC patients. c A binary decision tree was generated to identify the survival status of ccRCC patients. d Confusion matrix was generated to illustrate the accuracy of the binary decision tree
Fig. 7
Fig. 7
A nomogram was constructed to personalize risk for individual patients. ac Risk score distribution in young and old, histologic G1–G4, AJCC Stage 1–4 status. df Membrane lipid metabolism ssGSEA distribution in young and old, histologic G1–G4, AJCC Stage 1–4 status. g Nomogram. h Calibration curves of survival prediction at different times were close to ideal performance. i, j Patients with higher risk score exhibited worse overall survival among those who received adjuvant therapies including chemo(radio)therapy and immunotherapy

References

    1. Mickley A, Kovaleva O, Kzhyshkowska J, Gratchev A. Molecular and immunologic markers of kidney cancer—potential applications in predictive, preventive and personalized medicine. EPMA J. 2015;6(1):20. doi: 10.1186/s13167-015-0042-2. - DOI - PMC - PubMed
    1. Guo G, Gui Y, Gao S, Tang A, Hu X, Huang Y, et al. Frequent mutations of genes encoding ubiquitin-mediated proteolysis pathway components in clear cell renal cell carcinoma. Nat Genet. 2012;44(1):17. doi: 10.1038/ng.1014. - DOI - PubMed
    1. Varela I, Tarpey P, Raine K, Huang D, Ong CK, Stephens P, et al. Exome sequencing identifies frequent mutation of the SWI/SNF complex gene PBRM1 in renal carcinoma. Nature. 2011;469(7331):539. doi: 10.1038/nature09639. - DOI - PMC - PubMed
    1. Dalgliesh GL, Furge K, Greenman C, Chen L, Bignell G, Butler A, et al. Systematic sequencing of renal carcinoma reveals inactivation of histone modifying genes. Nature. 2010;463(7279):360. doi: 10.1038/nature08672. - DOI - PMC - PubMed
    1. Du W, Zhang L, Brett-Morris A, Aguila B, Kerner J, Hoppel CL, et al. HIF drives lipid deposition and cancer in ccRCC via repression of fatty acid metabolism. Nat Commun. 2017;8(1):1769. doi: 10.1038/s41467-017-01965-8. - DOI - PMC - PubMed

LinkOut - more resources