To remain or leave: Dispersal variation and its genetic consequences in benthic freshwater invertebrates
- PMID: 31832145
- PMCID: PMC6854113
- DOI: 10.1002/ece3.5656
To remain or leave: Dispersal variation and its genetic consequences in benthic freshwater invertebrates
Abstract
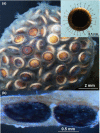
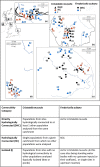
Variation in dispersal capacity may influence population genetic variation and relatedness of freshwater animals thus demonstrating how life-history traits influence patterns and processes that in turn influence biodiversity. The majority of studies have focused on the consequences of dispersal variation in taxa inhabiting riverine systems whose dendritic nature and upstream/downstream gradients facilitate characterizing populations along networks. We undertook extensive, large-scale investigations of the impacts of hydrological connectivity on population genetic variation in two freshwater bryozoan species whose dispersive propagules (statoblasts) are either attached to surfaces (Fredericella sultana) or are released as buoyant stages (Cristatella mucedo) and that live primarily in either lotic (F. sultana) or lentic environments (C. mucedo). Describing population genetic structure in multiple sites characterized by varying degrees of hydrological connectivity within each of three (or four) UK regions enabled us to test the following hypotheses: (1) genetic diversity and gene flow will be more influenced by hydrological connectivity in populations of C. mucedo (because F. sultana dispersal stages are retained); (2) populations of F. sultana will be characterized by greater genetic divergence than those of C. mucedo (reflecting their relative dispersal capacities); and (3) genetic variation will be greatest in F. sultana (reflecting a propensity for genetic divergence as a result of its low dispersal potential). We found that hydrological connectivity enhanced genetic diversity and gene flow among C. mucedo populations but not in F. sultana while higher overall measures of clonal diversity and greater genetic divergence characterized populations of F. sultana. We suggest that genetic divergence over time within F. sultana populations reflects a general constraint of releasing propagules that might eventually be swept to sea when taxa inhabit running waters. In contrast, taxa that primarily inhabit lakes and ponds may colonize across hydrologically connected regions, establishing genetically related populations. Our study contributes more nuanced views about drivers of population genetic structures in passively dispersing freshwater invertebrates as outlined by the Monopolization Hypothesis (Acta Oecologica, 23, 2002, 121) by highlighting how a range of demographic and evolutionary processes reflect life-history attributes of benthic colonial invertebrates (bryozoans) and cyclically parthenogenetic zooplankton. In addition, growing evidence that genetic divergence may commonly characterize populations of diverse groups of riverine taxa suggests that organisms inhabiting lotic systems may be particularly challenged by environmental change. Such change may predispose riverine populations to extinction as a result of genetic divergence combined with limited dispersal and gene flow.
Open research badges: This article has earned an Open Data Badge for making publicly available the digitally-shareable data necessary to reproduce the reported results. The data is available at https://doi.org/10.5061/dryad.1tm8705.
Keywords: Cristatella mucedo; Fredericella sultana; dispersal ability; gene flow; hydrological connectivity; statoblasts.
© 2019 The Authors. Ecology and Evolution published by John Wiley & Sons Ltd.
Conflict of interest statement
None declared.
Figures


Similar articles
-
Genetic diversity of North American populations of Cristatella mucedo, inferred from microsatellite and mitochondrial DNA.Mol Ecol. 2000 Sep;9(9):1375-89. doi: 10.1046/j.1365-294x.2000.01024.x. Mol Ecol. 2000. PMID: 10972776
-
Genetic variation in a freshwater bryozoan. I: Populations in the Thames basin, UK.Mol Ecol. 1998 Nov;7(11):1575-85. doi: 10.1046/j.1365-294x.1998.00492.x. Mol Ecol. 1998. PMID: 9819908
-
The effects of infection by Tetracapsuloides bryosalmonae (Myxozoa) and temperature on Fredericella sultana (Bryozoa).Int J Parasitol. 2009 Jul 15;39(9):1003-10. doi: 10.1016/j.ijpara.2009.01.007. Int J Parasitol. 2009. PMID: 19504757
-
A synthesis of genetic connectivity in deep-sea fauna and implications for marine reserve design.Mol Ecol. 2016 Jul;25(14):3276-98. doi: 10.1111/mec.13689. Epub 2016 Jun 30. Mol Ecol. 2016. PMID: 27146215 Review.
-
Comparative morphology of the nervous system in three phylactolaemate bryozoans.Front Zool. 2015 Oct 12;12:28. doi: 10.1186/s12983-015-0112-2. eCollection 2015. Front Zool. 2015. PMID: 26464575 Free PMC article. Review.
Cited by
-
The future of endangered crayfish in light of protected areas and habitat fragmentation.Sci Rep. 2020 Sep 10;10(1):14870. doi: 10.1038/s41598-020-71915-w. Sci Rep. 2020. PMID: 32913322 Free PMC article.
References
-
- Allendorf, F. W. , England, P. R. , Luikart, G. , Ritchie, P. A. , & Ryman, N. (2008). Genetic effects of harvest on wild animal populations. Trends in Ecology and Evolution, 23, 327–337. - PubMed
-
- Alp, M. , Keller, I. , Westram, A. M. , & Robinson, C. T. (2012). How river structure and biological traits influence gene flow: A population genetic study of two stream invertebrates with differing dispersal abilities. Freshwater Biology, 57(5), 969–981. 10.1111/j.1365-2427.2012.02758.x - DOI
-
- Amos, W. , Hoffman, J. I. , Frodsham, A. , Zhang, L. , Best, S. , & Hill, A. V. S. (2006). Automated binning of microsatellite alleles: Problems and solutions. Molecular Ecology Notes, 7, 10–14. 10.1111/j.1471-8286.2006.01560.x - DOI
-
- Arnaud‐Haond, S. , & Belkhir, K. (2007). GENCLONE: A computer program to analyse genotypic data, test for clonality and describe spatial clonal organization. Molecular Ecology Notes, 7, 15–17. 10.1111/j.1471-8286.2006.01522.x - DOI
Associated data
LinkOut - more resources
Full Text Sources
Other Literature Sources

