Review
. 2019 Sep 30;6(23):1900730.
doi: 10.1002/advs.201900730. eCollection 2019 Dec.

Engineering State-of-the-Art Plasmonic Nanomaterials for SERS-Based Clinical Liquid Biopsy Applications

Affiliations
Review

Engineering State-of-the-Art Plasmonic Nanomaterials for SERS-Based Clinical Liquid Biopsy Applications

Jing Wang et al. Adv Sci (Weinh). .

Abstract

Precision oncology, defined as the use of the molecular understanding of cancer to implement personalized patient treatment, is currently at the heart of revolutionizing oncology practice. Due to the need for repeated molecular tumor analyses in facilitating precision oncology, liquid biopsies, which involve the detection of noninvasive cancer biomarkers in circulation, may be a critical key. Yet, existing liquid biopsy analysis technologies are still undergoing an evolution to address the challenges of analyzing trace quantities of circulating tumor biomarkers reliably and cost effectively. Consequently, the recent emergence of cutting-edge plasmonic nanomaterials represents a paradigm shift in harnessing the unique merits of surface-enhanced Raman scattering (SERS) biosensing platforms for clinical liquid biopsy applications. Herein, an expansive review on the design/synthesis of a new generation of diverse plasmonic nanomaterials, and an updated evaluation of their demonstrated SERS-based uses in liquid biopsies, such as circulating tumor cells, tumor-derived extracellular vesicles, as well as circulating cancer proteins, and tumor nucleic acids is presented. Existing challenges impeding the clinical translation of plasmonic nanomaterials for SERS-based liquid biopsy applications are also identified, and outlooks and insights into advancing this rapidly growing field for practical patient use are provided.

Keywords: clinical translation; liquid biopsies; plasmonic nanomaterials; precision oncology; surface‐enhanced Raman scattering.


Conflict of interest statement

The authors declare no conflict of interest.

Figures
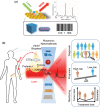
Figure 1
Figure 1
a) Enhanced Raman scattering of molecules on or near the surface of plasmonic nanomaterials provides fingerprint information of molecules, and could be used as a barcode signal in SERS measurements. b) Liquid biopsy could provide comprehensive molecular information on the primary and metastatic tumors present in a patient. The development of high‐performance plasmonic nanomaterials further amplifies SERS signals for broad potential clinical applications.
Figure 2
Figure 2
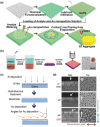
a) Representation of contacts between proteins and corner sites of silver nanocubes. b) Bright‐field transmission electron microscopy (TEM) images of a single silver nanocube before (top) and after (bottom) incubation with cytochrome c; images on the right are the corresponding magnification of corners. Reproduced with permission.21 Copyright 2017, American Chemical Society. c) One‐pot synthesis process of nanodot‐decorated gold–silver alloy nanoboxes with single‐particle SERS activity. Reproduced with permission.38 Copyright 2018, American Chemical Society. d) Comparison of shape‐controlled syntheses using surface blocking reagents (conventional synthetic methods), and in absence of surface blocking reagents. e) TEM images of nanostars, nanospheres, nanorods, and nanoplates synthesized without using surface blocking reagents. Reproduced with permission.40 Copyright 2017, Wiley‐VCH.
Figure 3
Figure 3
a) Formation of islands‐on‐gold nanostructures. b) TEM images of gold nanospheres and islands‐on‐gold nanospheres (top row), gold nanoplates and islands‐on‐gold nanoplates (middle row), and gold nanorods and islands‐on‐gold nanorods (bottom row) with low (middle column) to high (right column) densities of nanoislands. Scale bar of the inset is 50 nm. Reproduced with permission.42 Copyright 2018, Wiley‐VCH. c) Schematic illustration and d) TEM images of triangular and hexagonal silver nanoplates with nanogaps. Reproduced with permission.43 Copyright 2018, American Chemical Society. e) Synthesis of core–shell nanoparticles with embedded molecules. f) Corresponding TEM and scanning TEM images based on gold, sulfur, silver, and sulfur/silver signals. Reproduced with permission.45 Copyright 2015, Wiley‐VCH. g) Synthesis of versatile plasmonic nanogapped nanoparticles based on polydopamine coatings. h) Schematic of the immunoassay of using SERS nanotags with magnetic cores for bacteria detection. Reproduced with permission.[qv: 23d] Copyright 2016, American Chemical Society.
Figure 4
Figure 4
a) Schematic representation of substrate‐based sequential dimer assembling. b) SEM image of ideal dimers formed on a glass substrate. Reproduced with permission.[qv: 24f] Copyright 2017, Wiley‐VCH. c) Representation of the silver‐ion soldering process for forming particle assemblies. d) TEM images of gel‐isolated gold nanoparticle dimers of 5.5 and 13.5 nm, showing 95% and 98% yields, respectively. Reproduced with permission.48 Copyright 2016, Royal Society of Chemistry. e) Reversible self‐assembly of Janus gold nanoparticle dimers. f) TEM images of original (left), self‐assembled (middle), and disassembled (right) Janus gold nanoparticles. Scale bar of the inset is 50 nm. Reproduced with permission.49 Copyright 2016, American Chemical Society. g) Schematic design of gold nanoparticle dimers on DNA origami. Reproduced with permission.[qv: 50c] Copyright 2016, American Chemical Society. h) DNA origami gold nanostar dimers. Reproduced with permission.[qv: 24b] Copyright 2017, American Chemical Society. i) Schematic illustration of gold pyramid‐based telomerase detection. Reproduced with permission.[qv: 24g] Copyright 2016, Wiley‐VCH.
Figure 5
Figure 5
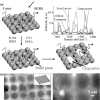
a) Beveled gold triangular prism assembly via droplet evaporation. b) SEM images of the i‐honeycomb lattice. Reproduced with permission.52 Copyright 2017, American Chemical Society. c) Formation of supercrystals with two unique structures. d) Cross‐sectional SEM images of the supercrystal assembled using octahedra as building blocks. Reproduced with permission.29 Copyright 2018, Nature Publishing Group. e) Formation of colloidal gold superparticles through self‐assembly of in situ–formed gold nanoparticles. f) Photograph, UV–vis spectrum, and TEM image of colloidal gold superparticles. Reproduced with permission.53 Copyright 2018, American Chemical Society. g) Schematic representation of the template‐assisted assembly of gold nanospheres into periodic arrays of well‐defined gold nanosphere clusters over large areas. h) SEM image of representative gold nanosphere clusters. Reproduced with permission.54 Copyright 2018, American Chemical Society.
Figure 6
Figure 6
a) Schematic illustration of complete concentrations of analytes and gold nanoparticles within an evaporating liquid droplet via a slippery omniphobic substrate. Reproduced with permission.[qv: 55b] Copyright 2016, National Academy of Sciences (USA). b) Synthesis scheme, SEM image, and optical image (inset) of gold nanoparticle monolayers obtained from water/hexane interface for SERS measurements. Reproduced with permission.56 Copyright 2016, Wiley‐VCH. c) Nanofabrication of gold‐nanofève substrate (GNF). d) SEM images showing alterations in the quasiparallel alignment of anisotropic gold nanostructures at deposition angle at 0° (gold–nanocoral substrate, GNC), 45°, and 80° (GNF). Reproduced with permission.58 Copyright 2018, Nature Publishing Group.
Figure 7
Figure 7
a) Schematic of fabrication procedure and b) SEM images of ordered arrays of silver nanorod bundles. Reproduced with permission.[qv: 64c] Copyright 2016, Wiley‐VCH. Nanohoodoos topped by c) single gold nanoparticles and d) gold nanoparticle clusters formed during evaporation of solvent. e) SERS spectra of thiophenol obtained from these SERS substrates. Reproduced with permission.65 Copyright 2018, Wiley‐VCH.
Figure 8
Figure 8
a) Fabrication of SERS contact lens and demonstration of glucose detection. Reproduced with permission.66 Copyright 2016, Wiley‐VCH. b) Gold nanoparticle–decorated ZnO nanorods grown on cellulose paper for SERS analyses of amniotic fluids to detect prenatal diseases. Reproduced with permission.67 Copyright 2018, American Chemical Society. c) Illustration and d) SEM image of gold nanoparticle–conjugated nanorod arrays. Reproduced with permission.68 Copyright 2017, American Chemical Society. e) Gold nanostar–functionalized mechanical trap for 3D surface molecular profiling of single live cells. Reproduced with permission.69 Copyright 2017, Wiley‐VCH.
Figure 9
Figure 9
a) Illustration of a “nanopore‐in‐nanogap” hybrid structure for SERS measurements. b) TEM images of 2D silver nanoparticle supercrystals (left) and “nanopore‐in‐nanogap” hybrid arrays (right). Reproduced with permission.70 Copyright 2017, Wiley‐VCH.
Figure 10
Figure 10
a) Illustration of a microfluidic chip with three modules including an inlet, mixing, and SERS detection. b) Procedure of photoinduced growth of silver nanoaggregates and in situ SERS measurements. Reproduced with permission.[qv: 24e] Copyright 2017, Wiley‐VCH. c) Procedure used to fabricate a 3D microfluidic SERS chip by all‐femtosecond‐laser processing. Reproduced with permission.[qv: 75d] Copyright 2018, Wiley‐VCH.
Figure 11
Figure 11
a–f) Schematical illustration of different types of plasmonic nanostructures.
Figure 12
Figure 12
General detection principles for various types of liquid biopsy biomarkers using plasmonic nanomaterial‐based SERS technologies.
Figure 13
Figure 13
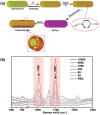
a) Construction of core–shell plasmonic nanorods with encapsulation of Raman reporters. b) SERS spectra of a different number of MCF7 cells from 20 to 12 000 spiked in blood mimicking fluid. Reproduced with permission.91 Copyright 2017, American Chemical Society.
Figure 14
Figure 14
a) Workflow of a size‐based microfluidic SERS platform for CTC capture, cell phenotype profiling, and SERS signature‐based classification. Reproduced with permission.92 Copyright 2018, Wiley‐VCH. b) Schematics of experimental workflow for CTC detection and characterization with a multiplex SERS nanotag system. c) CTC phenotypic evolution of patient 1 according to days of treatment. d) Diversity of CTC surface marker expression in response to treatment. Reproduced with permission.93 Copyright 2018, Nature Publishing Group.
Figure 15
Figure 15
a) Schematic diagram of SERS measurements of gold nanoparticle–coated EVs. b) SERS spectra of EVs derived from B16F10 melanoma cells (left) and erythrocytes (right). Red arrows indicate peaks arising from the 4‐dimethylaminopyridine coating on the surface of gold nanoparticles, and green arrows are supposed to be peaks relevant to EVs. c) The composition of two EV mixtures determined by SERS measurements in combination with partial least squares discriminant analysis. Mixture 1 and Mixture 2 contain 51% and 21% of B16F10 melanoma‐derived EVs among erythrocyte‐derived EVs, respectively. Reproduced with permission.[qv: 100c] Copyright 2016, Wiley‐VCH.
Figure 16
Figure 16
a) Schematic diagram of selective SERS detection of EVs derived from SKOV3 cells using silver nanoparticles conjugated with thiolated peptide ligands (LXY30‐SH) specific to α3ß1 integrin. b) Background SERS spectra and SERS spectra of LXY30‐SH conjugated silver nanoparticles for the detection of EVs from SKOV3 and Jurkat (control) cells. Reproduced with permission.[qv: 101a] Copyright 2017, Wiley‐VCH. c) Illustration of a SERS‐based EV detection method using magnetic nanoparticles as EV capture substrates, and gold core–silver shell nanorods as SERS nanotags. d) SERS spectra (left) and peak intensities at 1327 cm−1 (right) obtained with different amounts of EVs (from 4.88 × 10³ to 4.88 × 10⁶). Reproduced with permission.[qv: 101d] Copyright 2016, The Royal Society of Chemistry.
Figure 17
Figure 17
a) Schematic illustration of a SERS method that combines immunocapture‐based substrates and gold core–silver shell nanoparticles based SERS readouts for tumor‐derived EV detection. b) Shapiro–Wilk analysis plots of the SERS results of serum EV samples obtained from pancreatic cancer patients (n = 71) and healthy controls (n = 32) using the anti‐MIF platform. c) ROC curves were calculated (red: pancreatic cancer vs healthy controls; purple: metastasis vs nonmetastasis; and green: P1–2 versus P3 stages). AUC stands for area under the ROC curve. Reproduced with permission.[qv: 101c] Copyright 2018, The Royal Society of Chemistry.
Figure 18
Figure 18
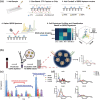
a) Illustration of silver pyramid self‐assembly by DNA frame as a SERS sensor for multiplex detection of cancer‐specific circulating protein biomarkers (PSA, thrombin, and Mucin‐1). Reproduced with permission.[qv: 24d] Copyright 2015, Wiley‐VCH. b) Schematic illustration of a 2D substrate‐based SERS immunoassay for PSA detection. Reproduced with permission.[qv: 108b] Copyright 2016, American Chemical Society. c) Schematic representation of a parallel 2D substrate‐based SERS immunoassay for the detection of multiple protein biomarkers (CEA, CA27‐29, and CA15‐3). Reproduced with permission.[qv: 108e] Copyright 2015, The Royal Society of Chemistry. d) Schematic illustration of using a pull‐down immunoassay based on the multiplex SERS readout for the detection of sPD‐1, sPD‐L1, and sEGFR. Reproduced with permission.39 Copyright 2018, American Chemical Society.
Figure 19
Figure 19
a) Scheme of ac‐EHD‐induced microfluidic‐SERS immunoassay. Reproduced with permission.[qv: 110c] Copyright 2015, American Chemical Society. b) Representation of ac‐EHD‐induced microfluidic‐multiplex SERS immunoassay. Reproduced with permission.[qv: 110a] Copyright 2017, Wiley‐VCH. c) Design of a magnetic nanochain–integrated microfluidic chip for the detection of cancer protein biomarkers. d) Conceptual illustration of multiplex detection of cancer protein biomarkers. e) Comparison of protein biomarker levels in 20 clinical serum specimens measured by the magnetic nanochain–integrated microfluidic chip and ELISA. Reproduced with permission.[qv: 110d] Copyright 2018, Nature Publishing Group.
Figure 20
Figure 20
a) Scheme of direct SERS detection of urinary RNA targets. b) The clinical verification of direct SERS detection for individual prostate cancer risk prediction using a clinically relevant biomarker model, and two independent sample cohorts. Reproduced with permission.[qv: 124a] Copyright 2018, American Chemical Society.
Figure 21
Figure 21
a) Scheme of using biointerference‐free probes for SERS detection of ctDNA of Epstein–Barr viruses in the blood. Reproduced with permission.127 Copyright 2018, American Chemical Society. b) Schematic of the PCR–SERS method for the detection of DNA mutations in plasma. Reproduced with permission.128 Copyright 2018, Ivyspring. c) Scheme of pentaplex RT‐RPA–SERS detection of RNA biomarkers in tumor and urine samples of prostate cancer patients. Reproduced with permission.130 Copyright 2016, Wiley‐VCH.

Similar articles

Cited by

References

    1. Di Meo A., Bartlett J., Cheng Y., Pasic M. D., Yousef G. M., Mol. Cancer 2017, 16, 80. - PMC - PubMed
    1. Brock G., Castellanos‐Rizaldos E., Hu L., Coticchia C., Skog J., Transl. Cancer Res. 2015, 4, 280.
    1. Otto A., J. Raman Spectrosc. 2005, 36, 497.
    1. Morton S. M., Jensen L., J. Am. Chem. Soc. 2009, 131, 4090. - PubMed
    1. Shan B., Pu Y., Chen Y., Liao M., Li M., Coord. Chem. Rev. 2018, 371, 11.

LinkOut - more resources