Review
. 2019 Sep 30;6(23):1901316.
doi: 10.1002/advs.201901316. eCollection 2019 Dec.

Evolution and Synthesis of Carbon Dots: From Carbon Dots to Carbonized Polymer Dots

Affiliations
Review

Evolution and Synthesis of Carbon Dots: From Carbon Dots to Carbonized Polymer Dots

Chunlei Xia et al. Adv Sci (Weinh). .

Abstract

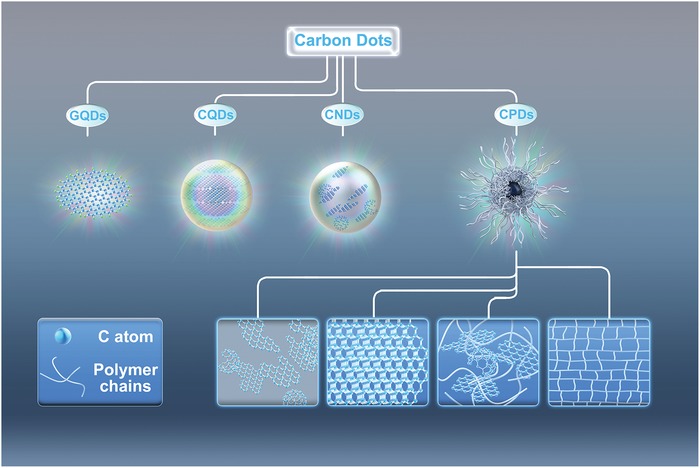
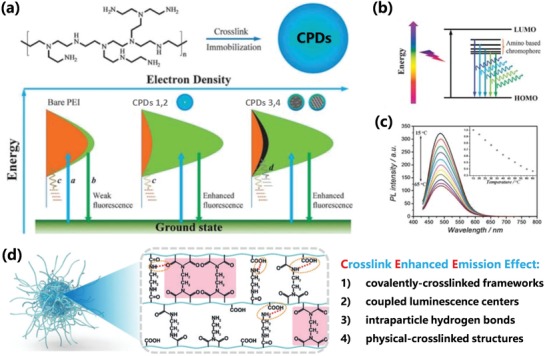
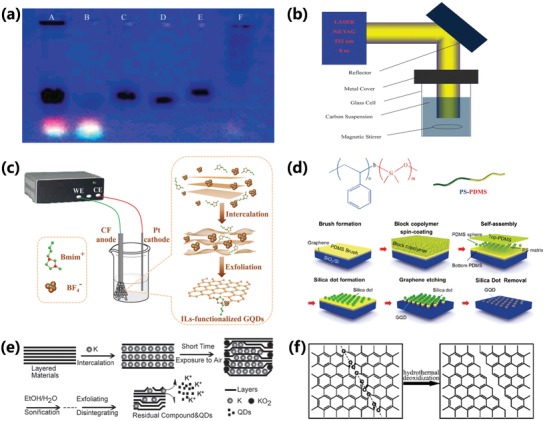
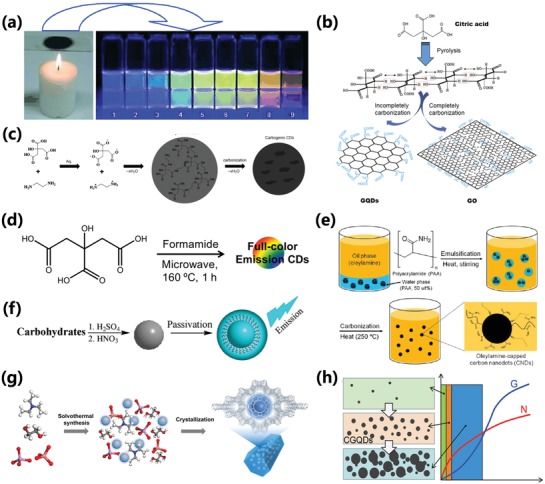
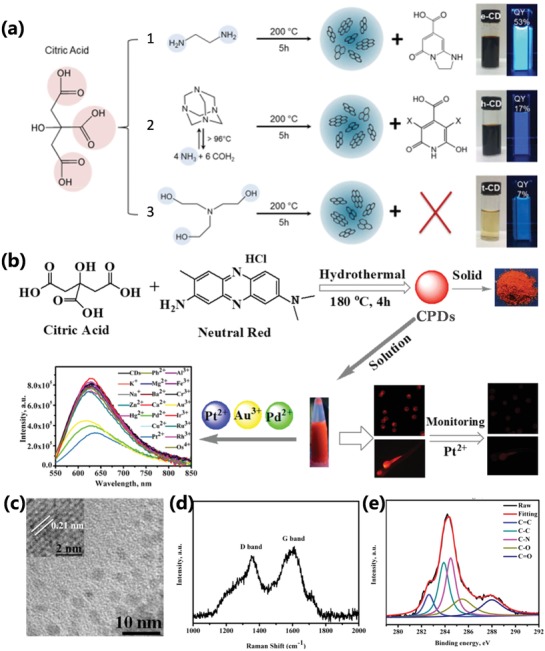
Despite the various synthesis methods to obtain carbon dots (CDs), the bottom-up methods are still the most widely administrated route to afford large-scale and low-cost synthesis. However, as CDs are developed with increasing reports involved in producing many CDs, the structure and property features have changed enormously compared with the first generation of CDs, raising classification concerns. To this end, a new classification of CDs, named carbonized polymer dots (CPDs), is summarized according to the analysis of structure and property features. Here, CPDs are revealed as an emerging class of CDs with distinctive polymer/carbon hybrid structures and properties. Furthermore, deep insights into the effects of synthesis on the structure/property features of CDs are provided. Herein, the synthesis methods of CDs are also summarized in detail, and the effects of synthesis conditions of the bottom-up methods in terms of the structures and properties of CPDs are discussed and analyzed comprehensively. Insights into formation process and nucleation mechanism of CPDs are also offered. Finally, a perspective of the future development of CDs is proposed with critical insights into facilitating their potential in various application fields.

Keywords: carbon dots; carbonized polymer dots; formation mechanism; photoluminescence mechanism; synthesis.


Conflict of interest statement

The authors declare no conflict of interest.

Figures

Figure 1
Figure 1
Classification of CDs: including graphene quantum dots (GQDs), carbon quantum dots (CQDs), carbon nanodots (CNDs), and carbonized polymer dots (CPDs), and the possible structures of carbon core of CPDs.
Figure 2
Figure 2
Structures of the carbon core: a) CPDs with the complete carbonization core: 1) representation of a CPD containing an oligomeric PEG diamine on the surface; 2) the high resolution transmission electron microscope (HRTEM) images of two CPDs with obvious crystal structure and amorphous carbon structure, respectively. a) Reproduced with permission.[qv: 33a] Copyright 2010, Wiley‐VCH. b) CPDs with a paracrystalline carbon structure core: 1) representation of a CPD; 2) the HRTEM image of the CPDs; the area surrounded by the dotted square in (2) is magnified in (3). b) Reproduced with permission.[qv: 34a] Copyright 2015, Nature Publishing Group. c) CPDs with a highly dehydrated crosslinking and close‐knit polymer frame structure core: 1) representation of a CPD; 2) the TEM image of the CPDs. c) Reproduced with permission.35 Copyright 2017, Elsevier.
Figure 3
Figure 3
a) Absorption spectra of the films prepared from anthracene (light blue), pyrene (dark blue), perylene (green) dispersed in PMMA matrix at 0.01% molar concentration, and absorption spectra of the CPDs aqueous solution (black dashed line). b) Normalized photoluminescence spectra of the corresponding films in (a) excited at 337 nm. c) Normalized absorption of a blend of polycyclic aromatic hydrocarbons (blue) with a molecular ratio of 10:10:1:20 anthracene/pyrene/perylene/PMMA monomer unit in PMMA film and the CPDs aqueous solution (black dashed line). d) Photoluminescence spectra of the same film in (c) excited at different wavelengths and the photoluminescence spectra of the CPDs (black dashed line) as a reference. e) The schematic diagram of fluorescence emission and origin of the CPDs. f) The schematic illustration of the exciton self‐trapping process in a pyrene molecule pair: a free exciton (blue spot) may be self‐trapped in a molecule pair as a self‐trapped exciton (red spot), resulting in the reduction of energy and mobility of the exciton, the absorption and emission are influenced by the interaction between fluorophores. a–f) Reproduced with permission.[qv: 40a] Copyright 2015, American Chemical Society. g) The schematic illustration of the synthesis and purification steps of bCPDs (blue emission) and gCPDs (green emission), the fluorophores of molecular state run out of the dialysis bag and get out of the CPDs' nanoparticles. Reproduced with permission.43 Copyright 2018, The Royal Society of Chemistry.
Figure 4
Figure 4
a) The variation of photoluminescence properties with the sizes of CQDs; b) HOMO–LUMO gap dependence on the size of the graphite fragments. a,b) Reproduced with permission.[qv: 21a] Copyright 2010, Wiley‐VCH. c) Schematic representation of the calculated atomic structures and their local density of states using Heyd–Scuseria–Ernzerhof (HSE) hybrid functional with different number of sp2 carbon ring confined by surrounding hydroxyl groups, which serve as subdomain to create the bandgap resulting in photoluminescence (gray, C atoms; red, O atoms; white, H atoms; and purple, K atoms). c) Reproduced with permission.[qv: 27a] Copyright 2016, Wiley‐VCH. d) Schematic illustration for the tunable photoluminescence of CPDs by changing the surface state with different degrees of surface oxidation. d) Reproduced with permission.[qv: 36c] Copyright 2015, American Chemical Society. e) The potential molecular state fluorophores in CA‐based CPDs prepared from different nitrogen‐containing precursors, the R can be small molecular groups or polymer chains. e) Reproduced with permission.22 Copyright 2015, The Royal Society of Chemistry.
Figure 5
Figure 5
a) Schematic representation for the photoluminescence mechanism (CEE effect) of bare PEI and CPDs 1–4. a: Electrons excited from the ground state and trapped by the amino‐based states; b: excited electrons return to the ground state via the radiative route; c: excited electrons return to the ground state via a vibration and rotation nonradiative route; d: excited electrons return to the ground state via a carbon core‐based nonradiative route. b) The suggested excited level for CPDs with excitation‐dependent behaviors. c) The temperature‐dependent photoluminescence of CPDs. a–c) Reproduced with permission.[qv: 25b] Copyright 2014, The Royal Society of Chemistry. d) Schematic illustration of CEE effect with specific crosslinking forms. d) Reproduced with permission.[qv: 25a] Copyright 2018, Wiley‐VCH.
Figure 6
Figure 6
a) Electrophoretic profile under 365 nm UV light for separating A) crude SWNTs suspension; B) fluorescent carbon; C) short tubular carbon; D,E) further separation of (C); F) cut SWNTs. a) Reproduced with permission.[qv: 2d] Copyright 2004, American Chemical Society. b) A schematic illustration of experimental setup for laser‐ablation method. b) Reproduced with permission.[qv: 56a] Copyright 2011, The Royal Society of Chemistry. c) Schematic illustration of the electrochemical exfoliation of carbon fibers in pure ionic liquid electrolyte for the preparation of CDs. c) Reproduced with permission.[qv: 57d] Copyright 2017, The Royal Society of Chemistry. d) Chemical structure of the PS‐PDMS BCP and schematic illustration of the fabrication of GQDs including the spin‐coating of BCP, formation of silica dots, and etching process by O2 plasma. d) Reproduced with permission.[qv: 30a] Copyright 2012, American Chemical Society. e) The schematic representation of the formation of GQDs by intercalating K atoms between the layered graphene sheets. e) Reproduced with permission.[qv: 60c] Copyright 2012, The Royal Society of Chemistry. f) The schematic representation of the formation mechanism of GQDs by hydrothermal cutting of oxidized GSs. f) Reproduced with permission.[qv: 28c] Copyright 2010, Wiley‐VCH.
Figure 7
Figure 7
a) Multicolor fluorescent CDs obtained from the combustion soot of candles. a) Reproduced with permission.[qv: 61a] Copyright 2007, Wiley‐VCH. b) Schematic representation of synthesis of GQDs and GO from the pyrolysis of citric acid. b) Reproduced with permission.66 Copyright 2012, Elsevier. c) Synthetic route of using citric acid and ethylenediamine to prepare CDs: from ionization to condensation, polymerization, and carbonization. c) Reproduced with permission.[qv: 7b] Copyright 2013, Wiley‐VCH. d) Schematic representation of full‐color emission CDs prepared from microwave‐assistant pyrolysis. d) Reproduced with permission.[qv: 65b] Copyright 2015, Wiley‐VCH. e) Schematic representation of formation of oleylamine‐capped CDs from carbonization of polyacrylamide in oleylamine emulsion micelles. e) Reproduced with permission.[qv: 73a] Copyright 2013, American Chemical Society. f) Schematic representation of dehydration and carbonization of carbohydrate caused by concentrated sulfuric acid to prepared CDs. f) Reproduced with permission.[qv: 38a] Copyright 2009, American Chemical Society. g) Schematic representation situ formation process of photoluminescent CDs@zeolites composite. g) Reproduced with permission.[qv: 75b] Copyright 2016, AAAS. h) The effect of nucleation rate and growth rate for the CVD synthesis of GQDs. h) Reproduced with permission.76 Copyright 2013, Wiley‐VCH.
Figure 8
Figure 8
a) Schematic diagram of synthesis process of citric acid–based CPDs using three different nitrogen‐containing precursors. The molecular state produced in reaction 1 (IPCA reported in previous work) and reaction 2 (citrazinic acid and/or 3,5 derivatives (marked by −X)) contribute to the bright luminescence. In reaction 3, there isn't molecular state produced resulting in low PLQY. a) Reproduced with permission.[qv: 47a] Copyright 2016, American Chemical Society. b) Schematic diagram of synthesis route of CPDs prepared from citric acid and neutral red by hydrothermal method and applications in ions detection, bioimaging, and biosensing. c) TEM and HRTEM (inset) images of the CPDs. d) Raman spectrum of the CPDs. e) The high‐resolution XPS C1s spectra of the CPDs. b–e) Reproduced with permission.[qv: 79a] Copyright 2017, American Chemical Society.
Figure 9
Figure 9
a) Schematic diagram of design and synthesis of chiral CPDs from (R,R)‐ or (S,S)‐1,2‐cyclohexanediamine and arginine by hydrothermal microwave‐assisted treatment. b) ECD spectra of CPDs‐S (red line) and CPDs‐R (black line). c) Experimental VCD spectra in water at 298 K of CPDs‐S (red line) and CPDs‐R (black line). a–c) Reproduced with permission.[qv: 82e] Copyright 2018, Nature Publishing Group. d) Schematic diagram of chiral GQDs prepared by modifying GQDs with L(D)‐cystein. d) Reproduced with permission.[qv: 42b] Copyright 2016, American Chemical Society.
Figure 10
Figure 10
a) Schematic representation for synthesis of CPDs in the presence of various nitrogen‐containing precursors: 1,2‐ethylenediamine (EDA), diethylamine (DEA), and triethylamine (TEA). The precursors with higher content of nitrogen possess higher PLQY. a) Reproduced with permission.[qv: 79c] Copyright 2012, The Royal Society of Chemistry. b) Schematic representation of the energy level structure of CPDs with nondoping, nitrogen doping, and sulfur doping. The heteroatoms doping resulted in the variation of electronic structure and energy level. b) Reproduced with permission.[qv: 88f] Copyright 2015, Wiley‐VCH. c) Schematic illustration of the Gd‐doped CPDs prepared by solvothermal of m‐phenylenediamine and Gd(NO3)3. c) Reproduced with permission.92 Copyright 2018, Wiley‐VCH.
Figure 11
Figure 11
a) Schematic representation of CPDs prepared from different hydrothermal temperatures in the one‐pot hydrothermal system of CA and EDA and varying from molecular state to carbon core state. a) Reproduced with permission.22 Copyright 2015, The Royal Society of Chemistry. b) Schematic representation of the emission features of the CPDs from the thermal treatment of mixture of CA and EA. The molecular state (blue groups) are transformed into the carbon core state (black sphere) so that the photoluminescence contribution of molecular state (blue bars) decreases and the photoluminescence contribution of carbon core state (black bars) increases. b) Reproduced with permission.[qv: 50b] Copyright 2011, American Chemical Society. c) Schematic representation of the formation of CPDs and the variation of photoluminescent centers by pyrolyzing CA and EDA with different carbonization degree. c) Reproduced with permission.[qv: 32a] Copyright 2018, American Chemical Society.
Figure 12
Figure 12
a) Schematic diagram of CPDs prepared by microwave pyrolysis approach with different reaction time. TEM images of CPDs prepared by different reaction time. (Sample A, b): the reaction time is 5 min; Sample B, c): the reaction time is 10 min). a–c) Reproduced with permission.93 Copyright 2009, The Royal Society of Chemistry. d) Schematic diagram of different emission CPDs prepared with different carbonization time. d) Reproduced with permission.[qv: 26a] Copyright 2016, Wiley‐VCH. e) FL intensity of same concentration CPD solution with different carbonization times. f) The high‐resolution C1s XPS spectra and the corresponding C‐C/C=C peaks of the CPDs‐150, CPDs‐200, and CPDs‐250. g) The shear stress variation with the shear rate of CPDs‐150, CPDs‐200, and CPDs‐250 solution (concentration: 50 mg mL−1; the slope represents the viscosity). e–g) Reproduced with permission.[qv: 13c] Copyright 2018, Wiley‐VCH.
Figure 13
Figure 13
a) Schematic representation of the preparation procedure of supersmall CNDs (SCNDs), amorphous CPDs, film‐like CPDs, and carbon nanosheets by hydrothermal carbonization of L‐serine and L‐tryptophan at different PH values and temperatures. a) Reproduced with permission.94 Copyright 2016, American Chemical Society. b) The possible formation mechanism of red emissive CPDs with conjugated aromatic benzene skeleton in the presence of HNO3 under high temperature and high pressure. b) Reproduced with permission.[qv: 10a] Copyright 2018, Wiley‐VCH. c) Schematic illustration of the preparation and LED application of acid‐mediated photoluminescent CPDs with solid state and solution emission. c) Reproduced with permission.81 Copyright 2017, American Chemical Society.
Figure 14
Figure 14
a) The scheme of the conversion process between different products for synthesis of the CPDs in the one‐pot hydrothermal system of CA and EDA. a) Reproduced with permission.22 Copyright 2015, The Royal Society of Chemistry. b) The scheme of formation mechanism of CPDs with tunable photoluminescence from condensation crosslinking and carbonization of L‐glutamic acid and o‐phenylenediamine by solvothermal. b) Reproduced with permission.[qv: 27d] Copyright 2018, Wiley‐VCH. c) The schematic diagram of the nucleation and reaction process of the CPDs from hydrothermal addition polymerization and carbonization of acrylamide monomers triggered by initiator. c) Reproduced with permission.[qv: 13c] Copyright 2018, Wiley‐VCH.
Figure 15
Figure 15
a) Schematic illustration of the formation of CPDs by hydrothermal treatment of polyacrylamide and the digital optical photos of CPD aqueous solution under daylight and UV irradiation. The CPDs grow larger with longer hydrothermal time. The TEM images of CPDs prepared by b) 24 h hydrothermal time, c) 72 h hydrothermal time, and d) 96 h hydrothermal time. a–d) Reproduced with permission.[qv: 27b] Copyright 2013, The Royal Society of Chemistry. e) Schematic illustration of formation mechanism of CPDs from small molecule and/or polymer precursors by polymerization and carbonization.

Similar articles

Cited by

References

    1. a) Dai X., Deng Y., Peng X., Jin Y., Adv. Mater. 2017, 29, 1607022; - PubMed
    2. b) Hildebrandt N., Spillmann C. M., Algar W. R., Pons T., Stewart M. H., Oh E., Susumu K., Diaz S. A., Delehanty J. B., Medintz I. L., Chem. Rev. 2017, 117, 536; - PubMed
    3. c) Kagan C. R., Lifshitz E., Sargent E. H., Talapin D. V., Science 2016, 353, aac5523; - PubMed
    4. d) Li X., Wu Y., Zhang S., Cai B., Gu Y., Song J., Zeng H., Adv. Funct. Mater. 2016, 26, 2435;
    5. e) Reiss P., Carriere M., Lincheneau C., Vaure L., Tamang S., Chem. Rev. 2016, 116, 10731. - PubMed
    1. a) Baker S. N., Baker G. A., Angew. Chem., Int. Ed. 2010, 49, 6726; - PubMed
    2. b) Bartelmess J., Quinn S. J., Giordani S., Chem. Soc. Rev. 2015, 44, 4672; - PubMed
    3. c) Lim S. Y., Shen W., Gao Z., Chem. Soc. Rev. 2015, 44, 362; - PubMed
    4. d) Xu X. Y., Ray R., Gu Y. L., Ploehn H. J., Gearheart L., Raker K., Scrivens W. A., J. Am. Chem. Soc. 2004, 126, 12736. - PubMed
    1. a) Sun K., Tang Y., Li Q., Yin S., Qin W., Yu J., Chiu D. T., Liu Y., Yuan Z., Zhang X., Wu C., ACS Nano 2016, 10, 6769; - PubMed
    2. b) Wu C., Chiu D. T., Angew. Chem., Int. Ed. 2013, 52, 3086. - PMC - PubMed
    1. a) Wu Y., Jelezko F., Plenio M. B., Weil T., Angew. Chem., Int. Ed. 2016, 55, 6586; - PubMed
    2. b) Turcheniuk K., Mochalin V. N., Nanotechnology 2017, 28, 252001. - PubMed
    1. a) Chakraborty I., Pradeep T., Chem. Rev. 2017, 117, 8208; - PubMed
    2. b) Shang L., Dong S., Nienhaus G. U., Nano Today 2011, 6, 401.

LinkOut - more resources