. 2020 Apr 14;30(4):2555-2572.
doi: 10.1093/cercor/bhz260.

Distinct Laminar Requirements for NMDA Receptors in Experience-Dependent Visual Cortical Plasticity

Affiliations

Distinct Laminar Requirements for NMDA Receptors in Experience-Dependent Visual Cortical Plasticity

Ming-Fai Fong et al. Cereb Cortex. .

Abstract

Primary visual cortex (V1) is the locus of numerous forms of experience-dependent plasticity. Restricting visual stimulation to one eye at a time has revealed that many such forms of plasticity are eye-specific, indicating that synaptic modification occurs prior to binocular integration of thalamocortical inputs. A common feature of these forms of plasticity is the requirement for NMDA receptor (NMDAR) activation in V1. We therefore hypothesized that NMDARs in cortical layer 4 (L4), which receives the densest thalamocortical input, would be necessary for all forms of NMDAR-dependent and input-specific V1 plasticity. We tested this hypothesis in awake mice using a genetic approach to selectively delete NMDARs from L4 principal cells. We found, unexpectedly, that both stimulus-selective response potentiation and potentiation of open-eye responses following monocular deprivation (MD) persist in the absence of L4 NMDARs. In contrast, MD-driven depression of deprived-eye responses was impaired in mice lacking L4 NMDARs, as was L4 long-term depression in V1 slices. Our findings reveal a crucial requirement for L4 NMDARs in visual cortical synaptic depression, and a surprisingly negligible role for them in cortical response potentiation. These results demonstrate that NMDARs within distinct cellular subpopulations support different forms of experience-dependent plasticity.

Keywords: NMDA receptor; amblyopia; long-term depression; ocular dominance plasticity; stimulus-selective response potentiation; visual cortex.


Figures

Figure 1
Figure 1
Cre-dependent knockout of NMDA receptors in cortical layer 4. (A) Confocal micrograph of Cre recombinase expression across layers of V1 in the Scnn1a-Cre line as revealed by the Cre-dependent tdTomato reporter. Scale bar, 200 μm. (B) Cartoon of visual cortical slice showing electrode placement for L4 voltage clamp recordings during stimulation of the white matter (WM). (C) Sample traces of evoked NMDA and AMPA receptor currents from V1 principal cells in L4-GluN1 knockout animal (Scnn1a-Cre+/−, GluN1fl/fl) recorded from a fluorescent Cre-positive (left) and a non-fluorescent Cre-negative (right) cell. Scale bars, 50 ms, 100 pA. (D) Mean ratio of NMDA-to-AMPA receptor currents from fluorescently-identified Cre-positive cells in animals possessing at least one wildtype copy of GluN1 (control, 0.5308 ± 0.05091; n = 5 animals, 9 cells) or from animals possessing two floxed copies of the GluN1 allele (KO, 0.05226 ± 0.01394, n = 7 animals, 11 cells). Filled circles, Scnn1a-Cre+/−, GluN1+/+; filled squares, Scnn1a-Cre+/−, GluN1fl/+; open circles, Scnn1a-Cre+/−, GluN1fl/fl. Error bars, SEM. Data points denote mean ratios within individual animals. Knockout animals showed significantly reduced ratios compared with wildtypes (Welch’s two-tailed t-test, t(4.605) = 9.067, P = 0.0004).
Figure 2
Figure 2
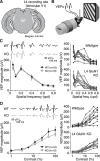
L4 NMDAR knockout mice show normal visual cortical response properties. (A) Cartoon of coronal slice 3.8 mm posterior to Bregma denoting recording location in L4 of binocular V1. (B) Schematic of awake mouse viewing phase-reversing grating stimuli during simultaneous recording of VEPs. (C) Left, mean VEP magnitudes across different spatial frequencies in L4-GluN1 knockout mice (n = 10) and wildtype littermates (n = 10). Error bars, SEM. There was no significant effect of genotype on acuity (two-way repeated measures ANOVA, interaction: F(6, 108) = 0.4204, P = 0.8640). Average VEP waveforms are shown above the plot. Scale bars, 100 ms, 50 μV. Right, spatial acuity VEP profiles for individual animals from each genotype. Age range, P34–P50. (D) Mean VEP magnitudes across different contrasts in L4-GluN1 knockout mice (n = 10) and wildtype littermates (n = 10). Error bars, SEM. There was no significant effect of genotype on contrast sensitivity (two-way repeated measures ANOVA, interaction: F(6, 108) = 1.036, P = 0.4059). Average VEP waveforms are shown above the plot. Scale bars, 100 ms, 50 μV. Right, contrast sensitivity VEP profiles for individual animals from each genotype. Age range, P35–P51.
Figure 3
Figure 3
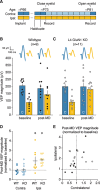
Stimulus-selective response potentiation is normal in absence of L4 NMDARs. (A) Experimental timeline for surgery, habituation, and V1 recordings during presentation of a familiar (F) or novel (N) oriented stimulus. (B) Schematic of awake mouse viewing phase-reversing grating stimuli during simultaneous recording of VEPs and visually induced fidgets (vidgets). (C) Left, mean VEP magnitudes on experimental days 1–6 during presentation of the same oriented visual stimulus, and on experimental day 7 during presentation of the familiar and novel stimuli, for L4-GluN1 knockout mice (n = 17) and wildtype littermates (n = 17). Both groups showed robust response potentiation, but there was no effect of genotype on the observed plasticity (two-way repeated measures ANOVA, interaction: F(5, 160) = 0.2372, P = 0.9456). In addition, both groups show potentiated VEPs for the familiar compared to the novel stimulus, but there was no effect of genotype on response specificity (two-way repeated measures ANOVA, interaction: F(1, 32) = 2.191 × 10−5, P = 0.9963). Error bars, SEM. Average VEP waveforms are shown above plot. Scale bars, 100 ms, 50 μV. Age range, P41–P150. Right, VEP magnitudes over time for individual animals used to generate averages at left. (D) Left, mean vidget magnitudes on experimental day 7 during presentation of the familiar or novel stimuli for L4-GluN1 knockout mice and wildtype littermates. Both groups show reduced vidget magnitude for the familiar compared to the novel stimulus, but there was no effect of genotype on these response profiles (two-way repeated measures ANOVA: interaction: F(1, 32) = 0.1286, P = 0.7222). Error bars, SEM. Average vidget waveforms are shown above plot. Scale bar, 2 s, 1 a.u. Right, vidget magnitudes for individual animals were used to generate averages at left. Data shown in this panel were collected concurrently with electrophysiology shown in (C).
Figure 4
Figure 4
Adult ocular dominance plasticity is normal in the absence of L4 NMDARs. (A) Experimental timeline for surgery, habituation, and V1 recordings during monocular presentation of oriented stimuli either before or after a 7–8-day period of eyelid closure in adult mice. (B, C) Mean VEP magnitudes before or after 7–8 days of MD for wildtype (n = 9) or knockout (n = 11) adult animals. Individual animal VEP magnitudes (circles) and average VEP waveforms (top) are included. Scale bars, 100 ms, 50 μV. There was no interaction between genotype and time in the magnitude of visual responses (two-way repeated measures ANOVAs, contralateral: F(1, 18) = 0.2022, P = 0.6584; ipsilateral F(1, 18) = 1.915, P = 0.1833). (D) Post-MD VEP magnitudes normalized to the pre-MD baseline values. This plot uses the same data as shown in (B, C), and normalization is performed on an animal-by-animal basis. Solid black lines denote mean and SEM. Dotted black line denotes the hypothetical median, signifying no change between pre- and post-MD magnitude. There was no change in deprived-eye VEP magnitude, but both genotypes showed evidence of open-eye potentiation (Wilcoxon signed-rank test, contralateral wildtype, P = 0.4961; contralateral knockout, P = 0.7646; ipsilateral wildtype, *P = 0.0391; ipsilateral knockout, *P = 0.0010). (E) Deprived (contralateral) versus non-deprived (ipsilateral) eye post-MD VEP magnitude using same data as (D). Individual animal values are shown here for both genotypes, and mean values are shown in Figure S5.
Figure 5
Figure 5
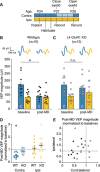
Deletion of NMDARs in L4 impairs juvenile ocular dominance plasticity. (A) Experimental timeline for surgery, habituation, and V1 recordings during monocular presentation of oriented stimuli either before or after a 3-day period of eyelid closure in juvenile mice. (B, C) Mean VEP magnitudes before or after 3 days of MD for wildtype (n = 10) or knockout (n = 12) juvenile animals. Individual animal VEP magnitudes (circles) and average VEP waveforms (top) are included. Scale bars, 100 ms, 50 μV. There was a significant interaction between genotype and time for contralateral eye responses (two-way repeated measures ANOVA, F(1,20) = 6.920, P = 0.0160). Wildtypes showed a significant depression of deprived-eye responses (baseline, 172.5 ± 21.20 μV; post-MD, 91.52 ± 11.30 μV; Bonferroni-corrected t-test, *P = 0.0002), while L4-GluN1 knockout animals did not (baseline, 171.0 ± 17.23 μV; post-MD, 149.4 ± 16.54 μV; Bonferroni-corrected t-test, P = 0.3426, denoted by n.s.). There was no effect of genotype on the response to MD for the ipsilateral eye (two-way repeated measures ANOVA, interaction: F(1,20) = 1.066, P = 0.3143). (D) Post-MD VEP magnitudes normalized to the pre-MD baseline values. This plot uses the same data as shown in (B, C), and normalization is performed on an animal-by-animal basis. Solid black lines denote mean and SEM. Dotted black line denotes the hypothetical mean, signifying no change between pre- and post-MD magnitude. Wildtype but not knockout animals showed significant depression of deprived-eye responses following MD, and neither genotype showed significantly altered open-eye responses (one-sample t-test, contralateral wildtype, *P = 0.0001; contralateral knockout, P = 0.1412; ipsilateral wildtype, P = 0.4774; ipsilateral knockout, P = 0.1285). (E) Deprived (contralateral) versus non-deprived (ipsilateral) eye post-MD VEP magnitude using same data as (D). Individual animal values are shown here for both genotypes, and mean values are shown in Figure S5.
Figure 6
Figure 6
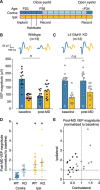
Deprived-eye depression, but not open-eye potentiation, is impaired by deletion of NMDARs in L4. (A) Experimental timeline for surgery, habituation, and V1 recordings during monocular presentation of oriented stimuli either before or after a 7–8-day period of eyelid closure in juvenile mice. (B, C) Mean VEP magnitudes before or after 7-8 days of MD for wildtype (n = 13) or knockout (n = 12) juvenile animals. Individual animal VEP magnitudes (circles) and average VEP waveforms (top) are included. Scale bars, 100 ms, 50 μV. There was a significant interaction between genotype and time for contralateral eye responses (two-way repeated measures ANOVA, F(1, 23) = 21.22, P = 0.0001). Wildtypes showed a significant depression of deprived-eye responses (baseline, 209.575 ± 15.666 μV; post-MD, 88.699 ± 10.083 μV; Bonferroni-corrected t-test, *P < 0.0001), while L4-GluN1 knockout animals did not (baseline, 196.871 ± 17.240 μV; post-MD, 196.858 ± 25.567 μV; Bonferroni-corrected t-test, P > 0.9999, denoted by n.s.). There was no effect of genotype on response to MD for the ipsilateral eye (two-way repeated measures ANOVA, interaction: F(1, 23) = 0.02338, P = 0.8798). (D) Post-MD VEP magnitudes normalized to the pre-MD baseline values. This plot uses the same data as shown in (B, C), and normalization is performed on an animal-by-animal basis. Solid black lines denote mean and SEM. Dotted black line denotes the hypothetical median signifying no change between pre- and post-MD magnitude. Wildtype but not knockout animals showed significant depression of deprived-eye responses following MD, and both genotypes showed significantly increased open-eye responses (Wilcoxon signed rank test, contralateral wildtype, *P = 0.0002; contralateral knockout, P = 0.9097, denoted by n.s.; ipsilateral wildtype, *P = 0.0266; ipsilateral knockout, *P = 0.0210). (E) Deprived (contralateral) versus non-deprived (ipsilateral) eye post-MD VEP magnitude using same data as (D). Individual animal values are shown here for both genotypes, and mean values are shown in Figure S5.
Figure 7
Figure 7
Deficits in visual function driven by MD are spared in animals lacking L4 NMDA receptors. (A) Left, mean contralateral VEP magnitudes across different spatial frequencies in L4-GluN1 knockout mice (n = 12) and wildtype littermates (n = 13) following 7–8 days of contralateral eye MD. Error bars, SEM. There was a significant interaction between genotype and spatial frequency (two-way repeated measures ANOVA, interaction: F(6, 138) = 2.302, P = 0.0378). Wildtypes showed significantly reduced deprived (contralateral) eye responses compared with L4-GluN1 knockout animals at 0.05 and 0.2 cpd (Bonferroni-corrected t-tests for wildtype vs. knockout: 0.05 cpd, *P = 0.0006; 0.1 cpd, P > 0.9999; 0.2 cpd, *P = 0.0092; 0.4 cpd, P = 0.2952; 0.6 cpd, P = 0.6172; 0.7 cpd, P > 0.9999; 0.8 cpd, P > 0.9999). Average VEP waveforms are shown above the plot. Scale bars, 100 ms, 50 μV. Right, spatial acuity VEP profiles for individual animals from each genotype. (B) Same format and animals as (A), but instead measured during stimulation of the open ipsilateral eye following 7–8 days of contralateral eye MD. There was no significant interaction between genotype and spatial frequency (two-way repeated measures ANOVA, interaction: F(6, 138) = 0.5978, P = 0.7317). (C) Same format and animals as (A), but for a range of different contrasts. There was a significant interaction between genotype contrast (two-way repeated measures ANOVA, interaction: F(6, 138) = 9.118, P < 0.0001). Wildtypes showed significantly reduced deprived (contralateral) eye responses compared with L4-GluN1 knockout animals at contrast levels of 12% or higher (Bonferroni-corrected t-tests for wildtype vs. knockout: 1%, P > 0.9999; 3%, P > 0.9999; 6%, P = 0.4444; 12%, *P = 0.0020; 25%, *P < 0.0001; 50%, *P < 0.0001; 100%, *P < 0.0001). (D) Same format and animals as (C), but instead measured during stimulation of the open ipsilateral eye following 7–8 days of contralateral eye MD. There was no significant interaction between genotype and spatial frequency (two-way repeated measures ANOVA, interaction: F(6, 138) = 0.6746, P = 0.6704). All data in this figure were collected from same animals used in Figure 6 after opening the deprived eye at P33 or P34.
Figure 8
Figure 8
L4 NMDARs are required for long-term depression in V1. (A) Cartoon of visual cortical slice with positions of field recording electrode in L4 and stimulation electrode in the white matter (WM). (B) Time course of mean L4 fEPSP magnitudes normalized to baseline for wildtype (n = 5) and L4-GluN1 knockout (n = 5) juvenile animals before and following LFS (900 stimuli at 1 Hz). Error bars, SEM. Example waveforms at select time points before and after LFS are shown above plot for each genotype. Scale bars, 10 ms, 50 μV. (C) Baseline-normalized fEPSP magnitudes during final 5 min of time course shown in (B). LTD was observed in wildtypes (78.86 ± 4.985%), but not in knockouts (97.95 ± 5.035%), and the two genotypes differed significantly (Student’s two-tailed t-test, *P = 0.0274).

Similar articles

Cited by

References

    1. Antonini A, Stryker MP. 1993. Rapid remodeling of axonal arbors in the visual cortex. Science. 260:1819–1821. - PubMed
    1. Aton SJ, Suresh A, Broussard C, Frank MG. 2014. Sleep promotes cortical response potentiation following visual experience. Sleep. 37:1163–1170. - PMC - PubMed
    1. Bear MF, Kleinschmidt A, Gu QA, Singer W. 1990. Disruption of experience-dependent synaptic modifications in striate cortex by infusion of an NMDA receptor antagonist. J Neurosci. 10:909–925. - PMC - PubMed
    1. Blakemore C, Garey LJ, Vital-Durand F. 1978. The physiological effects of monocular deprivation and their reversal in the monkey's visual cortex. J Physiol. 283:223–262. - PMC - PubMed
    1. Bliss TV, Collingridge GL. 1993. A synaptic model of memory: long-term potentiation in the hippocampus. Nature. 361:31–39. - PubMed

Publication types

Substances