

Differential Effects of Open- and Closed-Loop Intracortical Microstimulation on Firing Patterns of Neurons in Distant Cortical Areas
- PMID: 31832642
- PMCID: PMC7197073
- DOI: 10.1093/cercor/bhz281
Differential Effects of Open- and Closed-Loop Intracortical Microstimulation on Firing Patterns of Neurons in Distant Cortical Areas
Abstract
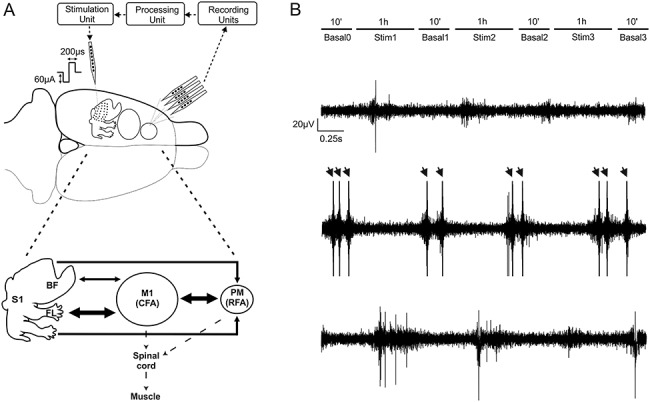
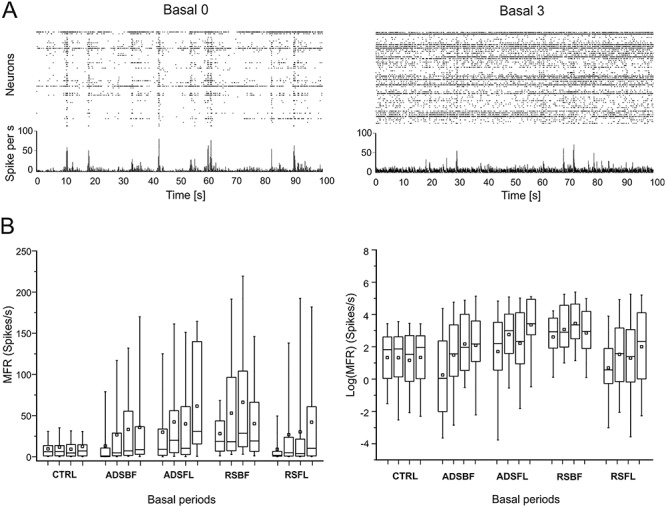
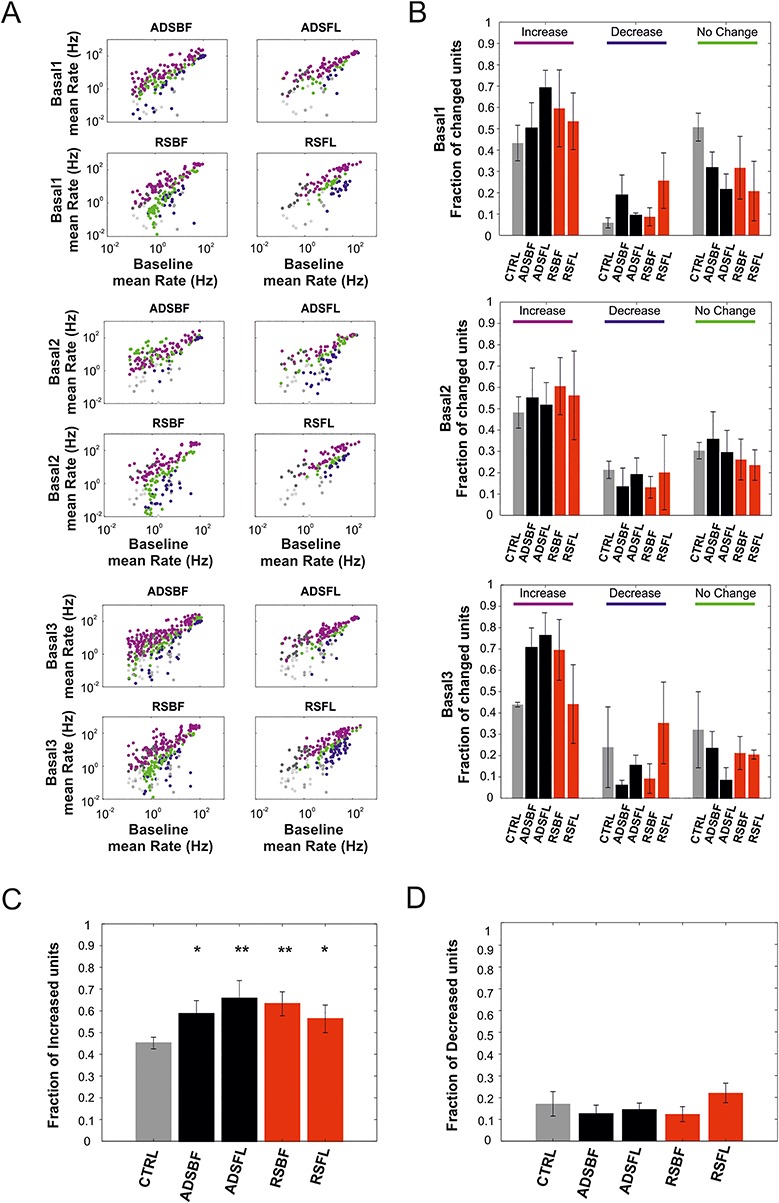
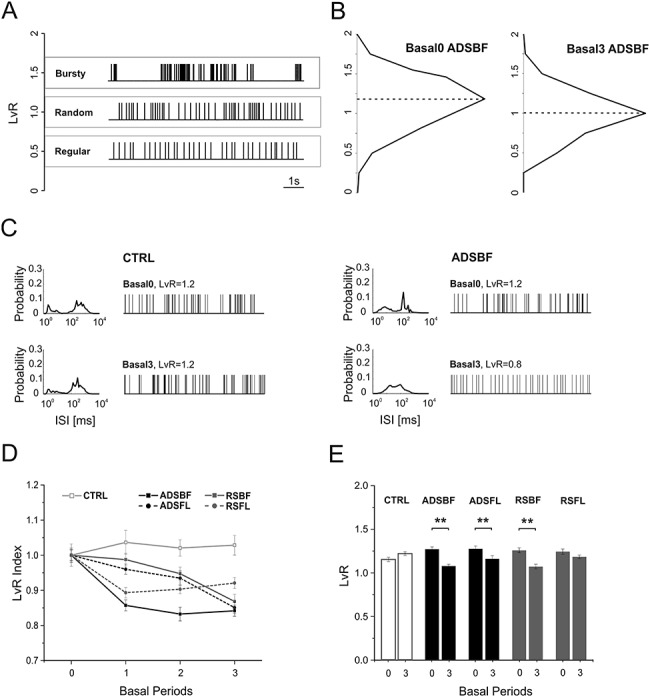
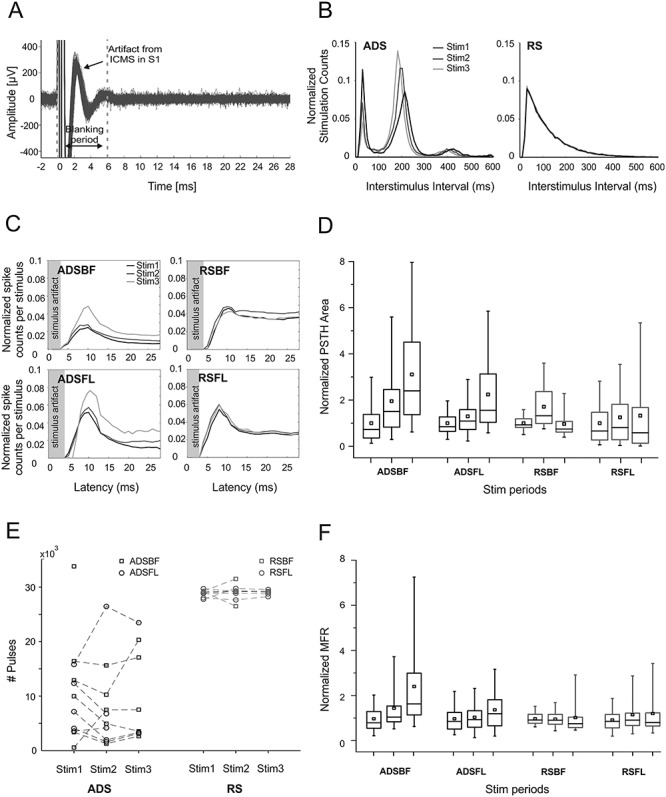
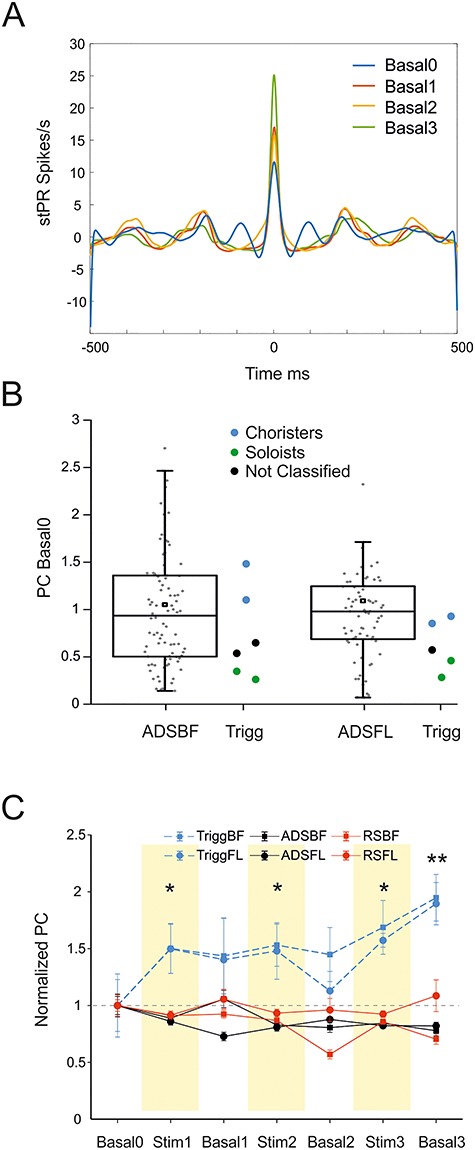
Intracortical microstimulation can be used successfully to modulate neuronal activity. Activity-dependent stimulation (ADS), in which action potentials recorded extracellularly from a single neuron are used to trigger stimulation at another cortical location (closed-loop), is an effective treatment for behavioral recovery after brain lesion, but the related neurophysiological changes are still not clear. Here, we investigated the ability of ADS and random stimulation (RS) to alter firing patterns of distant cortical locations. We recorded 591 neuronal units from 23 Long-Evan healthy anesthetized rats. Stimulation was delivered to either forelimb or barrel field somatosensory cortex, using either RS or ADS triggered from spikes recorded in the rostral forelimb area (RFA). Both RS and ADS stimulation protocols rapidly altered spike firing within RFA compared with no stimulation. We observed increase in firing rates and change of spike patterns. ADS was more effective than RS in increasing evoked spikes during the stimulation periods, by producing a reliable, progressive increase in stimulus-related activity over time and an increased coupling of the trigger channel with the network. These results are critical for understanding the efficacy of closed-loop electrical microstimulation protocols in altering activity patterns in interconnected brain networks, thus modulating cortical state and functional connectivity.
Keywords: anesthesia; electrical stimulation; forelimb; motor cortex; neuronal plasticity; neurons; neurophysiology; rats; somatosensory cortex.
© The Author(s) 2019. Published by Oxford University Press. All rights reserved. For permissions, please e-mail: journals.permission@oup.com.
Figures
Similar articles
-
Entrainment of Network Activity by Closed-Loop Microstimulation in Healthy Ambulatory Rats.Cereb Cortex. 2021 Oct 1;31(11):5042-5055. doi: 10.1093/cercor/bhab140. Cereb Cortex. 2021. PMID: 34165137 Free PMC article.
-
Repetitive microstimulation in rat primary somatosensory cortex (SI) strengthens the connection between homotopic sites in the opposite SI and leads to expression of previously ineffective input from the ipsilateral forelimb.Brain Res. 2020 Apr 1;1732:146694. doi: 10.1016/j.brainres.2020.146694. Epub 2020 Feb 1. Brain Res. 2020. PMID: 32017899 Free PMC article.
-
The impact of closed-loop intracortical stimulation on neural activity in brain-injured, anesthetized animals.Bioelectron Med. 2022 Feb 28;8(1):4. doi: 10.1186/s42234-022-00086-y. Bioelectron Med. 2022. PMID: 35220964 Free PMC article.
-
Stimulus-driven changes in sensorimotor behavior and neuronal functional connectivity application to brain-machine interfaces and neurorehabilitation.Prog Brain Res. 2011;192:83-102. doi: 10.1016/B978-0-444-53355-5.00006-3. Prog Brain Res. 2011. PMID: 21763520 Review.
-
Neural hijacking: action of high-frequency electrical stimulation on cortical circuits.Neuroscientist. 2013 Oct;19(5):434-41. doi: 10.1177/1073858412458368. Epub 2012 Sep 10. Neuroscientist. 2013. PMID: 22968640 Free PMC article. Review.
Cited by
-
Neuromorphic-Based Neuroprostheses for Brain Rewiring: State-of-the-Art and Perspectives in Neuroengineering.Brain Sci. 2022 Nov 19;12(11):1578. doi: 10.3390/brainsci12111578. Brain Sci. 2022. PMID: 36421904 Free PMC article. Review.
-
Injecting Information into the Mammalian Cortex: Progress, Challenges, and Promise.Neuroscientist. 2021 Apr;27(2):129-142. doi: 10.1177/1073858420936253. Epub 2020 Jul 10. Neuroscientist. 2021. PMID: 32648527 Free PMC article. Review.
-
Personalized strategies of neurostimulation: from static biomarkers to dynamic closed-loop assessment of neural function.Front Neurosci. 2024 Mar 7;18:1363128. doi: 10.3389/fnins.2024.1363128. eCollection 2024. Front Neurosci. 2024. PMID: 38516316 Free PMC article. Review.
-
Mapping of subthalamic nucleus using microelectrode recordings during deep brain stimulation.Sci Rep. 2020 Nov 6;10(1):19241. doi: 10.1038/s41598-020-74196-5. Sci Rep. 2020. PMID: 33159098 Free PMC article. Clinical Trial.
-
Activity dependent stimulation increases synaptic efficacy in spared pathways in an anesthetized rat model of spinal cord contusion injury.Restor Neurol Neurosci. 2022;40(1):17-33. doi: 10.3233/RNN-211214. Restor Neurol Neurosci. 2022. PMID: 35213336 Free PMC article.
References
-
- Anderson VC, Burchiel KJ, Hogarth P, Favre J, Hammerstad JP. 2005. Pallidal vs subthalamic nucleus deep brain stimulation in Parkinson disease. Arch Neurol. 62(4):554–560. - PubMed
-
- Berg J, Dammann J III, Tenore F, Tabot G, Boback J, Manfredi L, Peterson M, Katyal K, Johannes M, Makhlin A. 2013. Behavioral demonstration of a somatosensory neuroprosthesis. IEEE Trans Neural Syst Rehabil Eng. 21(3):500–507. - PubMed
-
- Blatt M, Wiseman S, Domany E. 1996. Superparamagnetic clustering of data. Phys Rev Lett. 76(18):3251. - PubMed
Publication types
MeSH terms
Grants and funding
LinkOut - more resources
Full Text Sources
