. 2020 Feb 28;48(4):1905-1924.
doi: 10.1093/nar/gkz1167.

Strong suppression of gene conversion with increasing DNA double-strand break load delimited by 53BP1 and RAD52

Affiliations

Strong suppression of gene conversion with increasing DNA double-strand break load delimited by 53BP1 and RAD52

Emil Mladenov et al. Nucleic Acids Res. .

Abstract

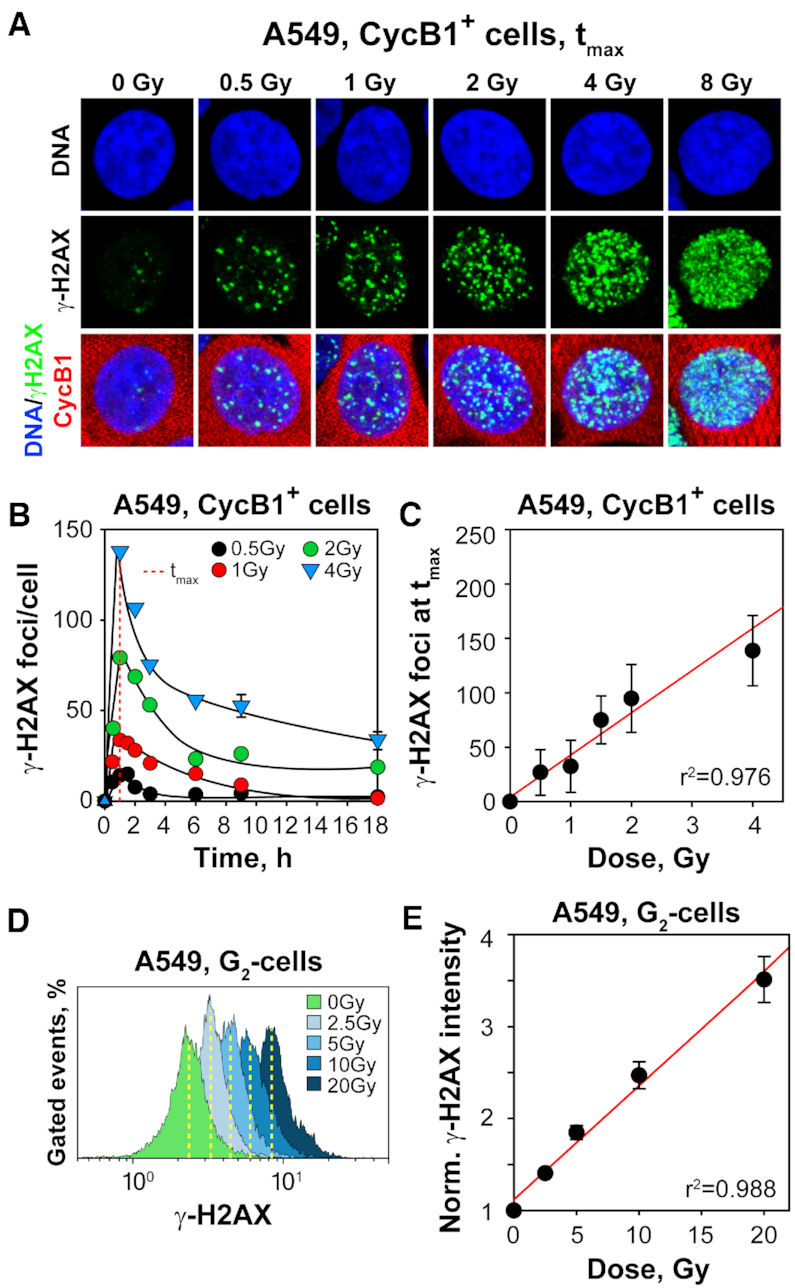
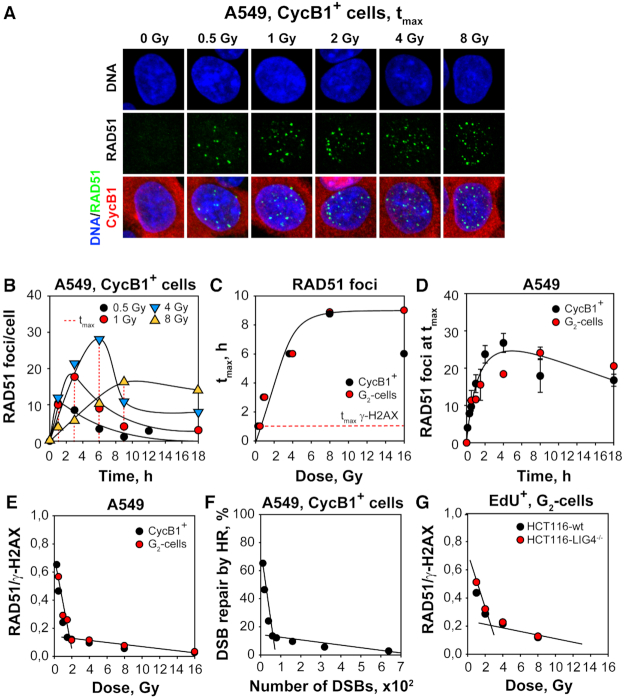
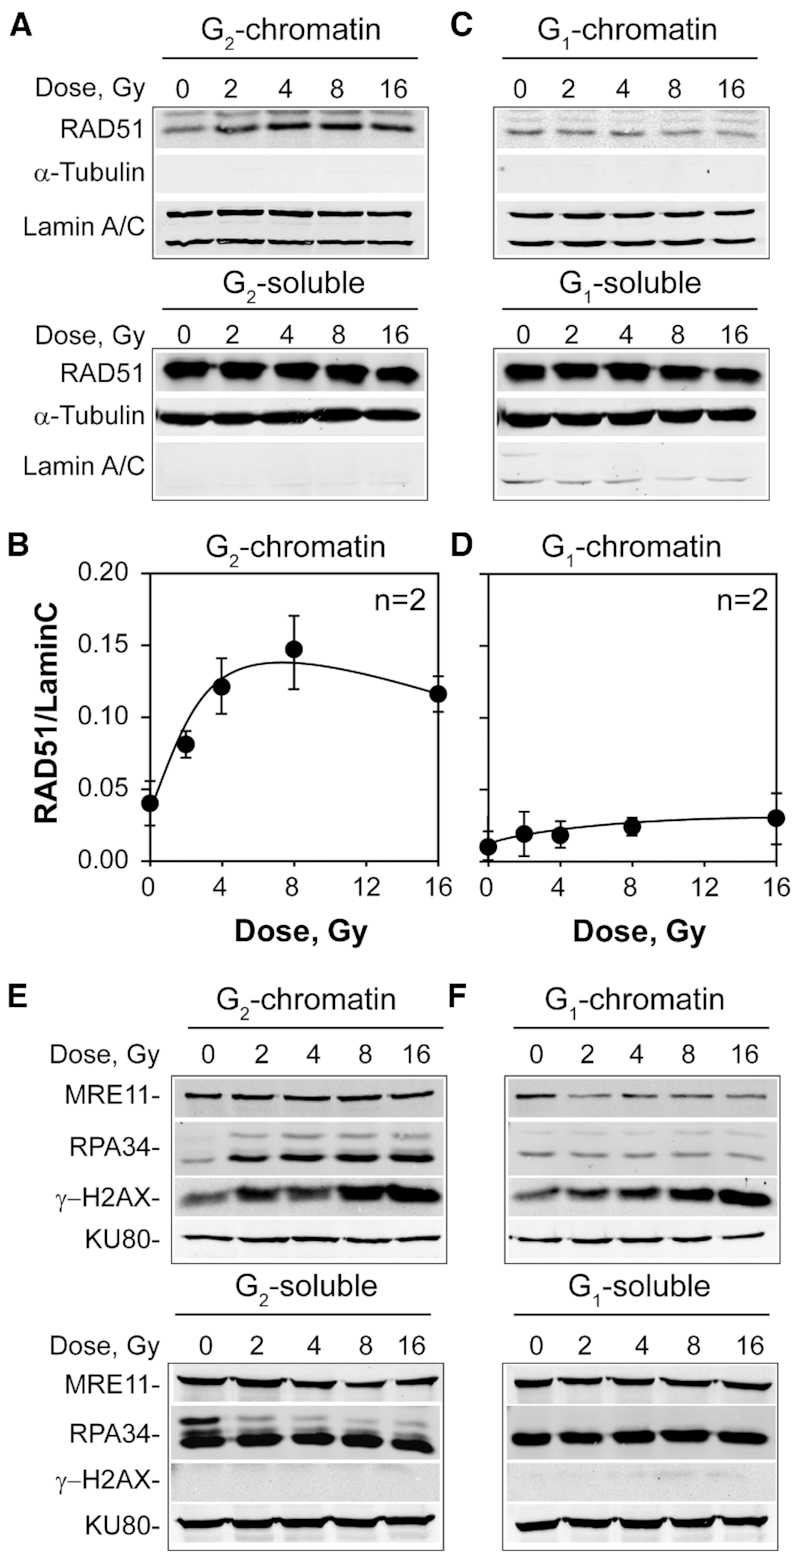
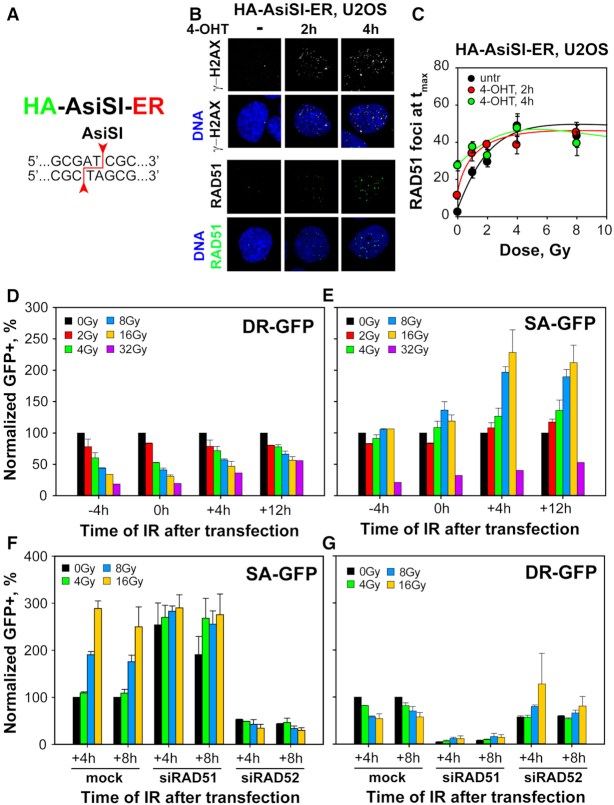
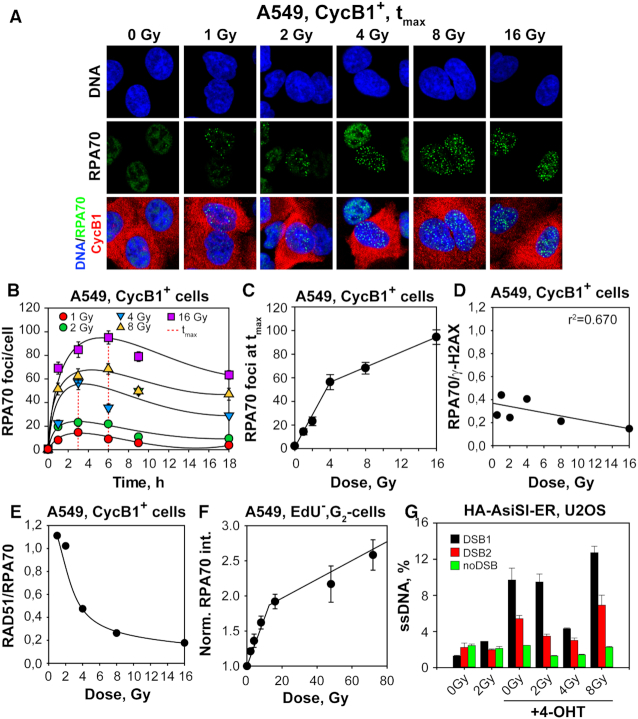
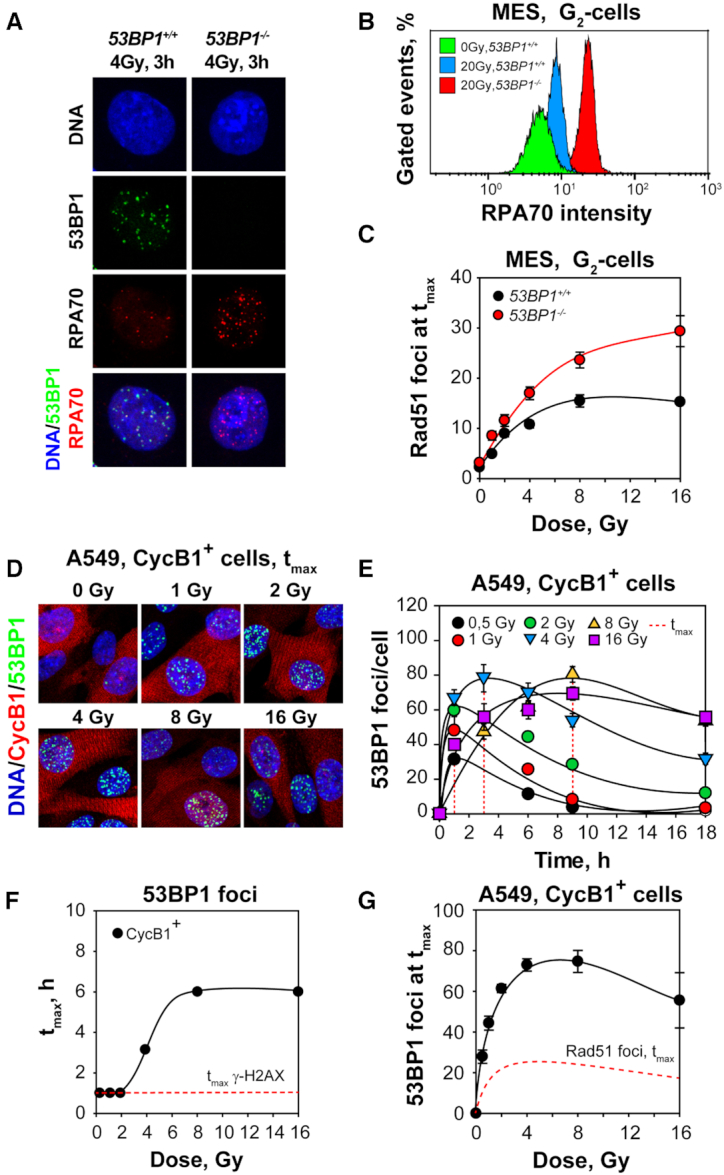
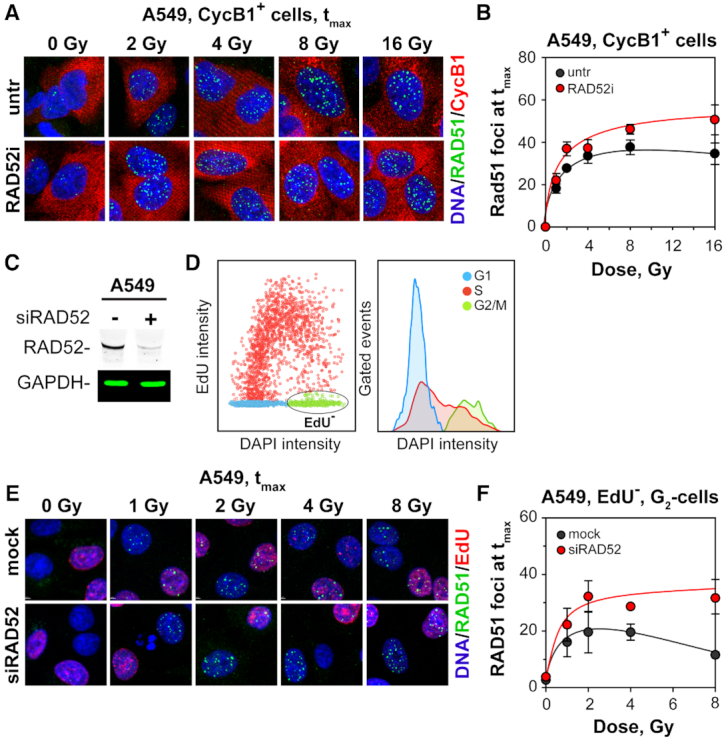
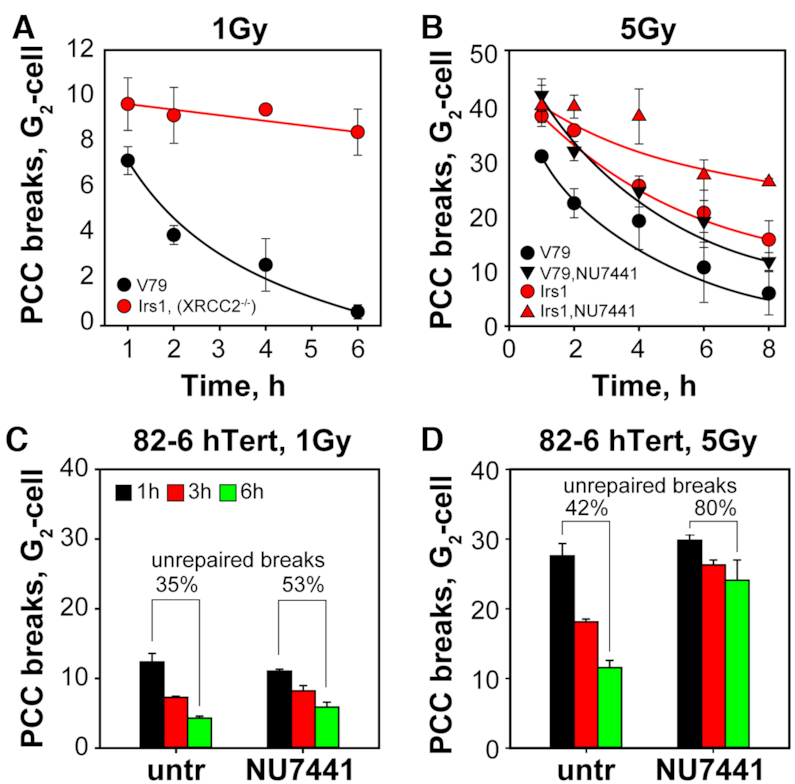
In vertebrates, genomic DNA double-strand breaks (DSBs) are removed by non-homologous end-joining processes: classical non-homologous end-joining (c-NHEJ) and alternative end-joining (alt-EJ); or by homology-dependent processes: gene-conversion (GC) and single-strand annealing (SSA). Surprisingly, these repair pathways are not real alternative options restoring genome integrity with equal efficiency, but show instead striking differences in speed, accuracy and cell-cycle-phase dependence. As a consequence, engagement of one pathway may be associated with processing-risks for the genome absent from another pathway. Characterization of engagement-parameters and their consequences is, therefore, essential for understanding effects on the genome of DSB-inducing agents, such as ionizing-radiation (IR). Here, by addressing pathway selection in G2-phase, we discover regulatory confinements in GC with consequences for SSA- and c-NHEJ-engagement. We show pronounced suppression of GC with increasing DSB-load that is not due to RAD51 availability and which is delimited but not defined by 53BP1 and RAD52. Strikingly, at low DSB-loads, GC repairs ∼50% of DSBs, whereas at high DSB-loads its contribution is undetectable. Notably, with increasing DSB-load and the associated suppression of GC, SSA gains ground, while alt-EJ is suppressed. These observations explain earlier, apparently contradictory results and advance our understanding of logic and mechanisms underpinning the wiring between DSB repair pathways.


Figures

Figure 1.
Figure 1.
γ-H2AX foci formation increases linearly with increasing IR dose in G2-phase A549 cells. (A) Maximum intensity projection (MIP) images of γ-H2AX foci (green) at tmax (1h) in G2-phase, A549 cells (CycB1+; red), counterstained with DAPI (blue) after exposure to the indicated IR doses. (B) Kinetics of γ-H2AX foci formation and decay in cells exposed to 0.5, 1, 2 and 4 Gy. The dashed red line indicates the time point at which foci numbers reach maximum (tmax) at indicated IR doses. (C) Numbers of γ-H2AX foci at tmax as a function of IR dose. The red line has been calculated by linear regression through the data points. (D) Representative flow cytometry histograms of γ-H2AX intensity (1 h) as a function of IR dose, specifically for G2-phase cells selected by propidium iodide staining; Supplementary Figure S2C depicts the gates applied. (E) Normalized, arithmetic mean of γ-H2AX signal intensity as a function of IR dose. Normalization was carried out by dividing the mean signal intensity measured in irradiated cells by that measured in non-irradiated cells. Data points represents the mean and standard deviation calculated from three independent experiments.
Figure 2.
Figure 2.
The contribution of GC to DSB processing decreases with increasing IR dose in G2-phase cells. (A) MIP images of RAD51 foci (green) at tmax in G2-phase, A549 cells (CycB1+, red). Other details as in Figure 1A. (B) Kinetics of RAD51 foci formation and decay in cells exposed to 0.5, 1, 4 and 8 Gy. The dashed red lines indicate the time points at which RAD51 foci reach maximum (tmax). (C) Dependence of tmax as defined in (B) on IR dose; the graph also includes results obtained in similar experiments carried out with centrifugal elutriation G2-enriched cells (red circles). The red dashed line traces tmax for γ-H2AX foci formation as shown in Figure 1B. (D) RAD51 foci numbers at tmax as a function of IR dose for CycB1+ A549 cells. Red symbols represent results obtained in similar experiments with centrifugal elutriation G2-enriched A549 cells. (E) Ratio of RAD51 to γ-H2AX foci as a function of IR dose in G2-phase irradiated cells. The value of this ratio reflects the proportion of IR-induced DSBs that are processed by GC at each IR dose. Results are shown for G2-phase, CycB1+ cells (black circles), as well as results obtained with centrifugal elutriation enriched G2-cells (red circles). (F) Results as in (E) for CycB1+ cells plotted as a function of DSB-load. For the calculation of these values, we assumed that 1 Gy of IR generates 40 DSBs in a G2-irradiated A549 cell. (G) Results showing RAD51 to γ-H2AX foci ratio as a function of IR dose in G2-phase irradiated HCT116-wt and HCT116 LIG4−/− deficient cells (n = 2). Data points represent means and standard deviations from three independent determinations.
Figure 3.
Figure 3.
Suppression of GC at high IR doses cannot be attributed to limitations in the RAD51 protein pool. (A) Western blot analysis of RAD51 protein distribution in soluble and chromatin-bound fractions as a function of IR dose in A549 cells enriched in G2-phase by centrifugal elutriation. Lamin A/C and α-Tubulin are diagnostic of chromatin-bound and soluble fractions, respectively and serve also as loading controls. (B) Densitometry analysis of RAD51 band intensity shown in (A). Plotted is the ratio of RAD51 to Lamin signal as a function of IR dose. Data points represent average values and standard deviations from two independent determinations. (C) As in (A) for centrifugal elutriation enriched G1-cells. (D) As in (B) for the results shown in (C). (E) Fractionation analysis as in (A) for MRE11, RPA34, γ-H2AX and KU80 proteins. (F) As in (E) for G1-enriched cells.
Figure 4.
Figure 4.
Increased DSB-load suppresses RAD51 foci formation and promotes SSA. (A) HA-AsiSI-ER, U2OS cells express a chimeric form of hemagglutinin (HA)-tagged, AsiSI nuclease fused to estrogen receptor (ER), which upon administration of tamoxifen (4-OHT) is translocated from the cytoplasm to the nucleus, generating DSBs at sites with the indicated 8 bp recognition sequence that is present ∼800 times in the human genome. (B) MIP images of γ-H2AX and RAD51 foci at different times after administration of 4-OHT. (C) Results as in Figure 2D for HA-AsiSI-ER, U2OS cells treated for the indicated periods of time with 4-OHT and exposed to increasing IR doses. Specific analysis in G2-phase was achieved by selecting CycB1+ cells. (D) Effect of IR on the induction of GFP+ cells in the DR-GFP, U2OS cell line reporting GC events 24h after transfection with the I-SceI expression plasmid. Plotted is the normalized number of GFP+ cells after exposure to the indicated doses of IR at the indicated times, before or after transfection. Values obtained with non-irradiated cells were used as basis in the normalization. (E) As in (D) for SA-GFP, U2OS cells reporting SSA events. (F) Effect of RAD51 and RAD52 knockdown on SSA. Normalization is always against the corresponding non-irradiated cells, and in the case of knockdowns against mock transfected cells. (G) As in (F) for DR-GFP, U2OS cells. Data represent means and standard deviations of at least two independent experiments. A detailed statistical analysis of the results shown here is presented in Supplementary Table S1 (Supplementary Table S1).
Figure 5.
Figure 5.
GC suppression with increasing IR dose is not mediated by suppression of DNA end resection. (A) MIP images of RPA70 foci formation (green) at tmax in CycB1+, G2-phase A549 cells (red). Other details as in Figure 1A. (B) Kinetics of RPA70 foci formation and decay in CycB1+ cells exposed to 1, 2, 4, 8 and 16 Gy. The dashed red lines indicate the time points at which RPA70 foci reach maximum (tmax). (C) RPA70 foci numbers at tmax as a function of IR dose for CycB1+ cells. The lines represent bi-phasic linear regressions. (D) Ratio of RPA70 to γ-H2AX foci as a function of IR dose in CycB1+ A549 cells. The value of this ratio reflects the proportion of IR-induced DSBs that are resected at each IR dose. (E) Ratio of RAD51 to RPA70 foci as a function of IR dose in CycB1+, G2-phase A549 cells. The value of this ratio reflects the proportion of resected DSBs that are processed by GC at each IR dose. (F) DNA end resection analysis by flow cytometry. Plotted is the normalized RPA70 signal intensity measured in EdU, G2-phase cells as outlined in Supplementary Figure S8. Normalization is carried out against the signal measured in non-irradiated cells. (G) DNA end resection analysis at specific DSBs (DSB1 and DSB2), generated in HA-AsiSI-ER, U2OS cells, by AsiSI nuclease. Cells are processed for analysis 4h after administration of 4-OHT and irradiation with 2, 4 and 8 Gy. DNA end resection at DSB1 and DSB2 at non-induced condition, as well as resection at genomic location where no AsiSI recognition sequence is present (noDSB), serve as negative control. Results are generated from two independent qPCR runs using DNA templates from one experiment. Data points represent the mean and standard deviations from at least two independent determinations unless indicated otherwise.
Figure 6.
Figure 6.
53BP1 delineates the plateau of RAD51 foci at high IR doses. (A) Representative MIP images of 53BP1 and RPA70 foci in G2-phase-enriched populations of 53BP1+/+ and 53BP1/ MES cells obtained by centrifugal elutriation. (B) Bivariate flow cytometry analysis of RPA70 signal intensity in G2-phase, 53BP1 proficient and deficient MES cells exposed to 20 Gy and analyzed 3 h later. (C) Results as in Figure 2D for 53BP1 proficient and deficient, centrifugal elutriation, G2-enriched MES cells, exposed to increasing IR doses. (D) MIP images of 53BP1 foci scored in CycB1+, A549 cells. (E) Kinetics of formation and decay of 53BP1 foci in cells exposed to 0.5, 1, 2, 4, 8, and 16 Gy. The dashed red lines indicate the time points at which 53BP1 foci reach maximum (tmax). (F) Dependence of tmax on IR dose as shown in (E). The red dashed line traces tmax for γ-H2AX foci formation as determined in Figure 1B. (G) 53BP1 foci at tmax as a function of IR dose for CycB1+ cells. The dashed line traces the results obtained for RAD51 foci formation under similar conditions and shown in Figure 2D. Data points represent mean and standard deviation from three independent experiments.
Figure 7.
Figure 7.
Suppression of SSA partly restores GC at high IR doses. (A) MIP images of RAD51 foci in CycB1+, A549 cells treated or not with 10 μM of RAD52-specific inhibitor, 6-OH-DOPA (RAD52i). (B) RAD51 foci numbers at tmax as a function of IR dose for CycB1+ cells. (C) Western blot analysis showing RAD52 knockdown in A549 cells. (D) Dot and histogram plots showing the gates used to select cells for IF analysis after Rad52 knockdown. EdU cells in G2-phase are selected for analysis of RAD51 foci formation (ellipse in left panel). (E) MIP images of RAD51 foci formation at tmax in mock transfected and in siRAD52 transfected A549 cells. (F) As in (B) for A549 cells after RAD52 knockdown. Data points represent mean and standard deviation from two independent experiments.
Figure 8.
Figure 8.
Switch from GC to other pathways with increasing IR dose during processing of chromosome breaks in the G2-phase of the cell cycle. (A) Premature chromosome condensation (PCC) analysis of chromatid break repair in wild-type, V79 and GC deficient irs1 (XRCC2 mutant) Chinese hamster cells. Approximately 50–100 PCCs are analyzed at each time point after exposure to 1 Gy. The methodology used for PCC allows analysis of chromatid break repair specifically in G2-phase. To prevent S-phase cells from entering G2-phase, cells are incubated post irradiation with aphidicolin. This ensures that only cells irradiated in G2-phase are included in the analysis. (B) As in (A) for cells exposed to 5 Gy. In this set the effect of 10 μM NU7441, a specific DNA-PKcs inhibitor, is also analyzed. (C) PCC analysis of chromatid break repair in 82-6 hTert cells exposed to 1 Gy and treated or not with NU7441. Approximately 50–100 metaphases are analyzed at each time point. (D) As in (C) for cells exposed to 5 Gy. Data points represent the mean and standard deviation from three independent experiments.

Similar articles

Cited by

References

    1. Schipler A., Iliakis G.. DNA double-strand-break complexity levels and their possible contributions to the probability for error-prone processing and repair pathway choice. Nucleic Acids Res. 2013; 41:7589–7605. - PMC - PubMed
    1. Jackson S.P., Bartek J.. The DNA-damage response in human biology and disease. Nature. 2009; 461:1071–1078. - PMC - PubMed
    1. Bunting S.F., Nussenzweig A.. End-joining, translocations and cancer. Nat. Rev. Cancer. 2013; 13:443–454. - PMC - PubMed
    1. Hustedt N., Durocher D.. The control of DNA repair by the cell cycle. Nat. Cell Biol. 2017; 19:1–9. - PubMed
    1. Rehani M.M., Vano E.. Medical radiation protection in next decade. Radiat. Prot. Dosim. 2011; 147:52–53. - PubMed

Publication types

MeSH terms

Substances