. 2020 Apr;102(4):811-820.
doi: 10.4269/ajtmh.19-0600.

A Robust Estimator of Malaria Incidence from Routine Health Facility Data

Affiliations

A Robust Estimator of Malaria Incidence from Routine Health Facility Data

Julie Thwing et al. Am J Trop Med Hyg. 2020 Apr.

Abstract

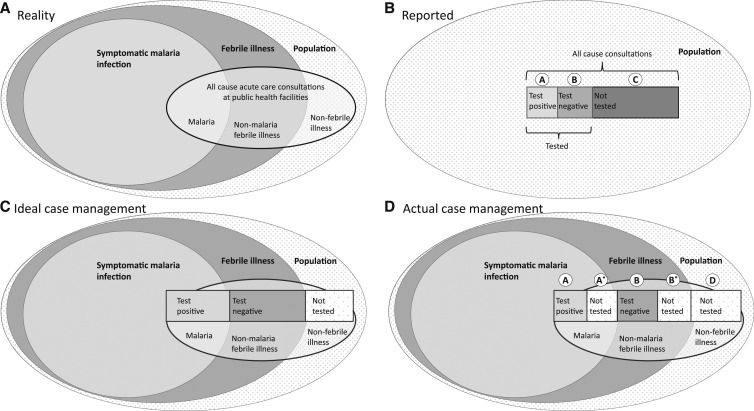
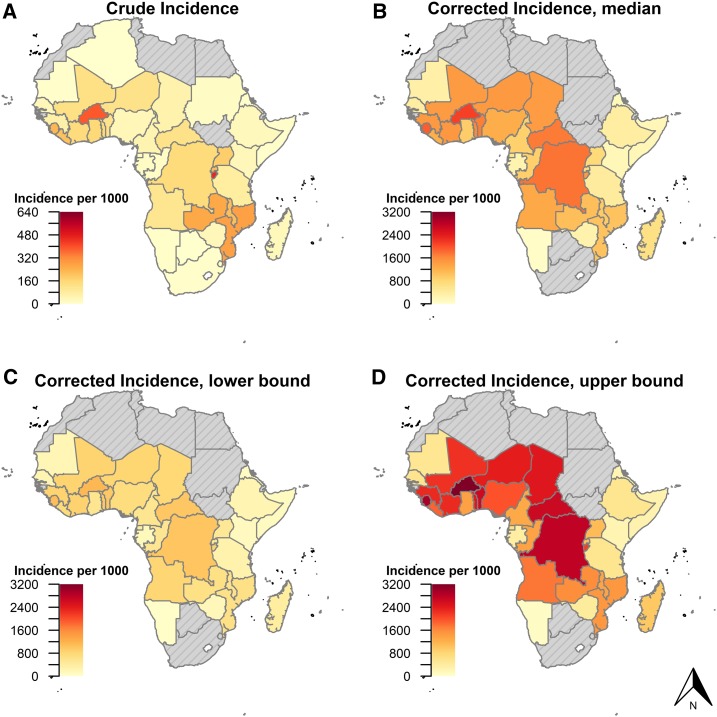
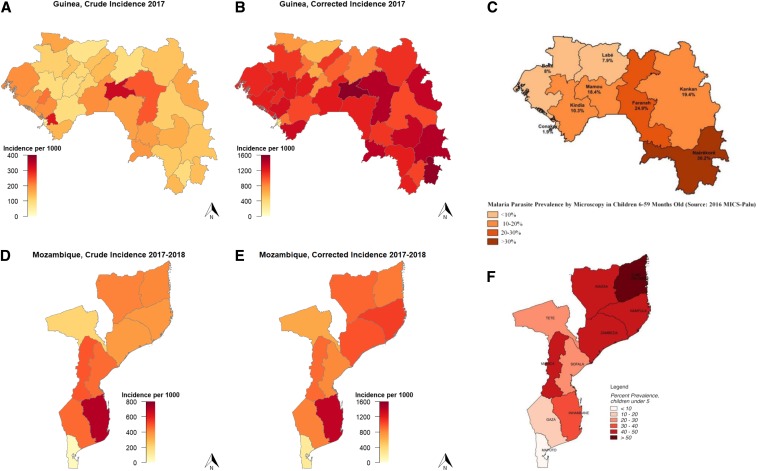
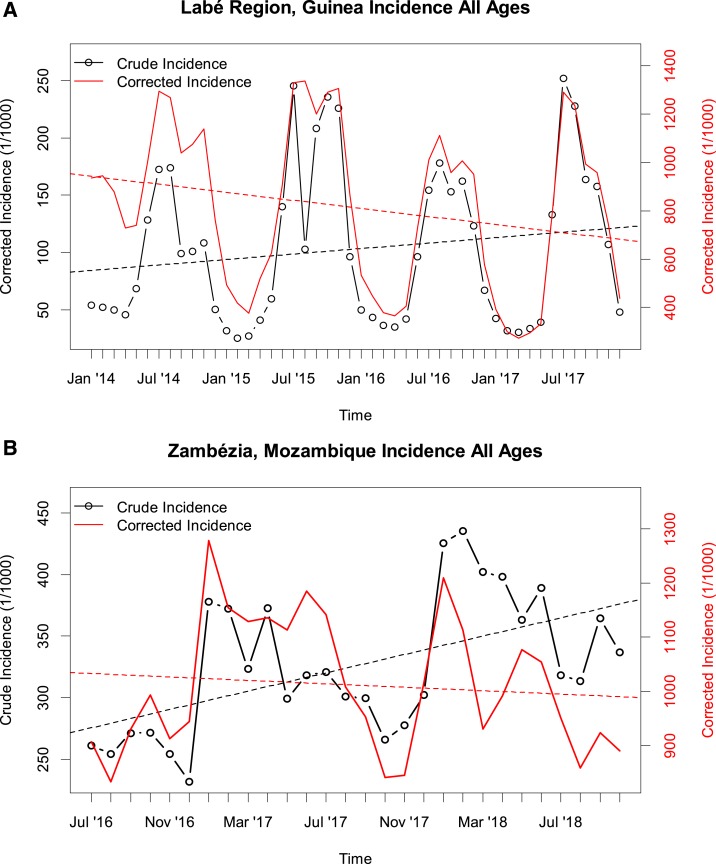
Routine incident malaria case data have become a pillar of malaria surveillance in sub-Saharan Africa. These data provide granular, timely information to track malaria burden. However, incidence data are sensitive to changes in care seeking rates, rates of testing of suspect cases, and reporting completeness. Based on a set of assumptions, we derived a simple algebraic formula to convert crude incidence rates to a corrected estimation of incidence, adjusting for biases in variable and suboptimal rates of care seeking, testing of suspect cases, and reporting completeness. We applied the correction to routine incidence data from Guinea and Mozambique, and aggregate data for sub-Saharan African countries from the World Malaria Report. We calculated continent-wide needs for malaria tests and treatments, assuming universal testing but current care seeking rates. Countries in southern and eastern Africa reporting recent increases in malaria incidence generally had lower overall corrected incidence than countries in Central and West Africa. Under current care seeking rates, the unmet need for malaria tests was estimated to be 160 million (M) (interquartile range [IQR]: 139-188) and for malaria treatments to be 37 M (IQR: 29-51). Maps of corrected incidence were more consistent with maps of community survey prevalence than was crude incidence in Guinea and Mozambique. Crude malaria incidence rates need to be interpreted in the context of suboptimal testing and care seeking rates, which vary over space and time. Adjusting for these factors can provide insight into the spatiotemporal trends of malaria burden.


Conflict of interest statement

Disclaimer: The findings and conclusions in this report are those of the authors and do not necessarily represent the official position of the CDC.

Disclosure: Excel tools for applying the robust estimator are freely available at github.com/MateuszPlucinski/Corrected-Incidence.

Figures

Figure 1.
Figure 1.
Schematic of process of inferring true malaria burden from routine data, showing the true universe of malaria cases (A), the subset that are reported through data information systems (B), what would be reported under ideal case management practices (C), and what is reported under actual case management practices (D).
Figure 2.
Figure 2.
Crude (A) and corrected (B) malaria incidence rates, as reported and estimated from routine health information data submitted by countries to the World Malaria Report, 2016. (C and D) show the lower and upper bounds of the corrected estimates. Note the difference in scales between crude and corrected maps.
Figure 3.
Figure 3.
Crude (A and D) and corrected (B and E) malaria incidence rates, as reported and estimated from routine health information data from Guinea and Mozambique. (C and F) show the parasite prevalence in children younger than 5 years for the most recent household survey in each country., Note the difference in axis scales between the crude and corrected incidence and difference in aggregation level for Guinea, where incidence data are by health district and prevalence data are by region.
Figure 4.
Figure 4.
Longitudinal trends in crude (black) and corrected (red) malaria incidence in Labé Region, Guinea, (A) and Zambézia Province, Mozambique (B). Note the difference in axis scales between the crude and corrected incidence. This figure appears in color at www.ajtmh.org.

References

    1. World Health Organization , 2018. World Malaria Report 2018. Geneva, Switzerland: WHO.
    1. Plucinski MM, Guilavogui T, Camara A, Ndiop M, Cisse M, Painter J, Thwing J, 2018. How far are we from reaching universal malaria testing of all fever cases? Am J Trop Med Hyg 99: 670–679. - PMC - PubMed
    1. Rowe AK, Onikpo F, Lama M, Cokou F, Deming MS, 2001. Management of childhood illness at health facilities in Benin: problems and their causes. Am J Public Health 91: 1625–1635. - PMC - PubMed
    1. Weber M, Mulholland EK, Jaffar S, Troedsson H, Gove S, Greenwood BM, 1997. Evaluation of an algorithm for the integrated management of childhood illness in an area with seasonal malaria in the Gambia. Bull World Health Organ 75 (Suppl 1): 25–32. - PMC - PubMed
    1. Rowe AK, Ponce de León GF, Mihigo J, Santelli ACF, Miller NP, Van-Dúnem P, 2009. Quality of malaria case management at outpatient health facilities in Angola. Malar J 8: 275. - PMC - PubMed