. 2020 Jun;68(6):1131-1147.
doi: 10.1002/glia.23764. Epub 2019 Dec 13.

Deletion of astrocytic BMAL1 results in metabolic imbalance and shorter lifespan in mice

Affiliations

Deletion of astrocytic BMAL1 results in metabolic imbalance and shorter lifespan in mice

Olga Barca-Mayo et al. Glia. 2020 Jun.

Abstract

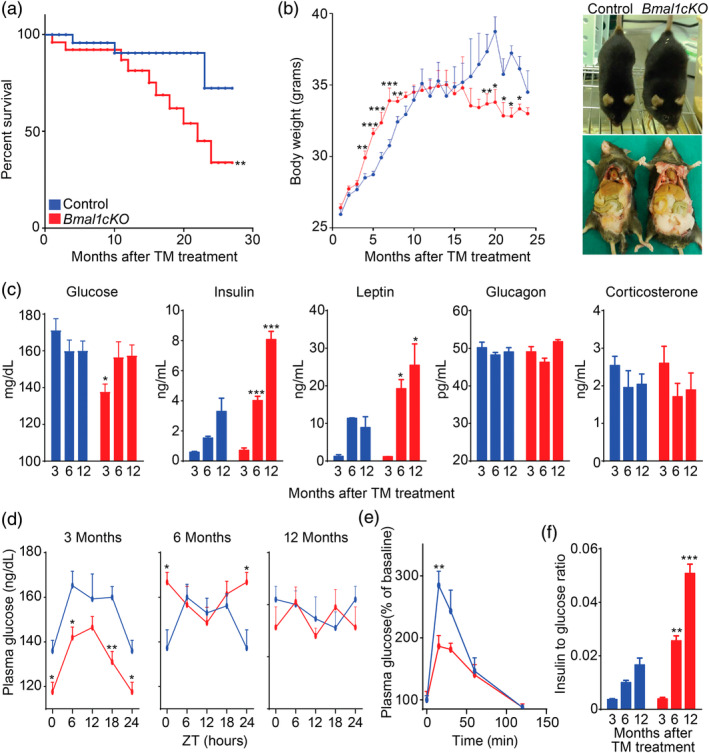
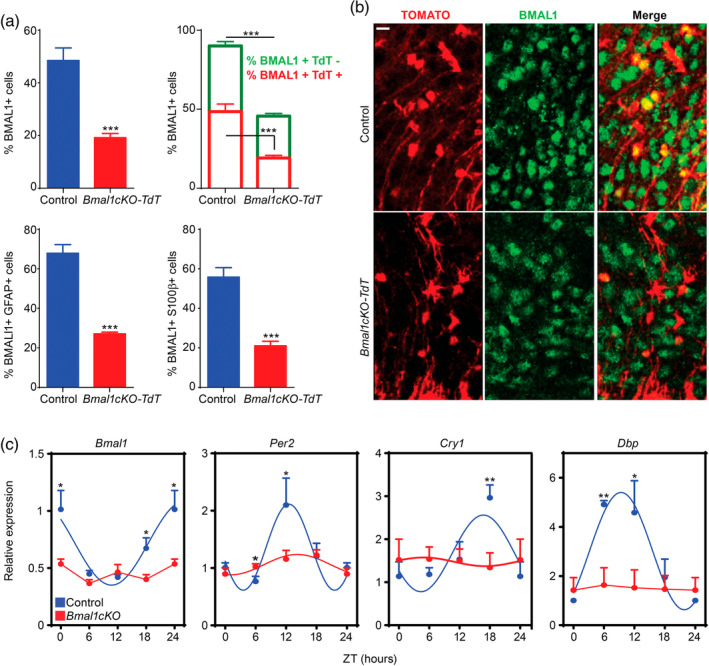
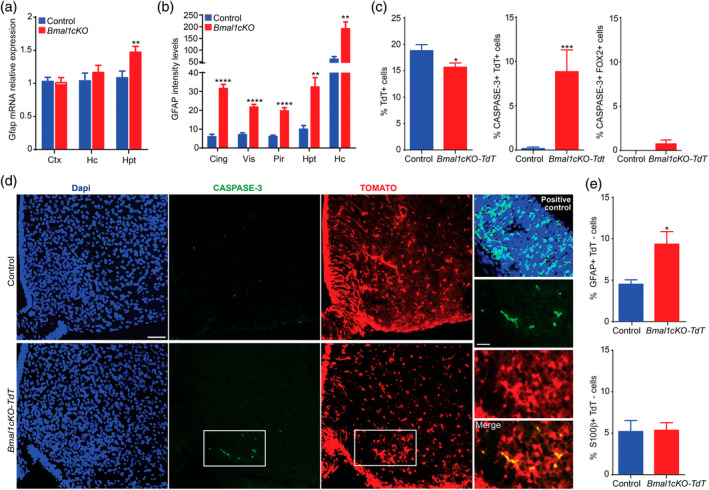
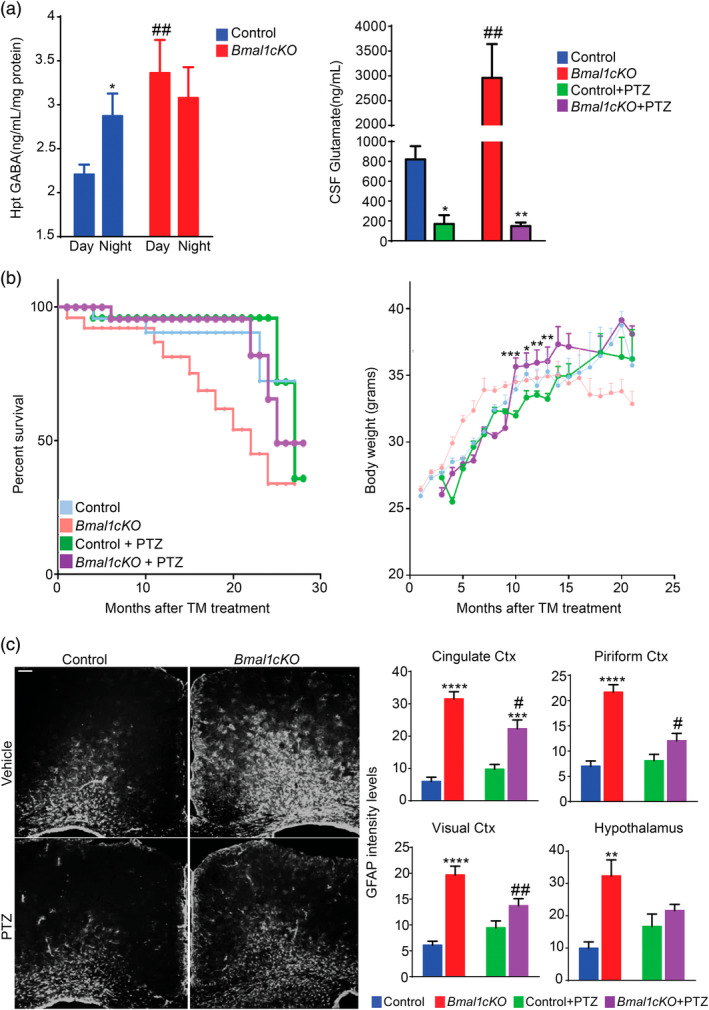
Disruption of the circadian cycle is strongly associated with metabolic imbalance and reduced longevity in humans. Also, rodent models of circadian arrhythmia, such as the constitutive knockout of the clock gene Bmal1, leads to metabolic disturbances and early death. Although astrocyte clock regulates molecular and behavioral circadian rhythms, its involvement in the regulation of energy balance and lifespan is unknown. Here, we show that astrocyte-specific deletion of Bmal1 is sufficient to alter energy balance, glucose homeostasis, and reduce lifespan. Mutant animals displayed impaired hypothalamic molecular clock, age-dependent astrogliosis, apoptosis of hypothalamic astrocytes, and increased glutamate and GABA levels. Importantly, modulation of GABAA-receptor signaling completely restored glutamate levels, delayed the reactive gliosis as well as the metabolic phenotypes and expanded the lifespan of the mutants. Our results demonstrate that the astrocytic clock can influence many aspects of brain function and neurological disease and suggest astrocytes and GABAA receptor as pharmacological targets to prevent the metabolic dysfunctions and shortened lifespan associated with alterations of circadian rhythms.

Keywords: GABA signaling; astrocytes; circadian clock; glutamate; lifespan; metabolism.


Conflict of interest statement

The Authors declare that there is no conflict of interest.

Figures

Figure 1
Figure 1
Loss of Bmal1 in astrocytes leads to early death, altered body weight and glucose homeostasis. (a) Kaplan‐Meyer survival curve of control and Bmal1cKO mice (n  =  24 and n = 16, respectively, Log rank test, **p < .01). (b) Left panel, age‐dependent changes in body weight of control and Bmal1cKO males. Data are represented as mean ± SEM (n  =  18, paired t‐test, *p < .05, **p < .01, and ***p < .001 vs. control animals). Right panel, gross appearance of control and Bmal1cKO mice 4 months after TM treatment, showing increased fat mass in the mutants. (c) Blood glucose, insulin, leptin, glucagon, and corticosterone levels in control and Bmal1cKO mice at 3, 6, and 12 months after TM treatment (ZT6). Data are represented as mean ± SEM (n  =  8, paired t‐test, *p < .05 and ***p < .001 vs. control animals). (d) Blood glucose in control and Bmal1cKO animals after 3, 6, and 12 months of TM treatment. Data are represented as mean ± SEM (n  =  8, paired t‐test, *p < .05 and **p < .01 vs. control animals). (e) Glucose tolerance test in control and Bmal1cKO mice at 3 months after TM treatment performed at ZT10. Data are represented as mean ± SEM (n = 5–6, paired t‐test, **p < .01 vs. control animals). (f) Insulin to glucose ratio of control and Bmal1cKO animals at 3, 6, and 12 months of TM treatment (ZT6). Data are represented as mean ± SEM (n  =  5–6, paired t‐test, **p < .01 and ***p < .001 vs. control animals) [Color figure can be viewed at wileyonlinelibrary.com]
Figure 2
Figure 2
Bmal1cKO mice showed increased food intake with no alterations in the brain reward systems. (a) Daily food intake was determined in control and Bmal1cKO mice after 1, 2, 3, 6, and 12 months of TM treatment. Animals were maintained in 12 hr:12 hr light–dark cycles and fed ad libitum with a standard mouse chow. Data are represented as mean ± SEM (n = 8, paired t‐test, **p < .01 vs. control animals). (b) Activity waveforms for control (n = 8) and Bmal1cKO (n = 7) mice, 2 months after TM treatment, in 12 hr: 12 hr light–dark cycles. Activity counts are expressed as the average amount of activity in 5 min bins. Data plotted is given in ZT, such that ZT0 = lights on. The value expresses the means + SEM. (c) Food intake was determined in control and Bmal1cKO mice after 2 months of TM treatment. Animals were maintained in 12 hr:12 hr light–dark cycles and fed ad libitum with a standard mouse chow. Data are represented as mean ± SEM (n = 8, paired t‐test, *p < .05 vs. control animals). (d) Number of nose spokes performed by control and Bmal1cKO mice, 2 months after TM treatment, during fixed ratio (FR), and progressive ratio (PR) sessions in the operant conditioning test. Data are represented as mean ± SEM (n = 4 for controls and n = 11 for Bmal1cKOs). (e) Mean ± SEM breakpoints in control (n = 4) and Bmal1cKO (n = 11) mice, 2 months after TM treatment, in the operant conditioning test [Color figure can be viewed at wileyonlinelibrary.com]
Figure 3
Figure 3
BMAL1 deletion in astrocytes globally impairs the hypothalamic molecular clock. (a) Upper left panel, a reduction of BMAL1 positive cells was observed in the ARC nucleus of Bmal1cKO mice compared with control animals 2 months after TM treatment (Y‐axis represents the percentage of total BMAL1‐positive cells in the ARC nucleus). Data are represented as mean ± SEM (n = 4, paired t‐test, ***p < .001 vs. control animals). Upper right panel, a 60% reduction of BMAL1‐positive cells was observed in the population of Td‐TOMATO‐positive cells of Bmal1cKO compared with control animals (red, paired t‐test, ***p < .001 vs. control animals). A 36% reduction of BMAL1‐positive cells in the population of Td‐TOMATO‐negative cells was found in Bmal1cKO compared with control animals (green, paired t‐test ***p < .001 vs. control animals). Data are represented as mean ± SEM (n = 4). Percent of BMAL1‐positive cells was significantly reduced in GFAP (lower left panel) or S100β (lower right panel) positive astrocytes in the ARC nucleus of Bmal1cKOTd‐Tomato mice compared with control animals. Data are represented as mean ± SEM (n = 4, paired t‐test, ***p < .001 vs. control animals). (b) Representative micrographs of BMAL1 immunostaining in the ARC nucleus of control or Bmal1cKO‐Td‐Tomato animals. Scale bar, 25 μm. (c) Analysis of clock transcripts (Bmal1, Cry1, Per2 and BMAL1 target, Dbp) in the hypothalamus of control and Bmal1cKO mice after 2 months of TM treatment. Experimental data were cosine fitted. The ZT24 time point is the ZT0 time point, shown again. Data are represented as mean ± SEM (n = 5–6, paired t‐test, *p < .05 and **p < .01) [Color figure can be viewed at wileyonlinelibrary.com]
Figure 4
Figure 4
Bmal1cKO mice showed age‐dependent astrogliosis and apoptosis of hypothalamic astrocytes. (a) Gfap expression in cortex (Ctx), hippocampus (Hc) and hypothalamus (Hpt) of control and Bmal1cKO mice, 2 months after TM treatment. Data are represented as mean ± SEM (n = 5, paired t‐test, **p < .01). (b) Quantification of GFAP fluorescence intensity in cingulate (Cing), visual (Vis), piriform (Pir) cortex, Hpt and Hc of Bmal1cKOs, and controls, 4 months after TM treatment. Data are represented as mean ± SEM (n = 5, paired t‐test, **p < .01 and ****p < .0001 vs. controls). (c) Left panel, percentage of TOMATO‐positive cells in the ARC nucleus of control (Glast‐Cre‐Td‐Tomato) or Bmal1cKO‐Td‐Tomato animals, 2 months after TM treatment. Middle and right panel, percentage of active‐CASPASE 3 cells that co‐localized with TOMATO or FOX2 positive cells, respectively. Data are represented as mean ± SEM (n = 5, paired t‐test, *p < .05 and ***p < .001 vs. controls). (d) Representative micrographs of TOMATO and active CASPASE‐3 immunostaining in the ARC nucleus of control and Bmal1cKO‐Td‐Tomato mice 2 months after TM treatment. Scale bars, 50 and 25 μm in the higher magnification images. Cortex of Dgrc8 (DiGeorge Syndrome Critical Region Gene) knockout mice at embryonic day 13.5 was used as a positive control (right upper panel). (e) Percentage of GFAP (upper panel) or S100β (lower panel) positive cells that are TOMATO‐negative in the ARC nucleus of control and Bmal1cKO‐Td‐Tomato animals. Data are represented as mean ± SEM (n = 5, paired t‐test, *p < .05 vs. controls) [Color figure can be viewed at wileyonlinelibrary.com]
Figure 5
Figure 5
GABAA receptor antagonists delayed the aging and metabolic phenotype of Bmal1cKO mice. (a) Left panel, GABA levels in the hypothalamus of Bmal1cKOs and controls at day and night time, 2 months after TM treatment. Data are represented as mean ± SEM (n = 5, two‐way ANOVA, *p < .05 vs. daytime and ##p < .01 vs. controls). Right panel, CSF glutamate levels of naive or PTZ‐treated Bmal1cKO and control animals at ZT6. Data are represented as mean ± SEM (n = 5, two‐way ANOVA, *p < .05 and **p < .01 vs. naive animals; ##p < .01 vs. controls). (b) Left panel, Kaplan–Meyer survival curve of naive or PTZ‐treated control and Bmal1cKO mice. Right panel, age‐dependent changes in body weight of control and Bmal1cKO mice treated with PTZ. Data are represented as mean ± SEM (paired t‐test, *p < .05, **p < .01, and ***p < .001 vs. PTZ‐treated control animals). n  = 10– 12 for PTZ‐treated control and Bmal1cKO animals. (c) Left panel, representative micrographs of GFAP immunostaining in the cingulate cortex of naive or PTZ‐treated control and Bmal1cKO mice, 4 months after TM treatment. Scale bar, 100 μm. Right panel, quantification of fluorescence intensity of GFAP levels in cingulate, piriform, and visual cortex (Ctx) as well as in the hypothalamus of naive or PTZ‐treated Bmal1cKO and control animals. Data are represented as mean ± SEM (n = 5, two‐way ANOVA, **p < .01, ***p < .001 and ****p < .0001 vs. control animals and #p < .05 and ##p < .01 vs. naive mice) [Color figure can be viewed at wileyonlinelibrary.com]

References

    1. Balaban, R. S. , Nemoto, S. , & Finkel, T. (2005). Mitochondria, oxidants, and aging. Cell, 120(4), 483–495. 10.1016/j.cell.2005.02.001 - DOI - PubMed
    1. Baldwin, B. A. , Ebenezer, I. S. , & De La Riva, C. (1990). Effects of intracerebroventricular injection of muscimol or GABA on operant feeding in pigs. Physiology & Behavior, 48l(3), 417–421. 10.1016/0031-9384(90)90337-4 - DOI - PubMed
    1. Barca‐Mayo, O. , Berdondini, L. , & De Pietri Tonelli, D. (2019). Astrocytes and circadian rhythms: An emerging astrocyte‐neuron synergy in the timekeeping system In Di Benedetto B. (Ed.), Methods in molecular biology 1938 (1st ed., pp. 131–154). New York: Humana Press; 10.1007/978-1-4939-9068-9_10 - DOI - PubMed
    1. Barca‐Mayo, O. , Pons‐Espinal, M. , Follert, P. , Armirotti, A. , Berdondini, L. , & De Pietri Tonelli, D. (2017). Astrocyte deletion of Bmal1 alters daily locomotor activity and cognitive functions via GABA signaling. Nature Communications, 8, 14336 10.1038/ncomms14336 - DOI - PMC - PubMed
    1. Belgardt, B. , Okamura, T. , & Brüning, J. C. (2009). Hormone and glucose signaling in POMC and AgRP neurons. The Journal of Physiology, 587(Pt 22), 5305–5314. 10.1113/jphysiol.2009.179192 - DOI - PMC - PubMed

Publication types

Substances