. 2019 Dec;97(12):1711-1722.
doi: 10.1007/s00109-019-01857-y. Epub 2019 Dec 13.

Gene-environment regulatory circuits of right ventricular pathology in tetralogy of fallot

Collaborators, Affiliations

Gene-environment regulatory circuits of right ventricular pathology in tetralogy of fallot

Yan Zhao et al. J Mol Med (Berl). 2019 Dec.

Abstract

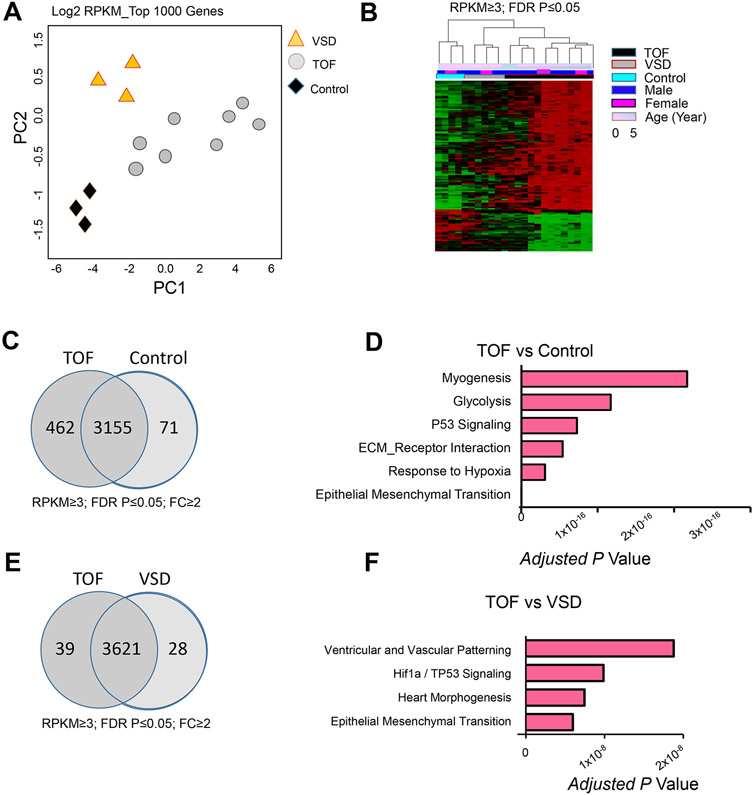
The phenotypic spectrum of congenital heart defects (CHDs) is contributed by both genetic and environmental factors. Their interactions are profoundly heterogeneous but may operate on common pathways as in the case of hypoxia signaling during postnatal heart development in the context of CHDs. Tetralogy of Fallot (TOF) is the most common cyanotic (hypoxemic) CHD. However, how the hypoxic environment contributes to TOF pathogenesis after birth is poorly understood. We performed Genome-wide transcriptome analysis on right ventricle outflow tract (RVOT) specimens from cyanotic and noncyanotic TOF. Co-expression network analysis identified gene modules specifically associated with clinical diagnosis and hypoxemia status in the TOF hearts. In particular, hypoxia-dependent induction of myocyte proliferation is associated with E2F1-mediated cell cycle regulation and repression of the WNT11-RB1 axis. Genes enriched in epithelial mesenchymal transition (EMT), fibrosis, and sarcomere were also repressed in cyanotic TOF patients. Importantly, transcription factor analysis of the hypoxia-regulated modules suggested CREB1 as a putative regulator of hypoxia/WNT11-RB1 circuit. The study provides a high-resolution landscape of transcriptome programming associated with TOF phenotypes and unveiled hypoxia-induced regulatory circuit in cyanotic TOF. Hypoxia-induced cardiomyocyte proliferation involves negative modulation of CREB1 activity upstream of the WNT11-RB1 axis. KEY MESSAGES: Genetic and environmental factors contribute to congenital heart defects (CHDs). How hypoxia contributes to Tetralogy of Fallot (TOF) pathogenesis after birth is unclear. Systems biology-based analysis revealed distinct molecular signature in CHDs. Gene expression modules specifically associated with cyanotic TOF were uncovered. Key regulatory circuits induced by hypoxia in TOF pathogenesis after birth were unveiled.

Keywords: Congenital heart defects; Genome; Hypoxia; Tetralogy of Fallot; Transcriptome.


Figures

Figure 1.
Figure 1.. Transcriptome Landscape of Right Ventricle Outflow Tract in Congenital Heart Defects.
A. Principal component analysis (PCA) result of top 1000 varied genes. PCA was conducted using R function prcomp. Top 1000 varied mRNAs (log2 RPKM) derived from 14 RNA-seq data sets [n= 8 Tetralogy of Fallot (TOF), 3 ventricular septal defect (VSD), and 3 control cases (heart transplant donors)] based on Tophat alignment results were used to generate PCAs. B. Differential gene expression (DGE) of TOF and control cases. Covariates are demarcated by color bars at the top according to age, gender, and diagnosis of compared pairs. Upregulated genes are shown in red and downregulated genes in green. The expression profiles are standardized. Transcripts from TOF and VSD formed distinct clusters suggesting disease specific transcriptome alterations. C, E. Pair wise comparison of DGE at fold change (FC) ≥2 in TOF vs control (C), and TOF vs VSD (E). D, F. Top GO terms enriched in DGE in TOF vs control (D), and TOF vs VSD (F) using Bonferroni-adjusted p value scale. RPKM, reads per kilobase per million mapped reads.
Figure 2.
Figure 2.. Distinct Molecular Signature of Right Ventricle Outflow Tract in Cyanotic Tetralogy of Fallot.
A. Representative Immunohistochemistry (IHC) staining for HIF1A in the right ventricle outflow tracts (RVOTs) from cyanotic TOF with baseline O2 saturation < 90% and noncyanotic TOF with baseline O2 saturation ≥ 95% demonstrates HIF1A nuclear stabilization in cyanotic TOF heart. HIF1A IHC in breast cancer was used as a positive control. Arrows indicate HIF1A positive cells. B. Expression profile of DGE in cyanotic and noncyanotic TOF cases normalized to control samples (RPKM≥3, CV≥0.2, FDR P Value ≤0.05]. Covariates are demarcated by color bars at the top according to disease status and O2 saturation level of TOF cases. Upregulated genes are shown in pink and downregulated genes are shown in blue. C. Schematic representation of HIF1A transcriptional machinery. D. RNA-seq derived quantitative expression analysis (RPKM) of HIF1A homeostasis genes, CITED2 and EP300, in RVOT of cyanotic and noncyanotic TOF cases. E. RNA-seq derived quantitative expression analysis (RPKM) of WNT related genes in RVOT of cyanotic and noncyanotic TOF cases. Error bars represent standard error of means (SEM). *P ≤0.05, **P≤0.01. Statistics (D, E): Two tailed Student’s t test; n= 3 cyanotic TOF, n=5 noncyanotic TOF.
Figure 3.
Figure 3.. Weighted Gene Co-expression Network Analysis (WGCNA) Reveals Disease-Specific Modules.
A. WGCNA dendrograms of RVOT mRNA transcriptome. Genes with mean RPKM ≥3 in at least one sample and CV ≥ 0.2 across samples (FDR P value ≤ 0.05) are included in this analysis. Genes are clustered based on the topological overlap (TO), a measure of connection strength. Using the R package, gene modules were constructed as groups of genes with highly similar co-expression relationships. Branches in the hierarchical clustering dendrograms correspond to these constructed gene modules. Color bars below the dendrograms display gene co-expression modules identified by WGCNA. Y-axis (height) represents module significance (correlation with external trait). B. Heat map of correlations between distinct mRNA module eigengenes (expression profile summary presented as the first principal component) sorted by average linkage hierarchical clustering with positive association in red and negative association in blue. C, D. Module plots of the TAN (C), and the DARKRED (D) modules displaying the top hub genes and top connections (up to 50 connections) associated with each hub gene.
Figure 4.
Figure 4.. Weighted Gene Co-expression Network Analysis (WGCNA) Reveals Hypoxemia-Associated Modules.
A. A correlation plot demonstrates the association between TOF module eigengenes and average oxygen saturation level (noncyanotic TOF: O2 Sat ≥ 95%, cyanotic TOF: O2 Sat <90%). B. Signed association of module eigengenes with disease phenotype, hypoxia status, and oxygen saturation levels for representative environment-specific, hypoxia-dependent modules, BLACK, SIENNA3, and LIGHTCYAN (Pearson’s correlation coefficient r≥0.6 and P value ≤0.05 between the module eigengene and O2 Sat level). C. Top GO terms enriched in representative environment-specific modules using Bonferroni-adjusted P value scale. Color codes of the modules are preserved. D. Module plots display the top hub genes and top connections (up to 50 connections) associated with each hub gene for representative environment-specific modules. E. Five representative transcription factors identified in environment-specific modules based on transcription factor family (TFF) analysis. F. Table summary of top GO terms enriched in transcription factors detected in cyanotic TOF modules using Gene Set Enrichment Analysis (GSEA) based TFF analysis.
Figure 5.
Figure 5.. Negative Modulation of CREB1 Activity May be Involved in Hypoxia-Induced Cardiomyocyte Proliferation, via Inhibiting the Wnt11/Rb1 Axis.
A. Transcription factor target (TFT) analysis reveals top candidate transcription regulators of the hypoxia-regulated modules. Numbers of predicted target genes of each TF were also presented. B. Representative confocal images depict pH3 positive neonatal rat ventricular myocytes (NRVMs) in normoxia and hypoxia conditions. C, D, E. Expression analysis (qRT-PCR) of Ki67 (C), Wnt11 (D), and Rb1 (E) in hypoxia-treated NRVMs compared to normoxia condition. *P≤0.05; n=3 per group per condition. F. Creb1 protein expression and phospho-Creb1 level in hypoxia-treated NRVMS compared to normoxia condition. G. Confocal images depict pH3 positive ventricular myocytes in cyanotic vs noncyanotic TOF. H. PCNA protein expression in cyanotic and noncyanotic TOF patients (n=2 per group). I. RNA-seq derived network analysis displays activated E2F1-regulated cell cycle genes in cyanotic TOF modules. J. Quantitative analysis of p-CREB1/CREB1 ratio (Western blot) for the same individuals presented in (H).

References

    1. Touma M, Kang X, Gao F, Zhao Y, Cass AA, Biniwale R, et al. Wnt11 regulates cardiac chamber development and disease during perinatal maturation. JCI Insight. 2017;2. - PMC - PubMed
    1. Touma M, Reemtsen B, Halnon N, Alejos J, Finn JP, Nelson SF, et al. A Path to Implement Precision Child Health Cardiovascular Medicine. Front Cardiovasc Med. 2017;4:36. - PMC - PubMed
    1. Pierpont ME, Brueckner M, Chung WK, Garg V, Lacro RV, McGuire AL, et al. Genetic Basis for Congenital Heart Disease: Revisited: A Scientific Statement From the American Heart Association. Circulation. 2018;138:e653–e711. - PMC - PubMed
    1. Muntean I, Toganel R, Benedek T Genetics of congenital heart disease: Past and present. Biochem Genet. 2017;55:105–123. - PubMed
    1. Finnemore A, Groves A Physiology of the fetal and transitional circulation. Semin Fetal Neonatal Med. 2015;20:210–216. - PubMed

Publication types

MeSH terms