. 2019 Dec;45(4):401-421.
doi: 10.1007/s10867-019-09536-2. Epub 2019 Dec 13.

A mechanical toy model linking cell-substrate adhesion to multiple cellular migratory responses

Affiliations

A mechanical toy model linking cell-substrate adhesion to multiple cellular migratory responses

Masatomo Iwasa. J Biol Phys. 2019 Dec.

Abstract

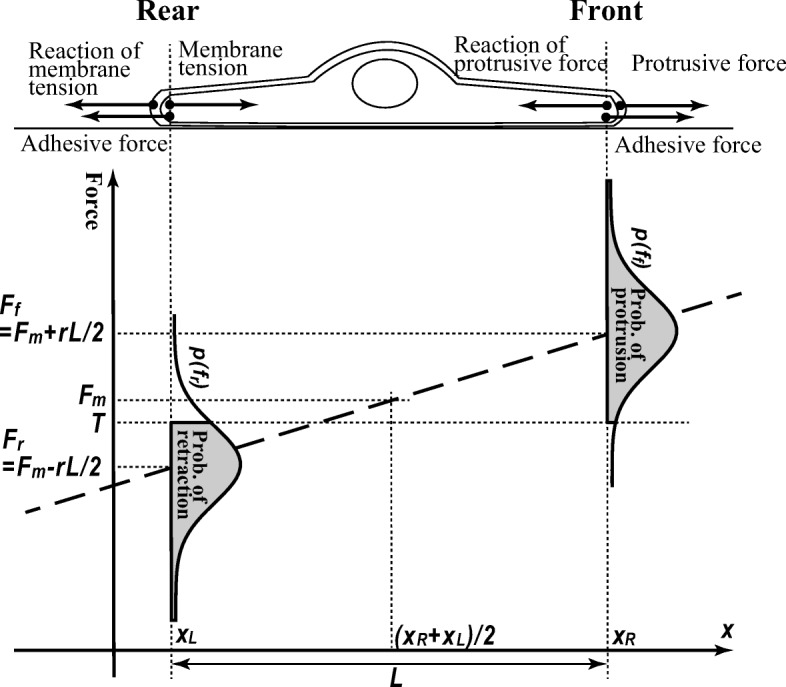
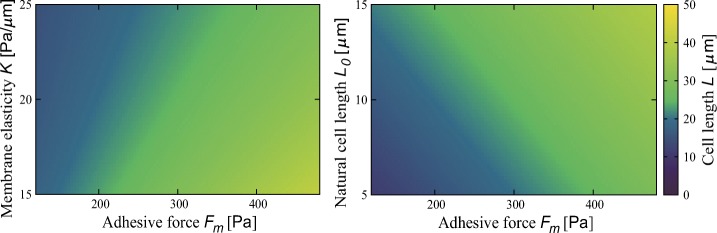
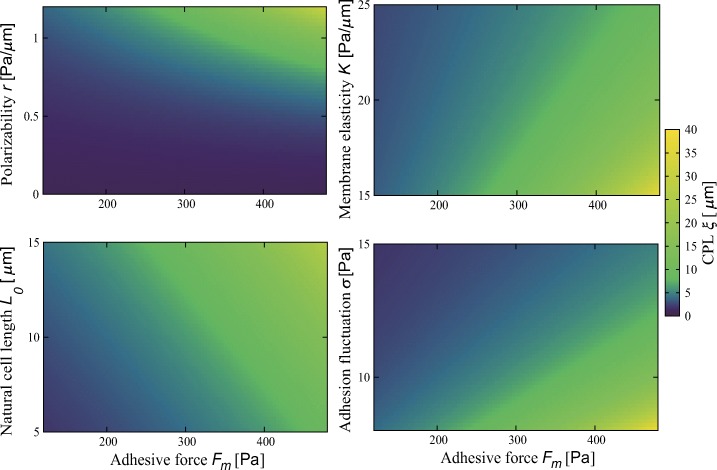
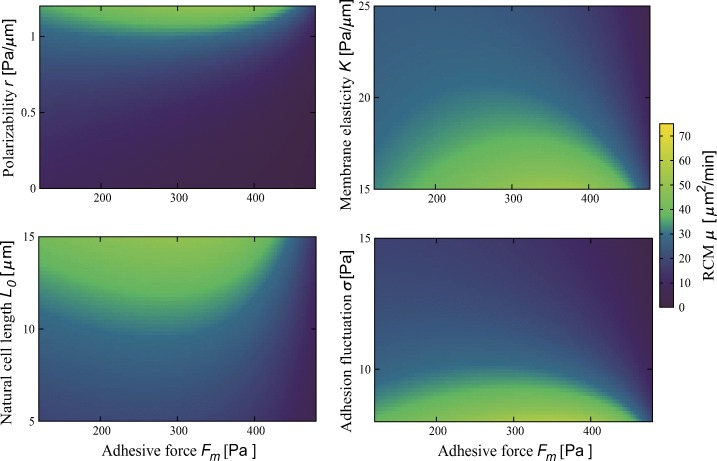
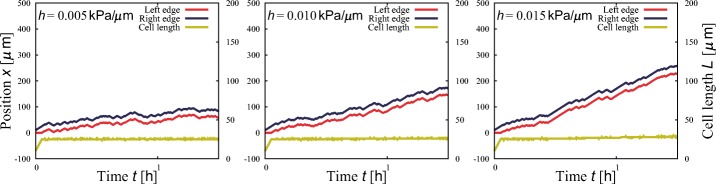
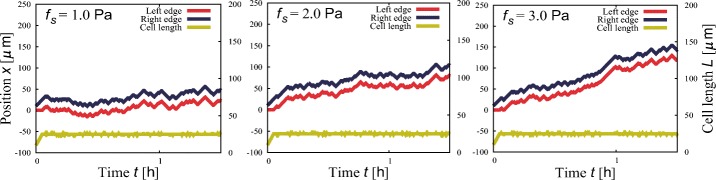
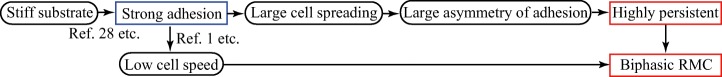
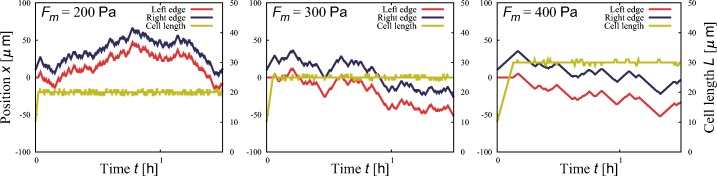
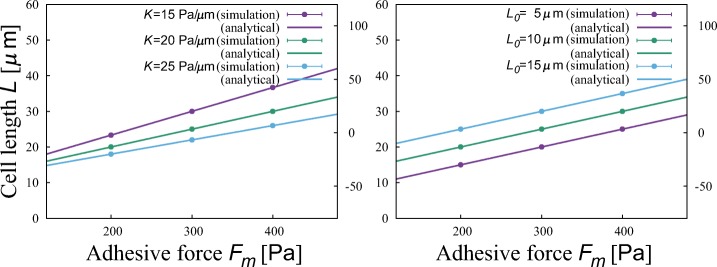
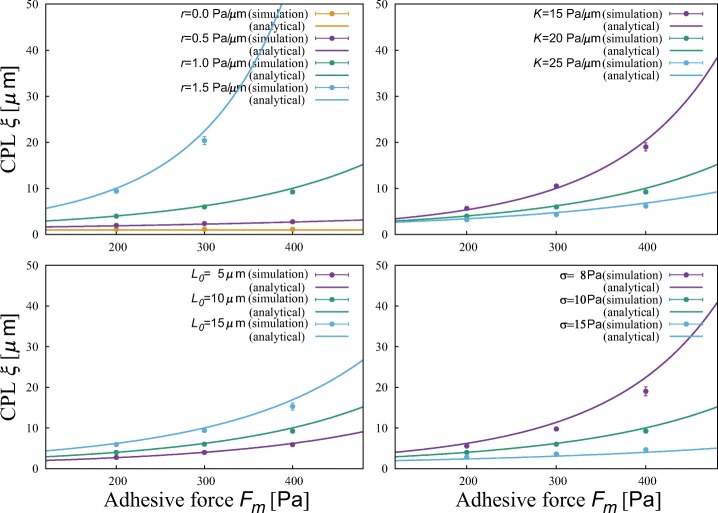
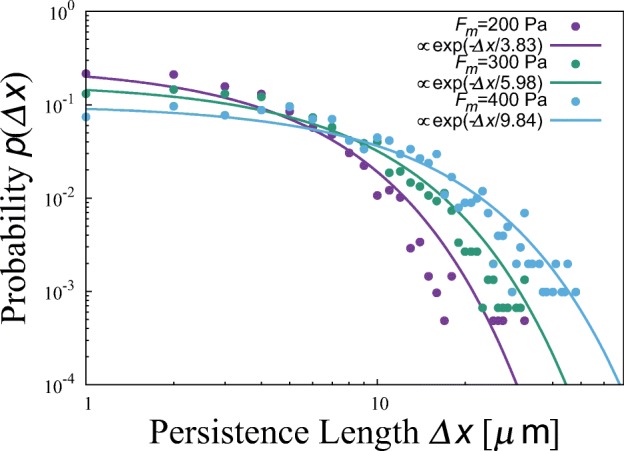
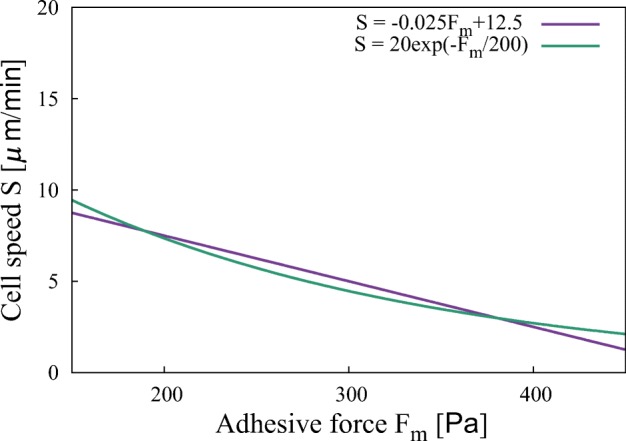
During cell migration, forces applied to a cell from its environment influence the motion. When the cell is placed on a substrate, such a force is provided by the cell-substrate adhesion. Modulation of adhesivity, often performed by the modulation of the substrate stiffness, tends to cause common responses for cell spreading, cell speed, persistence, and random motility coefficient. Although the reasons for the response of cell spreading and cell speed have been suggested, other responses are not well understood. In this study, we develop a simple toy model for cell migration driven by the relation of two forces: the adhesive force and the plasma membrane tension. The simplicity of the model allows us to perform the calculation not only numerically but also analytically, and the analysis provides formulas directly relating the adhesivity to cell spreading, persistence, and the random motility coefficient. Accordingly, the results offer a unified picture on the causal relations between those multiple cellular responses. In addition, cellular properties that would influence the migratory behavior are suggested.

Keywords: Cell migration; Chemokinesis; Modeling; Persistence; Random motility coefficient.


Conflict of interest statement

The author declares that he has no conflict of interest.

Figures

Fig. 1
Fig. 1
Schematic illustration of the model. The cell migrates in a 1D space. The protrusion and retraction of the cell membrane and the switching of the migration direction occur depending on the relation between the membrane tension and the adhesive force at the front and rear
Fig. 2
Fig. 2
The dependence of cell length L on the adhesive force Fm at different membrane elasticity K and natural cell length L0. Parameter values are r = 1.0 Pa/μ m, K = 20 Pa/μ m, L0 = 10 μ m, and σ = 10 Pa when fixed. The dependences on r and σ are not shown because no dependence is observed as inferred from the analytical results
Fig. 3
Fig. 3
The dependence of the characteristic persistence length (CPL) ξ on adhesive force Fm at different polarizability r, membrane elasticity K, natural cell length L0, and adhesivity fluctuation σ. Parameter values are r = 1.0 Pa/μ m, K = 20 Pa/μ m and L0 = 10 μ m, and σ = 10 Pa when fixed
Fig. 4
Fig. 4
The dependence of random motility coefficient (RMC) μ on adhesive force Fm at different polarizability r, membrane elasticity K, natural cell length L0, and adhesivity fluctuation σ. Parameter values are r = 1.0 Pa/μ m, K = 20 Pa/μ m, L0 = 10 μ m, and σ = 10 Pa when fixed
Fig. 5
Fig. 5
Directed cell migration induced by substrate stiffness gradients, namely durotaxis, at three gradients: h = 0.005, 0.010, and 0.015 kPa/μ m. Other parameter values are Fm = 300 Pa, r = 1.0 Pa/μ m, K = 20 Pa/μ m, L0 = 10 μ m, and σ = 10 Pa
Fig. 6
Fig. 6
Directed cell migration induced by a fluid flow providing shear stresses at three stresses: fs = 1.0, 2.0, and 3.0 Pa. Other parameter values are Fm = 300 Pa, r = 1.0 Pa/μ m, K = 20 Pa/μ m, L0 = 10 μ m, and σ = 10 Pa
Fig. 7
Fig. 7
Causal relations generating cellular migratory behavior in response to mechanical interaction with the substrate
Fig. 8
Fig. 8
Typical time evolutions of the position of the cell’s left edge (red) and right edge (blue) and the cell length (yellow) at three adhesivities: Fm = 200, 300, and 400 Pa. Stronger adhesion induces higher persistence and larger cell spreading. Other parameter values are r = 1.0 Pa/μ m, K = 20 Pa/μ m, L0 = 10 μ m, and σ = 10 Pa
Fig. 9
Fig. 9
The dependence of the cell length L on the adhesive force Fm at different membrane elasticity K and natural cell length L0. Points and lines are respectively obtained from the numerical simulation and the analysis. Error bars representing the standard deviation are short and invisible. Parameter values are r = 1.0 Pa/μ m, K = 20 Pa/μ m, L0 = 10 μ m, and σ = 10 Pa when fixed. The dependences on r and σ are not shown because no dependence is observed as inferred from the analytical results
Fig. 10
Fig. 10
The dependence of the characteristic persistence length (CPL) ξ on the adhesive force Fm at different polarizability r, membrane elasticity K, natural cell length L0, and adhesivity fluctuation σ. Points and lines are respectively obtained from the numerical simulation and the analysis. Error bars represent the standard deviations. Parameter values are r = 1.0 Pa/μ m, K = 20 Pa/μ m, L0 = 10 μ m, and σ = 10 Pa when fixed
Fig. 11
Fig. 11
Probability distributions of persistence length Δx obtained by numerical simulations at three adhesivities: Fm = 200, 300, and 400 Pa. Other parameter values are r = 1.0 Pa/μ m, K = 20 Pa/μ m, L0 = 10 μ m, and σ = 10 Pa. All of them are well described by exponential functions, exp(-Δx/ξ), whose characteristic persistence lengths (CPL) ξ are 3.83, 5.98, 9.84 μ m
Fig. 12
Fig. 12
Two functions for cell speed that produce qualitatively different random motility coefficients. The linear function (violet line) results in Fig. 4 in the main text. The exponential function (green line) leads to Fig. 13
Fig. 13
Fig. 13
The dependence of random motility coefficient on mean adhesive force Fm at different values of polarizability r, membrane elasticity K, natural cell length L0, and adhesion fluctuation σ when an exponential function is used to describe the cell speed. Parameter values are r = 1.0 Pa/μ m, K = 20 Pa/μ m, L0 = 10 μ m, and σ = 10 Pa when fixed

Similar articles

References

    1. Oakes PW, Patel DC, Morin NA, Zitterbart DP, Fabry B, Reichner JS, Tang JX. Neutrophil morphology and migration are affected by substrate elasticity. Blood. 2009;114:1387–1395. - PMC - PubMed
    1. Jannat RA, Dembo M, Hammer DA. Traction forces of neutrophils migrating on compliant substrates. Biophys. J. 2011;101:575–584. - PMC - PubMed
    1. Lo CM, Wang HB, Dembo M, Wang YL. Cell movement is guided by the rigidity of the substrate. Biophys. J. 2000;79:144–152. - PMC - PubMed
    1. Wang HB, Dembo M, Wang YL. Substrate flexibility regulates growth and apoptosis of normal but not transformed cells. Am. J. Physiol. Cell Physiol. 2000;279:C1345–C1350. - PubMed
    1. Paszek MJ, Zahir N, Johnson KR, Lakins JN, Rozenberg GI, Gefen A, Reinhart-King CA, Margulies SS, Dembo M, Boettiger D, Hammer DA, Weaver VM. Tensional homeostasis and the malignant phenotype. Cancer Cell. 2005;8:241–254. - PubMed

Publication types

LinkOut - more resources