

Estimation of temporal covariances in pathogen dynamics using Bayesian multivariate autoregressive models
- PMID: 31834896
- PMCID: PMC6934324
- DOI: 10.1371/journal.pcbi.1007492
Estimation of temporal covariances in pathogen dynamics using Bayesian multivariate autoregressive models
Abstract
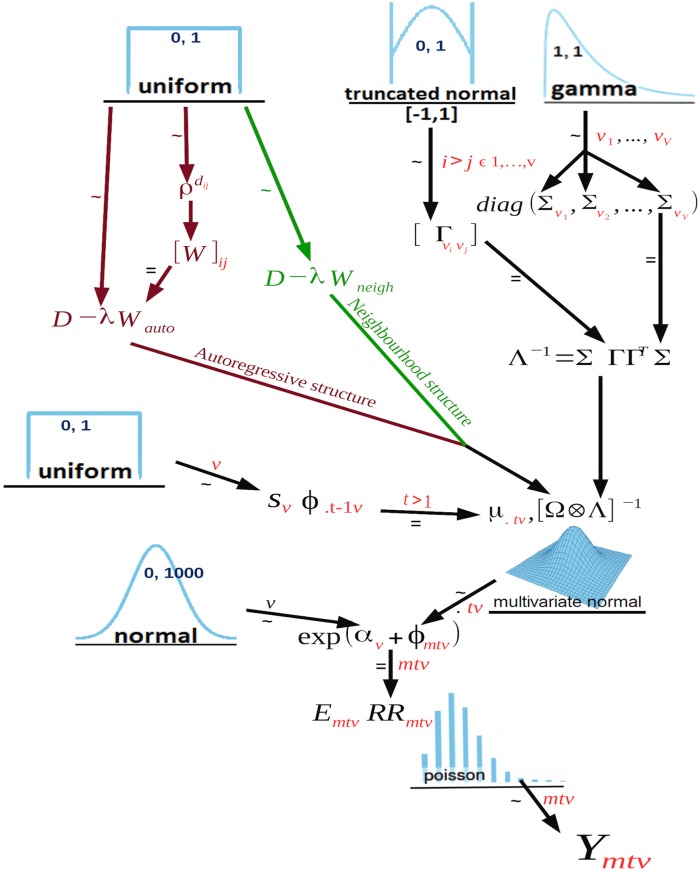
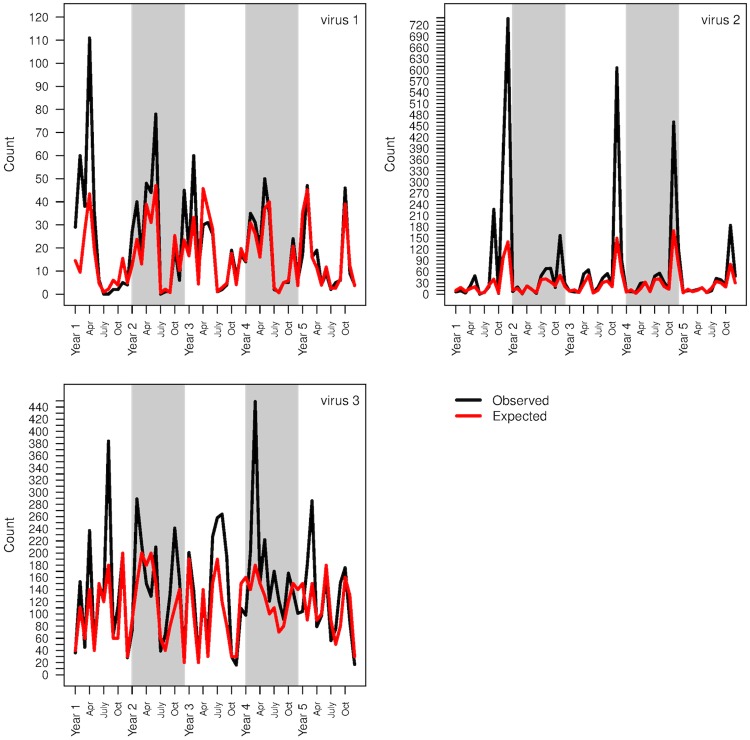
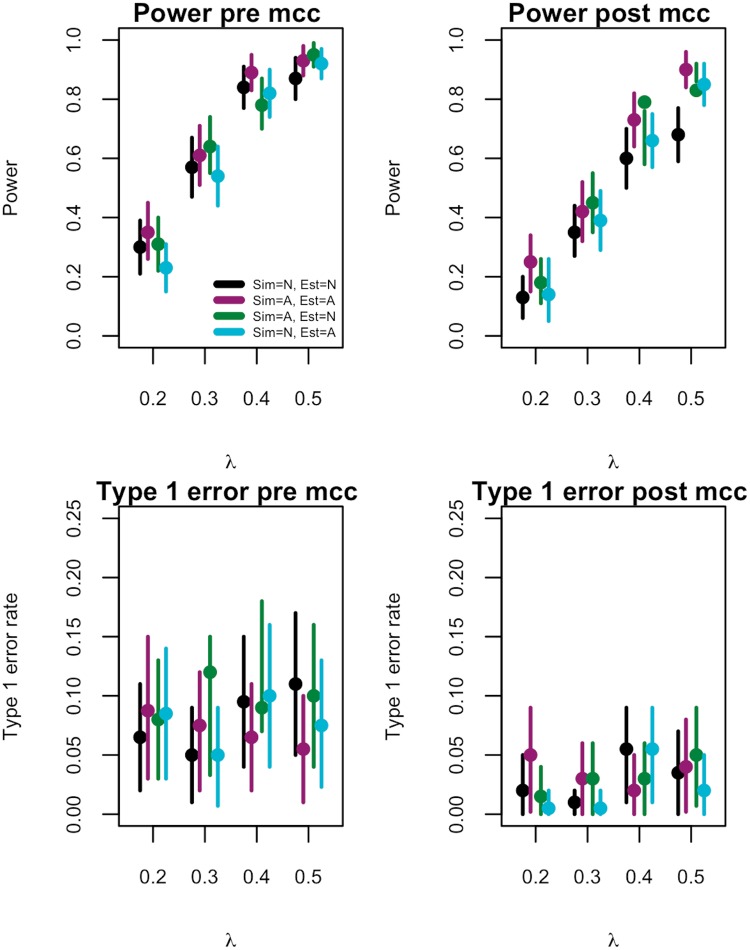
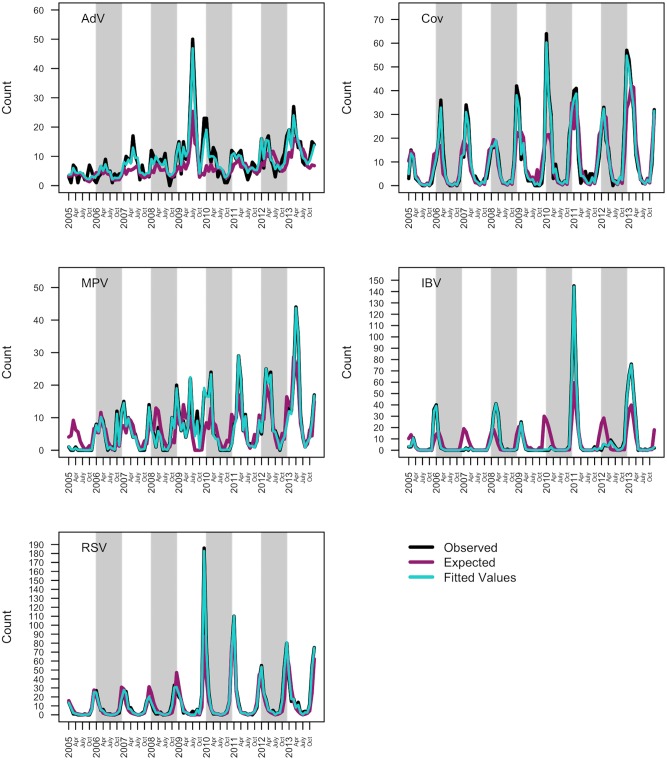
It is well recognised that animal and plant pathogens form complex ecological communities of interacting organisms within their hosts, and there is growing interest in the health implications of such pathogen interactions. Although community ecology approaches have been used to identify pathogen interactions at the within-host scale, methodologies enabling robust identification of interactions from population-scale data such as that available from health authorities are lacking. To address this gap, we developed a statistical framework that jointly identifies interactions between multiple viruses from contemporaneous non-stationary infection time series. Our conceptual approach is derived from a Bayesian multivariate disease mapping framework. Importantly, our approach captures within- and between-year dependencies in infection risk while controlling for confounding factors such as seasonality, demographics and infection frequencies, allowing genuine pathogen interactions to be distinguished from simple correlations. We validated our framework using a broad range of synthetic data. We then applied it to diagnostic data available for five respiratory viruses co-circulating in a major urban population between 2005 and 2013: adenovirus, human coronavirus, human metapneumovirus, influenza B virus and respiratory syncytial virus. We found positive and negative covariances indicative of epidemiological interactions among specific virus pairs. This statistical framework enables a community ecology perspective to be applied to infectious disease epidemiology with important utility for public health planning and preparedness.
Conflict of interest statement
The authors have declared that no competing interests exist.
Figures
References
Publication types
MeSH terms
Grants and funding
- MR/S004815/1/MRC_/Medical Research Council/United Kingdom
- BB/L018926/1/BB_/Biotechnology and Biological Sciences Research Council/United Kingdom
- BB/M003949/1/BB_/Biotechnology and Biological Sciences Research Council/United Kingdom
- BB/L004070/1/BB_/Biotechnology and Biological Sciences Research Council/United Kingdom
- BB/R012679/1/BB_/Biotechnology and Biological Sciences Research Council/United Kingdom
LinkOut - more resources
Full Text Sources
Miscellaneous
