

Genomic Relationships, Novel Loci, and Pleiotropic Mechanisms across Eight Psychiatric Disorders
- PMID: 31835028
- PMCID: PMC7077032
- DOI: 10.1016/j.cell.2019.11.020
Genomic Relationships, Novel Loci, and Pleiotropic Mechanisms across Eight Psychiatric Disorders
Abstract
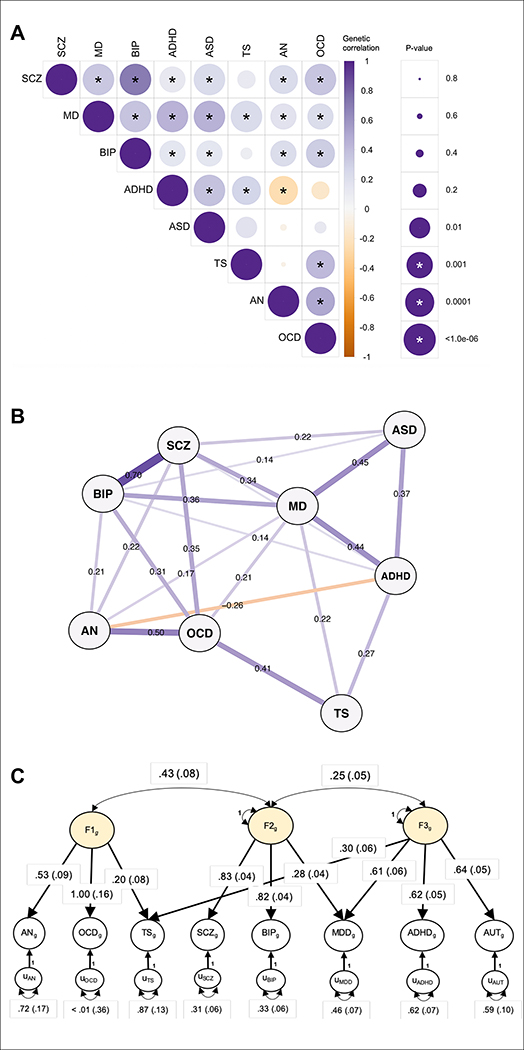
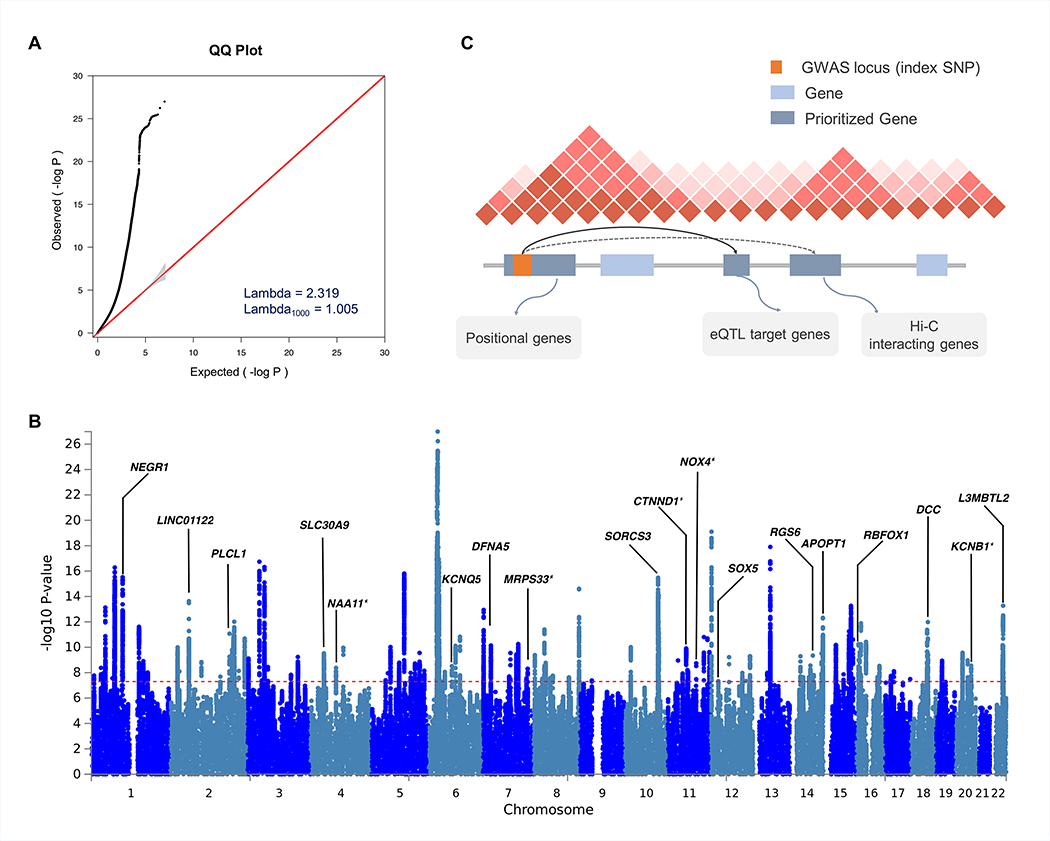
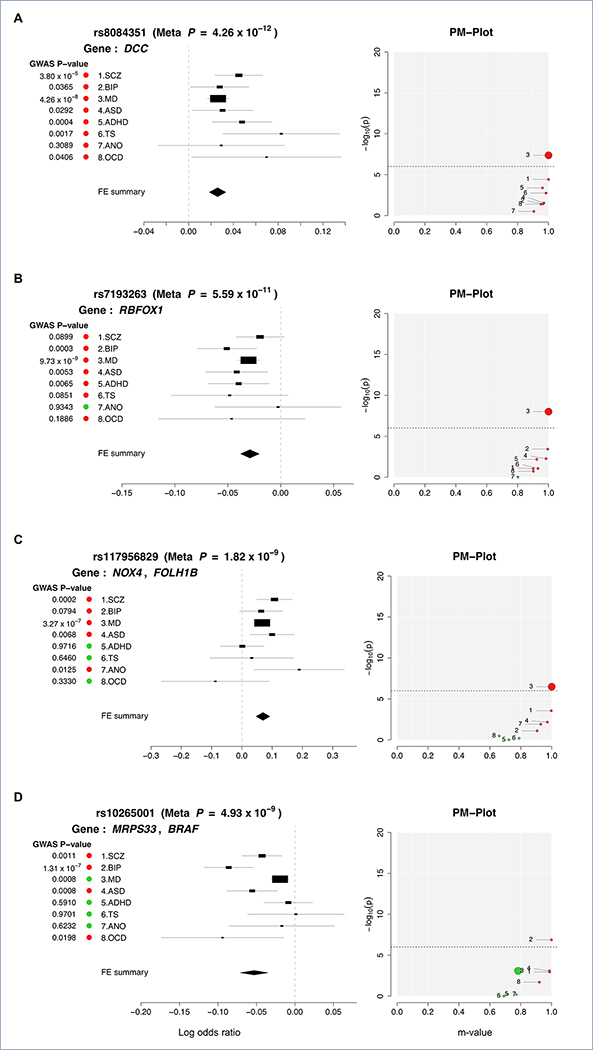
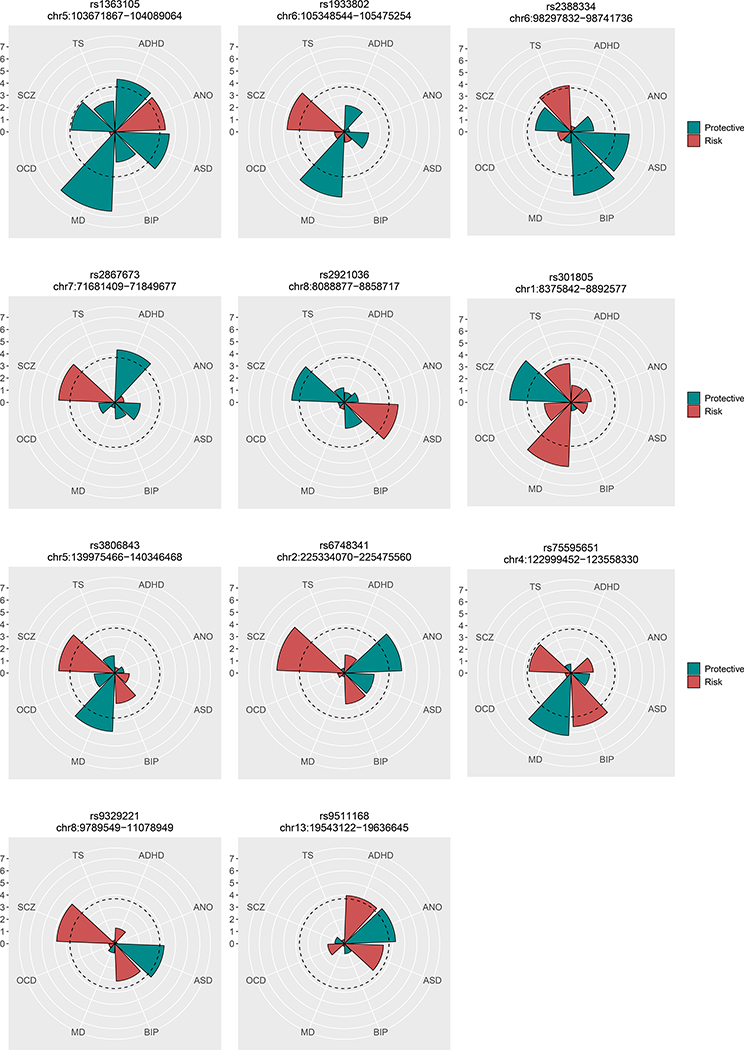
Genetic influences on psychiatric disorders transcend diagnostic boundaries, suggesting substantial pleiotropy of contributing loci. However, the nature and mechanisms of these pleiotropic effects remain unclear. We performed analyses of 232,964 cases and 494,162 controls from genome-wide studies of anorexia nervosa, attention-deficit/hyperactivity disorder, autism spectrum disorder, bipolar disorder, major depression, obsessive-compulsive disorder, schizophrenia, and Tourette syndrome. Genetic correlation analyses revealed a meaningful structure within the eight disorders, identifying three groups of inter-related disorders. Meta-analysis across these eight disorders detected 109 loci associated with at least two psychiatric disorders, including 23 loci with pleiotropic effects on four or more disorders and 11 loci with antagonistic effects on multiple disorders. The pleiotropic loci are located within genes that show heightened expression in the brain throughout the lifespan, beginning prenatally in the second trimester, and play prominent roles in neurodevelopmental processes. These findings have important implications for psychiatric nosology, drug development, and risk prediction.
Keywords: GWAS; Psychiatric genetics; cross-disorder genetics; functional genomics; gene expression; genetic architecture; genetic correlation; neurodevelopment; pleiotropy; psychiatric disorders.
Copyright © 2019 Elsevier Inc. All rights reserved.
Figures
References
-
- Baurecht H, Hotze M, Brand S, Buning C, Cormican P, Corvin A, Ellinghaus D, Ellinghaus E, Esparza-Gordillo J, Folster-Holst R, et al. (2015). Genome-wide comparative analysis of atopic dermatitis and psoriasis gives insight into opposing genetic mechanisms. Am J Hum Genet 96, 104–120. - PMC - PubMed
-
- Bhattacharjee S, Rajaraman P, Jacobs KB, Wheeler WA, Melin BS, Hartge P, GliomaScan C, Yeager M, Chung CC, Chanock SJ, et al. (2012). A subset-based approach improves power and interpretation for the combined analysis of genetic association studies of heterogeneous traits. Am J Hum Genet 90, 821–835. - PMC - PubMed
Publication types
MeSH terms
Grants and funding
- R01 MH092513/MH/NIMH NIH HHS/United States
- R01 MH100027/MH/NIMH NIH HHS/United States
- R01 MH085548/MH/NIMH NIH HHS/United States
- R00 MH101367/MH/NIMH NIH HHS/United States
- R01 MH114927/MH/NIMH NIH HHS/United States
- U01 MH094432/MH/NIMH NIH HHS/United States
- K01 MH109765/MH/NIMH NIH HHS/United States
- R01 MH119243/MH/NIMH NIH HHS/United States
- U01 MH085518/MH/NIMH NIH HHS/United States
- R01 NS102371/NS/NINDS NIH HHS/United States
- U01 MH085520/MH/NIMH NIH HHS/United States
- R01 MH106547/MH/NIMH NIH HHS/United States
- R00 AG054573/AG/NIA NIH HHS/United States
- U01 MH085513/MH/NIMH NIH HHS/United States
- U01 HG004438/HG/NHGRI NIH HHS/United States
- R01 MH119084/MH/NIMH NIH HHS/United States
- U01 MH109499/MH/NIMH NIH HHS/United States
- R01 MH079487/MH/NIMH NIH HHS/United States
- U01 HG004446/HG/NHGRI NIH HHS/United States
- K01 MH109782/MH/NIMH NIH HHS/United States
- K01 MH106675/MH/NIMH NIH HHS/United States
- R01 MH104964/MH/NIMH NIH HHS/United States
- R01 MH115993/MH/NIMH NIH HHS/United States
- G1000708/MRC_/Medical Research Council/United Kingdom
- R01 MH071507/MH/NIMH NIH HHS/United States
- K01 AA025113/AA/NIAAA NIH HHS/United States
- R01 NS105746/NS/NINDS NIH HHS/United States
- R00 MH113823/MH/NIMH NIH HHS/United States
- K99 AG054573/AG/NIA NIH HHS/United States
- P01 CA089392/CA/NCI NIH HHS/United States
- K01 DK114379/DK/NIDDK NIH HHS/United States
- U01 NS040024/NS/NINDS NIH HHS/United States
- R21 MH087748/MH/NIMH NIH HHS/United States
- U01 MH094411/MH/NIMH NIH HHS/United States
- R01 MH096767/MH/NIMH NIH HHS/United States
- P30 NS062691/NS/NINDS NIH HHS/United States
- R01 MH079488/MH/NIMH NIH HHS/United States
- R01 NS016648/NS/NINDS NIH HHS/United States
- K08 MH099424/MH/NIMH NIH HHS/United States
- R01 MH092289/MH/NIMH NIH HHS/United States
- G0200243/MRC_/Medical Research Council/United Kingdom
- R01 MH079489/MH/NIMH NIH HHS/United States
- K01 MH100435/MH/NIMH NIH HHS/United States
- MR/P005748/1/MRC_/Medical Research Council/United Kingdom
- U01 HG004422/HG/NHGRI NIH HHS/United States
- K02 NS085048/NS/NINDS NIH HHS/United States
- U01 MH109536/MH/NIMH NIH HHS/United States
- R01 MH079494/MH/NIMH NIH HHS/United States
- U01 MH109501/MH/NIMH NIH HHS/United States
- R01 DA013423/DA/NIDA NIH HHS/United States
- R01 NS040024/NS/NINDS NIH HHS/United States
- U01 MH109514/MH/NIMH NIH HHS/United States
- R01 MH123451/MH/NIMH NIH HHS/United States
- R01 MH117599/MH/NIMH NIH HHS/United States
- DP2 MH122403/MH/NIMH NIH HHS/United States
- U01 MH109532/MH/NIMH NIH HHS/United States
- U01 MH085508/MH/NIMH NIH HHS/United States
- K01 MH113848/MH/NIMH NIH HHS/United States
- R01 MH115963/MH/NIMH NIH HHS/United States
- R01 MH092293/MH/NIMH NIH HHS/United States
- U01 MH109539/MH/NIMH NIH HHS/United States
- U01 MH094421/MH/NIMH NIH HHS/United States
- U10 AA008401/AA/NIAAA NIH HHS/United States
- U01 HG008685/HG/NHGRI NIH HHS/United States
- R01 MH113362/MH/NIMH NIH HHS/United States
- U01 MH109528/MH/NIMH NIH HHS/United States
- U01 MH096296/MH/NIMH NIH HHS/United States
- R13 MH073250/MH/NIMH NIH HHS/United States
LinkOut - more resources
Full Text Sources
Other Literature Sources
Medical
