

A Hierarchical Machine Learning Model to Discover Gleason Grade-Specific Biomarkers in Prostate Cancer
- PMID: 31835700
- PMCID: PMC6963340
- DOI: 10.3390/diagnostics9040219
A Hierarchical Machine Learning Model to Discover Gleason Grade-Specific Biomarkers in Prostate Cancer
Abstract
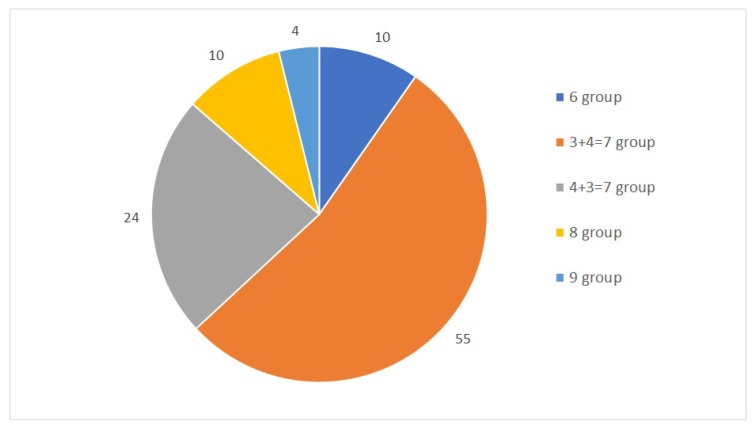
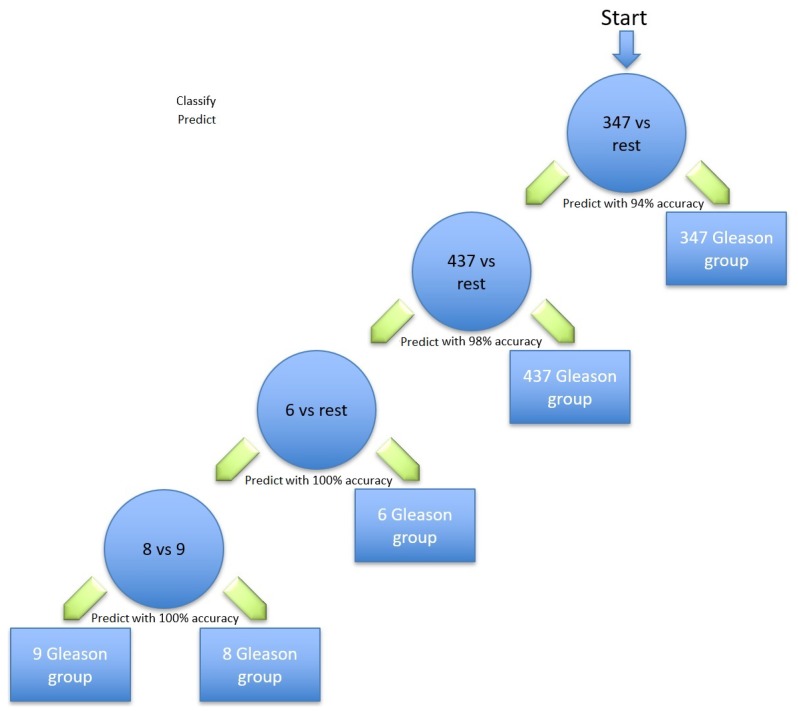
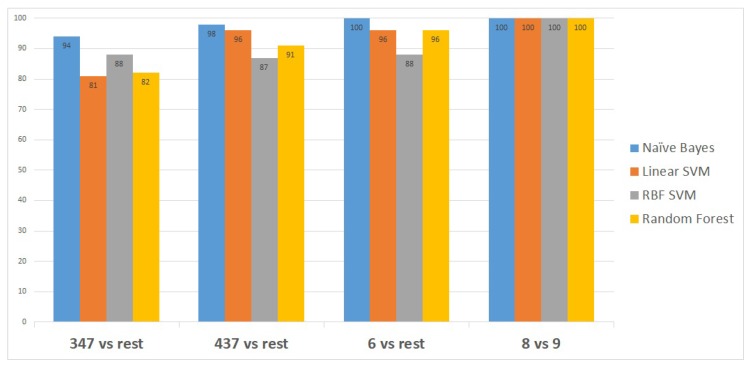
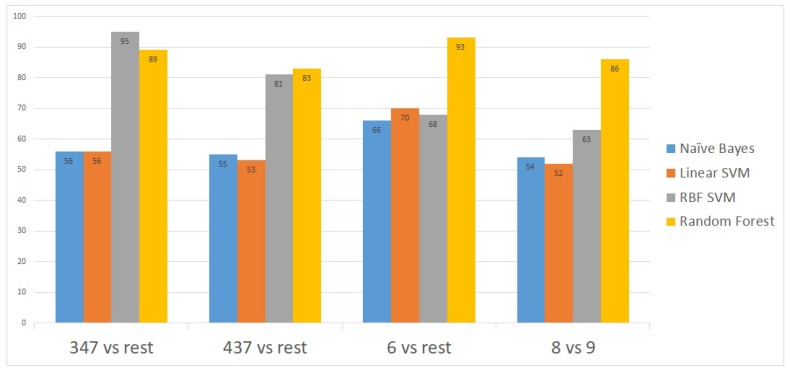
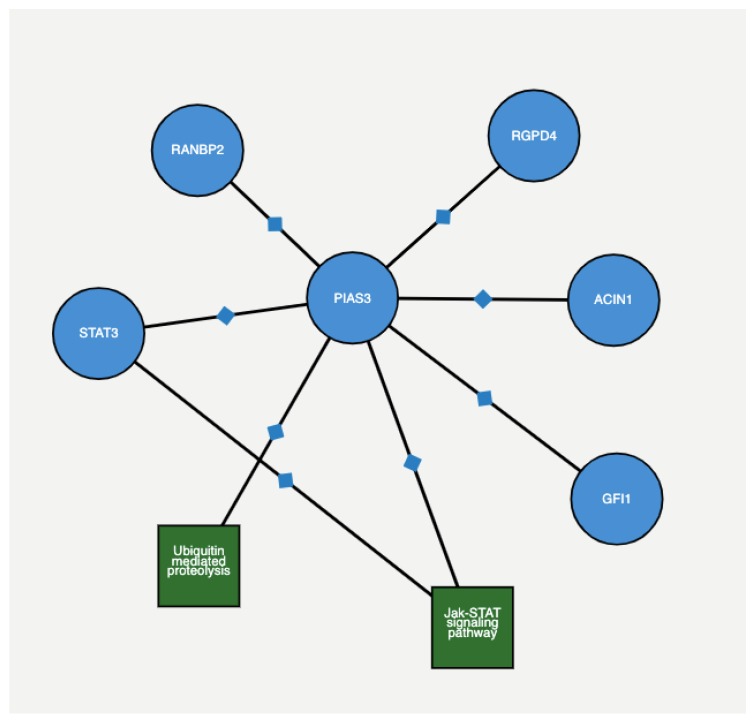
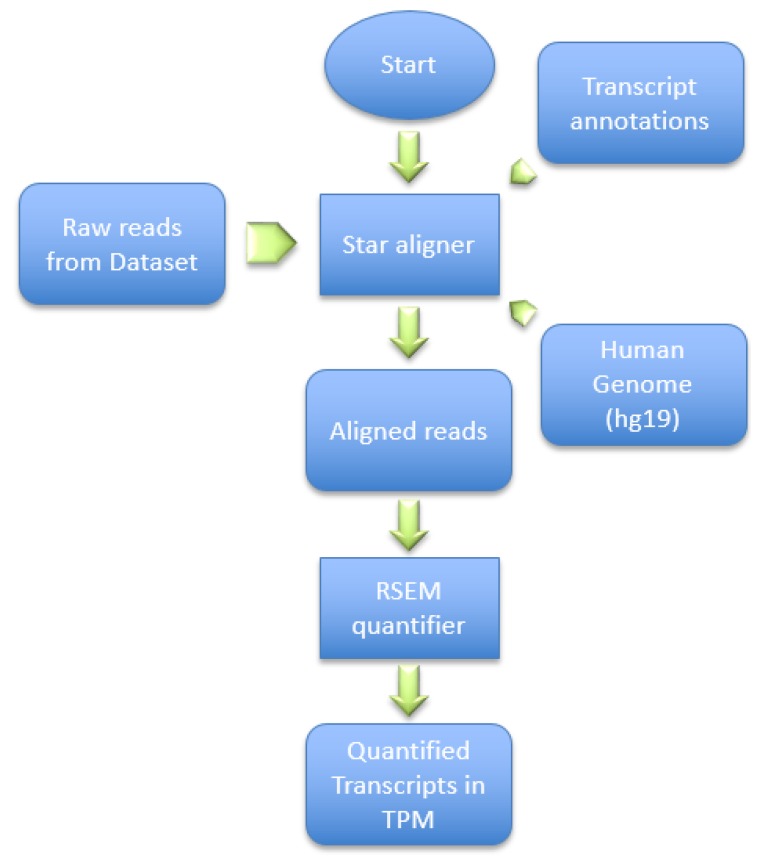
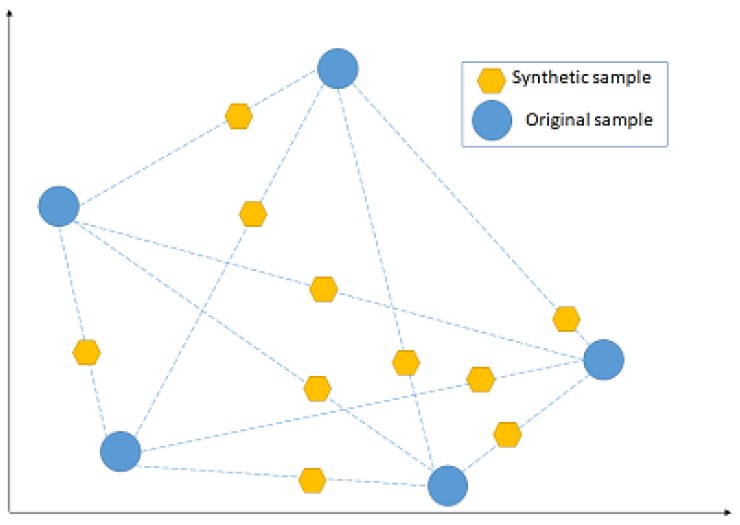
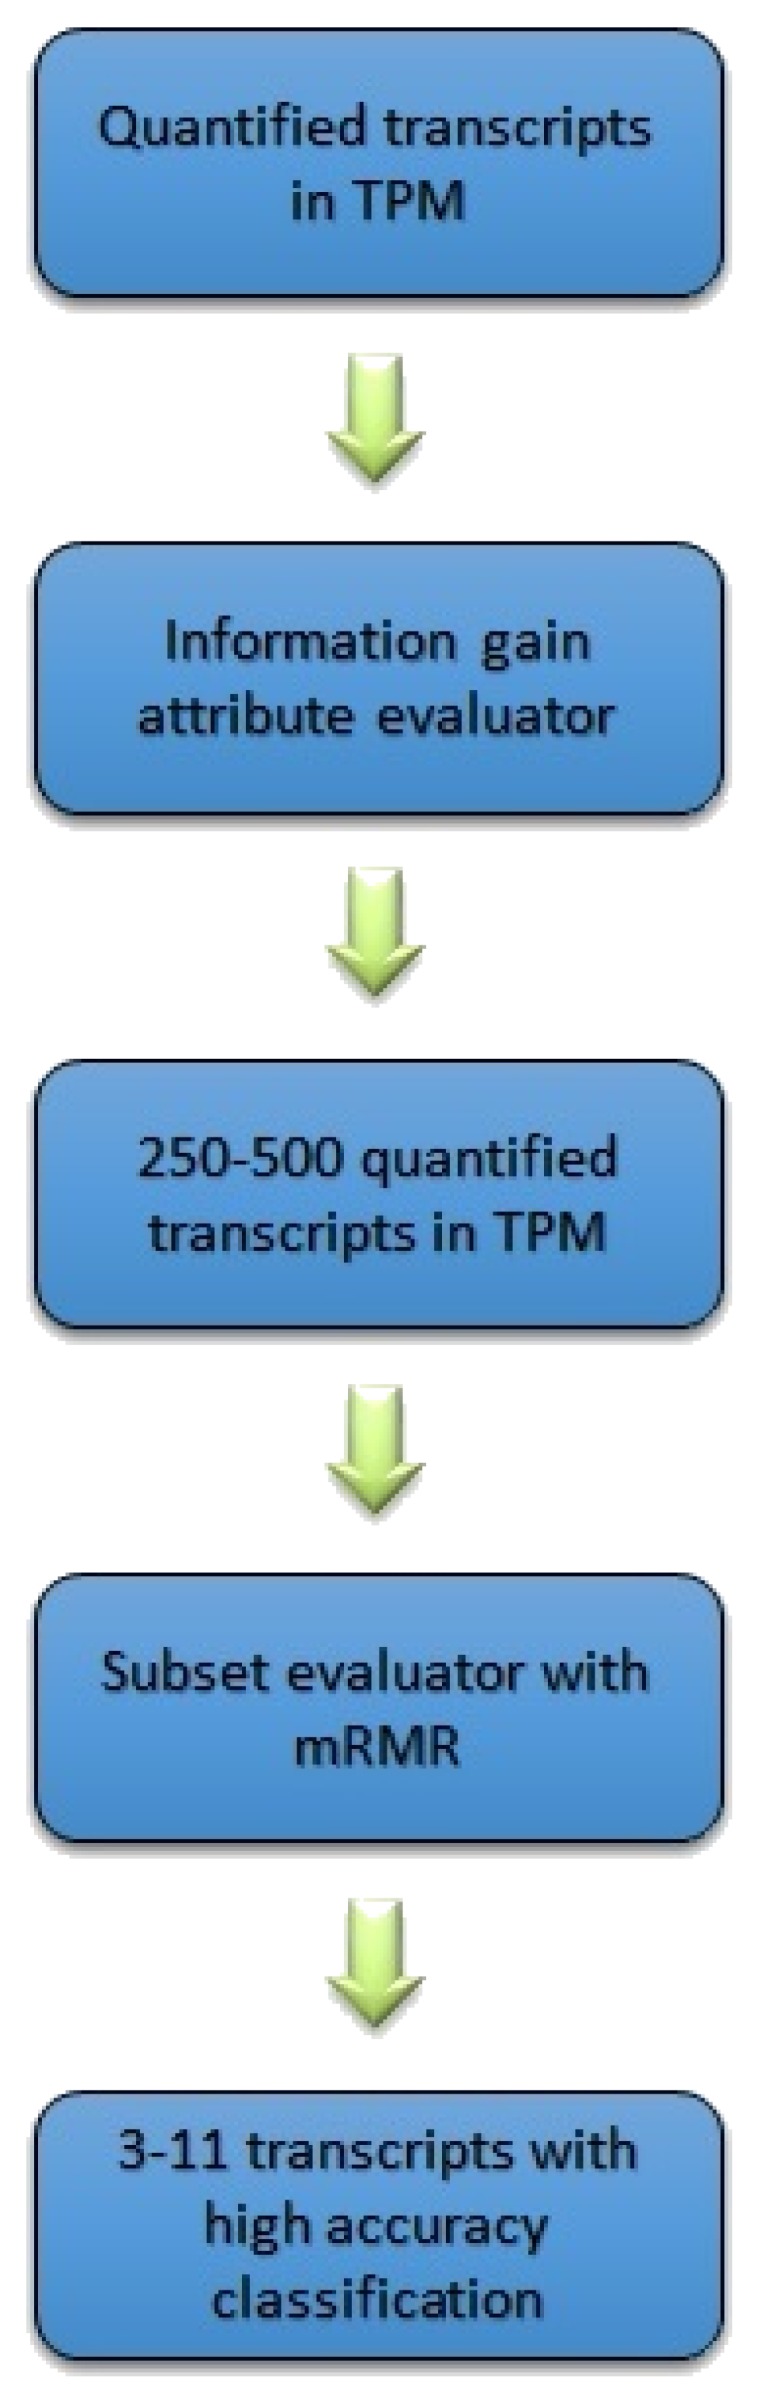
(1) Background:One of the most common cancers that affect North American men and men worldwide is prostate cancer. The Gleason score is a pathological grading system to examine the potential aggressiveness of the disease in the prostate tissue. Advancements in computing and next-generation sequencing technology now allow us to study the genomic profiles of patients in association with their different Gleason scores more accurately and effectively. (2) Methods: In this study, we used a novel machine learning method to analyse gene expression of prostate tumours with different Gleason scores, and identify potential genetic biomarkers for each Gleason group. We obtained a publicly-available RNA-Seq dataset of a cohort of 104 prostate cancer patients from the National Center for Biotechnology Information's (NCBI) Gene Expression Omnibus (GEO) repository, and categorised patients based on their Gleason scores to create a hierarchy of disease progression. A hierarchical model with standard classifiers in different Gleason groups, also known as nodes, was developed to identify and predict nodes based on their mRNA or gene expression. In each node, patient samples were analysed via class imbalance and hybrid feature selection techniques to build the prediction model. The outcome from analysis of each node was a set of genes that could differentiate each Gleason group from the remaining groups. To validate the proposed method, the set of identified genes were used to classify a second dataset of 499 prostate cancer patients collected from cBioportal. (3) Results: The overall accuracy of applying this novel method to the first dataset was 93.3%; the method was further validated to have 87% accuracy using the second dataset. This method also identified genes that were not previously reported as potential biomarkers for specific Gleason groups. In particular, PIAS3 was identified as a potential biomarker for Gleason score 4 + 3 = 7, and UBE2V2 for Gleason score 6. (4) Insight: Previous reports show that the genes predicted by this newly proposed method strongly correlate with prostate cancer development and progression. Furthermore, pathway analysis shows that both PIAS3 and UBE2V2 share similar protein interaction pathways, the JAK/STAT signaling process.
Keywords: Gleason score detection; classification; next generation sequencing; prostate cancer; supervised learning; transcriptomics.
Conflict of interest statement
The funders had no role in the design of the study; in the collection, analyses, or interpretation of data; in the writing of the manuscript, or in the decision to publish the results.
Figures
References
-
- Gospodarowicz M., Benedet L., Hutter R.V., Fleming I., Henson D.E., Sobin L.H. History and international developments in cancer staging. Cancer Prev. Control CPC Prev. Controle en Cancerol. PCC. 1998;2:262–268. - PubMed
-
- Epstein J.I., Zelefsky M.J., Sjoberg D.D., Nelson J.B., Egevad L., Magi-Galluzzi C., Vickers A.J., Parwani A.V., Reuter V.E., Fine S.W., et al. A contemporary prostate cancer grading system: A validated alternative to the Gleason score. Eur. Urol. 2016;69:428–435. doi: 10.1016/j.eururo.2015.06.046. - DOI - PMC - PubMed
Grants and funding
LinkOut - more resources
Full Text Sources
Other Literature Sources
