

The basic reproductive number for disease systems with multiple coupled heterogeneities
- PMID: 31836567
- PMCID: PMC7905963
- DOI: 10.1016/j.mbs.2019.108294
The basic reproductive number for disease systems with multiple coupled heterogeneities
Abstract
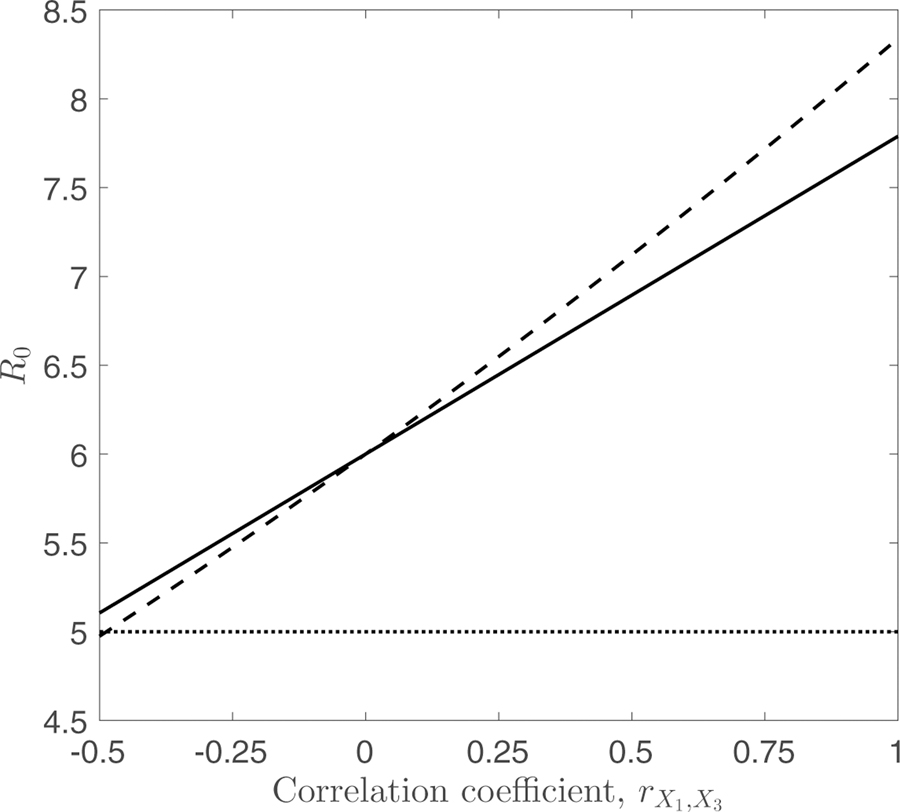
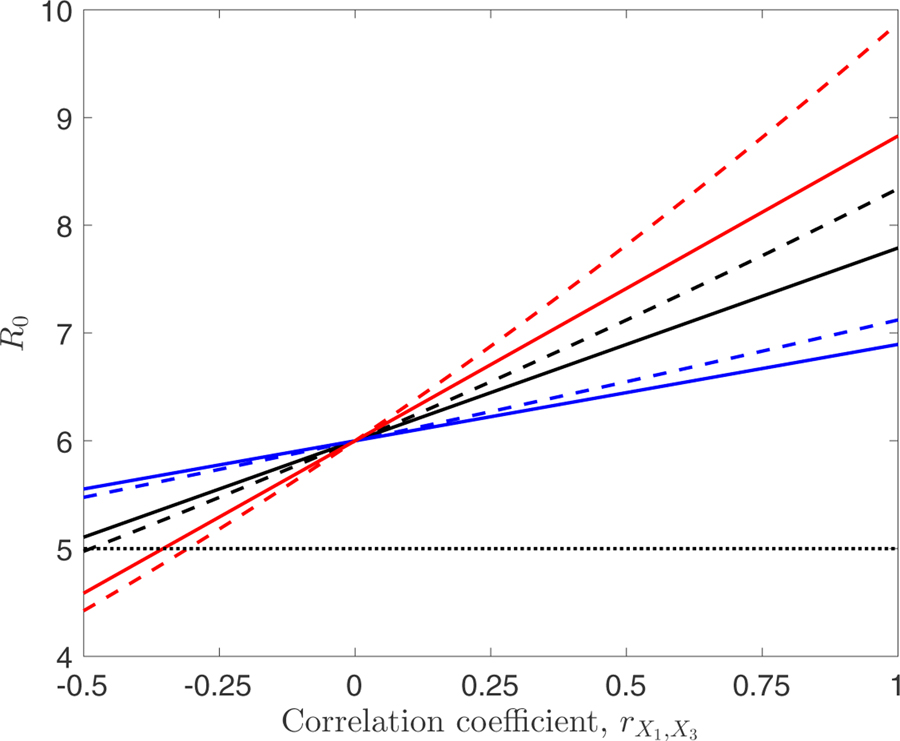
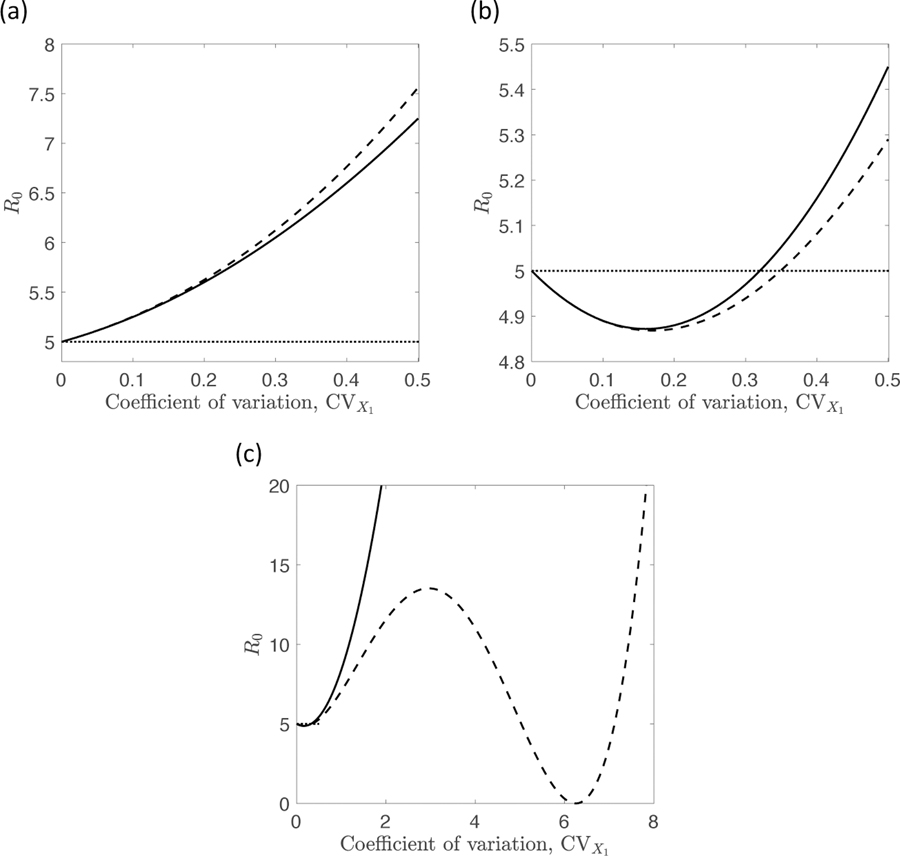
In mathematical epidemiology, a well-known formula describes the impact of heterogeneity on the basic reproductive number, R0, for situations in which transmission is separable and for which there is one source of variation in susceptibility and one source of variation in infectiousness. This formula is written in terms of the magnitudes of the heterogeneities, as quantified by their coefficients of variation, and the correlation between them. A natural question to ask is whether analogous results apply when there are multiple sources of variation in susceptibility and/or infectiousness. In this paper we demonstrate that with three or more coupled heterogeneities, R0 under separable transmission depends on details of the distribution of the heterogeneities in a way that is not seen in the well-known simpler situation. We provide explicit formulae for the cases of multivariate normal and multivariate log-normal distributions, showing that R0 can again be expressed in terms of the magnitudes of the heterogeneities and the pairwise correlations between them. The formulae, however, differ between the two multivariate distributions, demonstrating that no formula of this type applies generally when there are three or more coupled heterogeneities. We see that the results of the formulae are approximately equal when heterogeneities are relatively small and show that an earlier result in the literature (Koella, 1991) should be viewed in this light. We provide numerical illustrations of our results and discuss a setting in which coupled heterogeneities are likely to have a major impact on the value of R0. We also describe a rather surprising result: in a system with three heterogeneities, R0 can exhibit non-monotonic behavior with increasing levels of heterogeneity, in marked contrast to the familiar two heterogeneity setting in which R0 either increases or decreases with increasing heterogeneity.
Keywords: Basic reproductive number; Coupled heterogeneities; Disease transmission model; Heterogeneity.
Copyright © 2019 Elsevier Inc. All rights reserved.
Conflict of interest statement
Declaration of Competing Interest The authors declare that they have no known competing financial interests or personal relationshipsthat could have appeared to influence the work reported in this paper.
Figures
References
-
- Anderson RM, May RM, 1991. Infectious Diseases of Humans. Oxford University Press, Oxford.
-
- Anderson RM, Medley GF, May RM, Johnson AM, 1986. A preliminary study of the transmission dynamics of the human immunodeficiency virus (HIV), the causative agent of AIDS. IMA J. Math. Appl. Med. Biol 3, 229–263. - PubMed
-
- Bär W, Dittrich F, 1971. Useful formula for moment computation of normal random variables with nonzero means. IEEE Trans. Auto. Control 16, 263–265.
-
- Bendat JS, Piersol AG, 1966. Random Data: Analysis and Measurement Procedures. Wiley.
-
- Cario MC, Nelson BL, 1997. Modeling and generating random vectors with arbitrary marginal distributions and correlation matrix Technical Report, Department of Industrial Engineering and Management Sciences, Northwestern University, Evanston, IL.
Publication types
MeSH terms
Grants and funding
LinkOut - more resources
Full Text Sources
